

Summary
Background
The majority of asthma exacerbations are related to viral respiratory infections. Some, but not all, previous studies have reported that low interferon responses in patients with asthma increase the risk for virus‐induced exacerbations.
Objective
We sought to determine the relationship between lower airway inflammatory biomarkers, specifically interferon gene expression, and the severity or presence of an exacerbation in asthmatics experiencing a naturally occurring viral infection.
Methods
Sputum samples were analysed from subjects in an asthma exacerbation study who experienced a confirmed viral infection. Subjects were monitored for daily symptoms, medication use and peak expiratory flow rate until baseline. Sputum samples were assessed for cell counts and gene expression.
Results
Interferon gamma expression was significantly greater in patients with asthma exacerbations compared to non‐exacerbating patients (P = 0.002). IFN‐α1, IFN‐β1 and IFN‐γ mRNA levels correlated with the peak Asthma Index (r = 0.58, P < 0.001; r = 0.57, P = 0.001; and r = 0.51, P = 0.004, respectively). Additionally, IL‐13, IL‐10 and eosinophil major basic protein mRNA levels were greater in patients with asthma exacerbations compared to non‐exacerbating patients (P = 0.03, P = 0.06 and P = 0.02, respectively), and IL‐13 mRNA correlated with the peak Asthma Index (P = 0.006).
Conclusions
Our findings indicate that asthma exacerbations are associated with increased rather than decreased expression of interferons early in the course of infection. These findings raise the possibility that excessive virus‐induced interferon production during acute infections can contribute to airway inflammation and exacerbations of asthma.
Keywords: asthma, exacerbation, gene expression, index, interferon, virus
Introduction
Frequent exacerbations of asthma in adults can lead to an accelerated decline in lung function and contribute to morbidity 1, 2. Studies have shown 44–80% of asthma exacerbations are virus‐induced 3, 4. However, not all viral respiratory infections in asthmatics result in an exacerbation 5, 6, and the mechanism and risk factors for viral respiratory infections to transition into an asthma exacerbation are not well established.
Many inflammatory mediators are induced upon viral infection, including interferons (IFN), which are an important component of the host defence against viral infections and are instrumental in engaging the adaptive immune response 7. Interferons are classified into three categories, Types I, II and III. The expressions of Type I interferons (IFN‐α family and IFN‐β) and Type III interferons (IFN‐λ family) are directly triggered by virus‐induced signalling. In contrast, Type II interferon (IFN‐γ) is generally expressed by T cells, NK cells or monocytes in response to cytokines rather than viral particles 7, 8, 9, 10, 11. Type I and III interferons are expressed in several cell types, including but not limited to bronchial epithelial cells, macrophages, fibroblasts and plasmacytoid dendritic cells 12, 13, 14. The interferons initiate a robust antiviral response impairing virus replication and cell‐to‐cell spread of virus. Additionally, some but not all studies have suggested an association of asthma and interferon deficiency, which may predispose an individual to virus‐induced exacerbations of asthma 14, 15, 16, 17.
We previously reported that the quantitative level of viral particles in the upper airway did not correlate with the development of asthma exacerbations 18, rather it was the extent of neutrophilic inflammation induced by the viral infection that corresponded to the development and severity of asthma exacerbation. In addition, human rhinovirus (HRV) is the most prevalent viral respiratory infection responsible for increased asthma symptoms and exacerbations 4, 19, 20. Furthermore, HRV infections can extend into the lower airways 21, 22, 23, suggesting that virus‐induced cytokine responses in the lower airways may directly contribute to the development and severity of asthma exacerbations.
Induced sputum provides a sampling of the lower airway inflammatory milieu to dissect the link between exacerbation and viruses. Both the measurement of inflammatory mediators in the sputum 24, 25 and the gene expression of sputum cells have been used to characterize lower airway inflammation 26, 27, 28. To examine whether the presence or severity of asthma exacerbations correspond with lower airway inflammatory responses invoked by the viral infection, we examined sputum samples for expression of interferons (IFN‐α1, IFN‐β1, IFN‐λ1, IFN‐γ), IL‐13 and IL‐10 in asthma patients participating in a study of naturally occurring viral upper respiratory infections.
Methods
Patients
We have previously described subjects participating in the clinical study of viral exacerbations in asthma (VIAX, University of Wisconsin Institutional Review Board approved protocol H‐2005‐0070) 18. This protocol included clinical characterization and collection of induced sputum samples at the time of patient's initial cold and again following resolution of symptoms (typically 6 weeks later, which was considered to represent the ‘baseline’). See supporting information for details (Figure S1). Subjects were enrolled in the study within 48 h of the start of self‐reported cold symptoms. Participants with asthma were eligible if they were 18–60 years of age and met the following criteria: (1) a physician diagnosis of asthma for at least 6 months, (2) history of wheezing or asthma exacerbation initiated by a cold, (3) an FEV1 ≥ 70% of predicted at the time of the first visit, (4) absence of high‐dose inhaled or use of oral corticosteroids at enrolment and (5) a positive skin test to at least one of 12 aeroallergens. Exclusion criteria included current smoking or a history of ≥ 5 pack‐years, a pre‐enrolment requirement of ≥ 6 puffs/day of rescue albuterol, concomitant use of more than two asthma controller agents and current immunotherapy. Our analysis included the subset of study participants who completed the protocol, had a confirmed viral infection and provided a sputum sample with enough cells for mRNA isolation and was less than 80% epithelial cells at the baseline visit and during an acute visit with cold symptoms.
Virus detection
Virus detection, rhinovirus molecular typing and quantification of viral load were performed as previously described 18. Briefly, sputum samples and nasal lavage samples were extracted from aliquots of the cell pellet containing 500 000 cells stored in Trizol Reagent (Invitrogen, Carlsbad, CA, USA). Total RNA was reverse transcribed to cDNA, and the Respiratory Multicode Assay (Eragen Biosciences, Madison, WI, USA) was used for fluorimetric detection of common respiratory viruses with multiplex polymerase change reaction (PCR) and flow cytometry. Samples positive for rhinoviruses were partially sequenced to determine strain.
Sputum samples
Induced sputum was obtained as previously described 18, 29. Sputum samples were collected within 4 days of enrolment and again following resolution of symptoms, typically 6 weeks later. Briefly, patients inhaled nebulized saline for 5 min, rinsed out their mouth and then coughed with collection of the sputum. This was repeated a total of three times or until adequate sputum was obtained. The sputum was diluted 1 : 1 with PBS. Samples were centrifuged and cell pellets collected for examination for cell distributions by H&E staining on a slide and placed in Trizol solution for RNA purification. The sputum supernatant was mixed 1 : 1 with Sputolysin (EMD Millipore, Darmstadt, Germany). An adequate sputum sample was defined as having at least 500 000 WBC per sample and an acute and baseline visit epithelial cell contamination of less than 80%.
Measurement of gene expression
Sputum cell lysates were stored at − 80°C in Trizol, and RNA was isolated according to the manufacturer's instructions and then reversed transcribed using Superscript III (Life Technologies, Grand Island, NY, USA). Quantitative PCR was performed by combining cDNA with random primers, nucleotides and RNasin (Promega, Madison, WI, USA) as previously described 30. Primers and probes from Applied Biosytems (Grand Island, NY, USA) for IFN‐α1 (HS03044218 g1), IFN‐β1 (HS00277188 s1), IFN‐λ1 (HS00601677 g1), IFN‐γ (HS00989291 m1), IL‐10 (HS99999035 m1), IL‐13 (HS01124272 g1), MBP (HS00794928 m1), MMP‐9 (HS00957562 m1), neutrophil elastase (HS00236952 m1) and TGF‐β (HS009‐98133 m1) were combined with Taqman gene expression mastermix in duplicate singleplex real‐time PCR (StepOnePlus PCR system, Applied Biosystems). Results were calculated using the 2−ΔCt method relative to the endogenous control, human β‐glucuronidase (GUSB, 4333767F, Life Technologies).
Asthma Index
The Asthma Index was calculated daily as previously described 31 using the worksheet available in the article online repository. Briefly, reference evening peak expiratory flow rates (PEFR) and total asthma symptom score values were calculated as the mean of the data from the most stable week during the resolution visits. Asthma symptom scores captured rescue bronchodilator use, nocturnal awakening, chest tightness, wheeze, cough and dyspnoea. Rolling averages of the symptom scores and the total daily percent decline relative to the reference PEFR were compiled throughout the study enrolment capturing data from the previous 48 h. The Asthma Index was then calculated serially by subtracting the baseline score from each 48‐h average score. An Asthma Index score greater than or equal to 30 was previously shown to be consistent with consensus guideline definitions of a moderate exacerbation 31. The peak Asthma Index refers to the highest value obtained within 3 days of acute visit sputum collection.
Statistics
The associations between cytokine levels and peak Asthma Index were examined using linear models. Asthma Index was treated both as a continuous variable and as a categorical variable (AI < 30, non‐exacerbation vs. AI ≥ 30, exacerbation). Cytokine levels were log‐transformed, and Asthma Index was square‐root transformed to approximate normality for analysis. A P‐value less than 0.05 was regarded as statistically significant. Analyses were conducted using R version 2.15 (R Foundation for Statistical Computing, Vienna, Austria) or SigmaPlot version 11.0 (Sysstat Software, San Jose, CA, USA).
Results
Subject selection and characteristics
Figure 1 shows a diagram for selection of subjects from the VIAX protocol 18. Of the original 49 subjects with virus‐positive samples, 30 had adequate sputum samples for analysis. Of these 30 individuals, 17 developed an exacerbation based on an Asthma Index score of 30 or greater, within 3 days before or after sputum induction. The clinical characteristics of the final study population are shown in Table 1. Virus identification and sequencing of rhinovirus subgroups demonstrated no significant differences between subjects with or without an exacerbation. Subjects with an exacerbation had a significantly greater reduction in peak expiratory flow (− 76.0 vs. − 38.0, P = 0.03). Exacerbations were not associated with significant changes in FEV1. Cold symptom scores increased significantly between baseline and acute visits in the exacerbation group (0.0 vs. 14.0, P = 0.001) and in the cold group (0.0 vs. 9.5, P < 0.001). Exacerbations were associated with increases in the peak Asthma Index [median 40 (range 31.8–52.3) vs. 18.5 (range 11.0–22.5)], and these observations are comparable to the results from the complete VIAX cohort 18.
Figure 1.
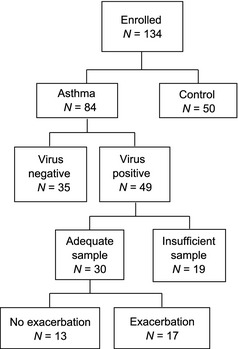
Participant diagram. Numbers of patients meeting the respective criteria for inclusion are shown.
Table 1.
Study subjects
| No exacerbation N = 13 (Asthma Index: 18.5; 11–22.5) | Exacerbation N = 17 (Asthma Index: 40; 31.8–52.3) | ALL N = 30 (Asthma Index: 30.5; 19.0–40.0) | |||||||
|---|---|---|---|---|---|---|---|---|---|
| Average Age | 28 | 29.7 | 28.9 | ||||||
| Sex (Female) | 8/13 (62%) | 13/17 (76%) | 21/30 (70%) | ||||||
| Viral Serology |
Rhinovirus: 9/13 Influenza A: 2/13 RSVB/ Coronavirus:1/13 Coronavirus: 1/13 |
Rhinovirus: 16/17 Influenza B: 1/17 |
Rhinovirus: 25 Influenza A: 2/30 Influenza B: 1/30 RSVB/ Coronavirus:1/30 Coronavirus: 1/30 |
||||||
| Acute | Baseline | Δ | Acute | Baseline | Δ | Acute | Baseline | Δ | |
| FEV1, L | 3.5 (2.8–3.9) | 3.4 (2.78–3.8) | 0.0 (− 0.1–0.08) | 3.3 (2.6–4.0) | 3.2 (2.5–3.9) | − 0.03 (−0.1–1.0) | 3.4 (2.6–3.9) | 3.3 (2.5–3.8) | −0.01 (−0.09–0.08) |
| FEV1, % predicted | 95.0 (82–101.8) | 92.0 (86.3–100.5) | − 0.6 (− 3.3–1.6) | 92.3 (88.5–103.5) | 93.0 (87.3–103.3) | − 0.4 (−3.7–1.9) | 92.5 (88–102.3) | 93.0 (88–102) | −0.6 (−3.3–1.8) |
| FEV1, L Post Albuterol | 3.7 (2.9–4.3) | 3.6 (2.8–4.3) | 0.01 (− 0.05–0.08) | 3.6 (2.7–4.1) | 3.4 (2.6–4.0) | 0.01 (−0.08–.1) | 3.7 (2.7–4.3) | 3.5 (2.7–4.2) | 0.01 (−0.08–0.09) |
| Modified Jackson Cold Scores | 9.5a (8.0–13.0) | 0.0 (0.0–3.0) | 9.5 (5–12) | 14.0a(10.5–14.3) | 0.0 (0–1.0) | 12.0 (8.8–14) | 11.5a (8–14) | 0.0 (0.0–2.0) | 10.5 (7–13) |
| Peak Flow | 441a (362.00–569) | 480 (409–588.5) | − 38b (− 64 to − 15.5) | 373a (288–430.5) | 468 (382.8–522.5) | − 76b (− 98.5 to −40.8) | 401a (316–506) | 471 (383–536) | −56.5 (−81 to –29) |
Data are shown as the median with interquartile range. Δ indicates the difference between acute and baseline visits.
Represents a difference with P < 0.005 between acute and baseline visits within the group.
On Δ represents the difference with P < 0.05 between no exacerbation and exacerbation.
This article is being made freely available through PubMed Central as part of the COVID-19 public health emergency response. It can be used for unrestricted research re-use and analysis in any form or by any means with acknowledgement of the original source, for the duration of the public health emergency.
Sputum samples
As shown in Table 2, there were no significant differences in baseline sputum eosinophils, neutrophils, lymphocytes or macrophage between those who experienced an exacerbation and those who did not. The most notable observation was that exacerbations were associated with significantly greater neutrophil influx, as previously reported 18. Sputum neutrophils were significantly greater in patients who had a virus‐induced exacerbation, as measured by a greater difference in the mean percent (20.4%, P = 0.02) and mean total number of cells (20.6 × 10⁵ cells / gram, P = 0.009).
Table 2.
Sputum cells during exacerbations
| No exacerbation (Asthma Index 0–29) | Exacerbation (Asthma Index ≥ 30) | Combined | ||||
|---|---|---|---|---|---|---|
| Acute | Baseline | Acute | Baseline | Acute | Baseline | |
| Eosinophil (Total) | 0.1 (0.0–0.2) | 0.0 (0.0–0.1) | 0.1a (0.0–0.4) | 0.0 (0.0–0.1) | 0.1 (0.0–0.3) | 0.0 (0.0–0.1) |
| Eosinophil, % | 0.5 (0.2–2.1) | 0.3 (0.0–1.3) | 0.5 (0.2–1.4) | 0.3 (0.0–0.5) | 0.5 (0.3–2.0) | 0.3 (0.0–0.8) |
| Neutrophil (Total) | 1.9 (0.8–4.6) | 2.2 (1.0–3.9) | 7.6a (3.2–25.6) | 1.6 (0.5–3.6) | 4.3 (1.2–8.7) | 2.0 (0.7–3.8) |
| Neutrophil, % | 32.0 (17.4–45.6) | 31.3 (17.0–43.0) | 49.8a (39.4–73.9) | 31.4 (18.9–50.2) | 43.1 (24–68.5) | 31.4 (17.0–46.7) |
| Lymphocyte (Total) | 0.1 (0.1–0.3) | 0.2 (0.0–0.4) | 0.4 (0.1–1.9) | 0.2 (0.1–0.3) | 0.3 (0.1–0.5) | 0.2 (0.1–0.3) |
| Lymphocytes, % | 2.5 (1.6–3.6) | 3.0 (0.9–5.5) | 2.9 (1.8–3.8) | 3.0 (1.8–4.7) | 2.7 (2.0–3.7) | 3.0 (1.5–5.0) |
| Macrophage (Total) | 4.3 (2.6–6.2) | 4.9 (2.3–7.6) | 4.3 (2.2–16.8) | 3.8 (2.5–6.1) | 4.3 (2.6–8.6) | 4.2 (2.5–6.5) |
| Macrophage, % | 65.0 (50.9–76.6) | 65.5 (51.9–80.0) | 43.5a (22.8–55.9) | 63.9 (44.2–73.0) | 53.1 (26.5–71.0) | 64.5 (46.2–74.8) |
Counts for the respective cell types are shown as total cells (number of cells ×105 per gram of sputum) or as percentage of white blood cells in sputum. Values are medians with interquartile range.
Represents a P < 0.05 in the difference between acute and baseline visits within the group.
This article is being made freely available through PubMed Central as part of the COVID-19 public health emergency response. It can be used for unrestricted research re-use and analysis in any form or by any means with acknowledgement of the original source, for the duration of the public health emergency.
Interferon and cytokine responses
As shown in Fig. 2, IFN‐γ mRNA expression in the lower airways was significantly greater (P = 0.002) during exacerbations. There was also a trend during exacerbations for greater expression of IFN‐β1 (P = 0.06) and IFN‐α1 (P = 0.06) mRNA. In addition, the peak Asthma Index correlated with expression of IFN‐γ, IFN‐α1 and IFN‐β1 mRNA in sputum cells during exacerbations (P = 0.004, P ≤ 0.001, and P = 0.001, respectively, Table 3). Exacerbations were also associated with greater expression of IL‐10, MBP and IL‐13 mRNA in sputum samples (P = 0.06, P = 0.02 and P = 0.03, respectively, Fig. 3). In addition, the peak Asthma Index correlated with sputum IL‐13 mRNA expression (P = 0.006), with similar trends for MBP and neutrophil elastase mRNA (P = 0.08 and P = 0.08, respectively, Table 3).
Figure 2.
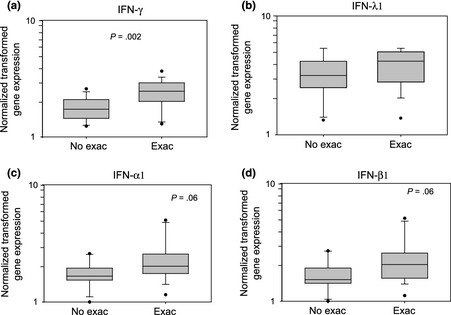
Sputum cell interferon mRNA expression with or without asthma exacerbation. Interferon gene expression was normalized, log‐transformed and presented as box plots for patients with no exacerbation (No Exac) and with exacerbation (Exac). (a) IFN‐γ, (b) IFN‐λ1, (c) IFN‐α1, (d) IFN‐β1. P‐values are indicated in each panel.
Table 3.
Relationship between gene expression and exacerbations
| Gene | Categorical | Quantitative (Peak Asthma Index) | |||
|---|---|---|---|---|---|
| No exacerbation (Index 0–29) | Exacerbation (Index ≥ 30) | P‐value | Correlation | P‐value | |
| IFN‐γ | 1.73 (1.45–2.09) | 2.47 (2.02–2.88) | 0.002 | 0.51 | 0.004 |
| IFN‐λ1 (IL‐29) | 3.16 (2.53–3.93) | 4.16 (2.92–4.92) | 0.36 | 0.30 | 0.11 |
| IFN‐α1 | 1.66 (1.57–1.91) | 2.02 (1.75–2.56) | 0.06 | 0.58 | <0.001 |
| IFN‐β1 | 1.52 (1.43–1.83) | 2.05 (1.60–2.56) | 0.06 | 0.57 | 0.001 |
| IL‐10 | 1.83 (1.27–2.47) | 2.30 (1.93–2.61) | 0.06 | 0.28 | 0.13 |
| MBP | 1.67 (1.43–1.82) | 2.26 (1.77–2.67) | 0.02 | 0.32 | 0.08 |
| IL‐13 | 1.66 (1.18–2.45) | 2.36 (1.85–2.86) | 0.03 | 0.49 | 0.006 |
| Neutrophil Elastase | 2.37 (1.81–2.75) | 2.75 (2.09–3.29) | 0.11 | 0.32 | 0.08 |
The quantification of gene expression was compared categorically between the subjects with no exacerbation vs. those with exacerbation, based on the Asthma Index. The mRNA quantification (normalized and log‐transformed) and P‐value for the comparison are shown. Data are shown as medians with interquartile range. The quantification of gene expression (normalized and log‐transformed) was also analysed by linear regression with the Peak Asthma Index as a continuous variable. The correlation coefficient and P‐value are shown.
This article is being made freely available through PubMed Central as part of the COVID-19 public health emergency response. It can be used for unrestricted research re-use and analysis in any form or by any means with acknowledgement of the original source, for the duration of the public health emergency.
Figure 3.
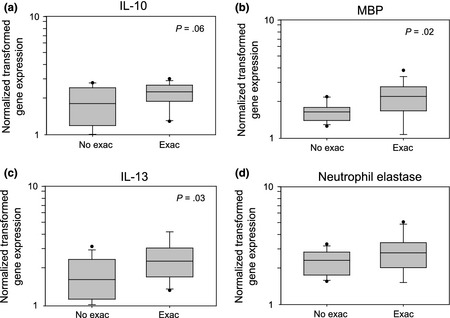
Sputum cell cytokine and granule product mRNA expression with or without asthma exacerbation. Gene expression was normalized, log‐transformed and presented as box plots for patients with no exacerbation (No Exac) and with exacerbation (Exac). (a) IL‐10, (b) major basic protein (MBP), (c) IL‐13, (d) neutrophil elastase. P‐values are indicated in each panel.
Discussion
The objective of this study was to identify clinical and inflammatory features of airway inflammation, as measured in sputum, that differentiate virus‐induced exacerbations from uncomplicated viral colds. As expected, exacerbations were associated with greater gene expression of inflammatory genes and mediators, such as IL‐13, IL‐10 and eosinophil major basic protein. Also, the percentage of rhinovirus isolated in subjects as well as subgroup classifications are consistent with previous observations in the literature 18, 32. Additionally, our findings indicate that exacerbations were associated with greater expression of IFN‐γ mRNA in sputum cells. Furthermore, quantification of IFN‐α1, IFN‐β1 and IFN‐γ sputum gene expression significantly correlated with a quantitative measure of symptom severity, the Asthma Index.
Several studies have reported interferon responses during a viral infection differ in asthma patients compared to healthy controls; however, the findings are controversial. Whether the difference between asthma patients and healthy controls is due to deficient interferon responses to virus or an exaggerated response is not clear. For example, analyses of in vitro cell cultures (primary bronchial epithelial cells, monocytes and alveolar macrophages derived from asthma patients) infected with HRV have shown diminished IFN‐λ, α, γ and β responses compared to cells derived from control non‐asthma patients 15, 17, 33, 34, 35. Furthermore, those patients with lower IFN‐λ release from in vitro‐infected BAL cells exhibited a greater drop in FEV1 following experimental HRV inoculation 17. For asthma patients not currently experiencing an exacerbation or viral infection, sputum gene expression of IFN‐λ1 (IL‐29) inversely correlated with their asthma symptom scores 28. These deficiencies in interferon production are thought to increase susceptibility in asthmatics to development of viral infections in the lower airway 16, 36.
In contrast, other studies demonstrate that asthma is associated with intact interferon responses that are positively associated with lower airway symptoms. IFN‐γ protein levels in nasal lavage samples from atopic asthma patients and healthy controls exhibited comparable increases during experimental HRV‐16 inoculation 5. Interestingly, one study reported that asthma symptoms were related to both lower expression of IFN‐λ1 mRNA and increased expression of IFN‐λ2 (IL‐28) in sputum cells 28. In addition, IFN‐λ protein and mRNA expression in upper airway respiratory secretions were increased in wheezing adolescents during a viral infection compared to non‐wheezers and correlated with the severity of wheezing illness 37. Our data are consistent with the latter findings, as we have shown increased lower airway expression of IFN‐β and IFN‐γ in those experiencing an exacerbation. Furthermore, IFN‐γ, IFN‐β1 and IFN‐α1 show significant correlations with quantification of asthma symptom severity as measured by the peak Asthma Index. These data suggest the possibility that a vigorous interferon response during a viral respiratory infection could contribute to the development and severity of an asthma exacerbation. Conceptually, the interferon expression may serve two roles: first, at onset of viral exposure, interferons may protect from severe infection; second, once infection has occurred, interferons may contribute to promoting the inflammatory cascade in the airway contributing to increased asthma symptoms.
Our study has several novel features. We focused on gene expression as the biomarker(s) for the inflammatory milieu in the lower airways. We examined asthma patients with naturally occurring viral infections. Finally, we utilized a quantitative measure of asthma symptom severity, the Asthma Index, which incorporates both subjective and objective measures of control. It is notable that our gene expression data for IL‐10, MBP and IL‐13 are consistent with published observations on the protein expression of these and related products in the airway 24, 26, 27, 38, 39, which provides validation for the use of sputum cell gene expression as a surrogate biomarker for the respective cytokine or mediator.
One of the limitations of our study is the inability to identify the cell type responsible for the change in gene expression. Therefore, the changes in mRNA expression may be the result of either increased transcription per cell or fluctuations in cellular composition. Also, our analysis focused on gene expression, and confirmatory studies of protein secretion are needed. On the other hand, use of RT‐PCR is a very sensitive method of quantifying gene expression, and it is possible that many proteins that cannot be detected in sputum (either due to low levels of protein expression or lack of sensitive/specific reagents) can readily be assessed by mRNA levels. Additionally, as sputum cell samples mainly consist of leucocytes, our data may not reflect changes in epithelial cell gene expression.
This study was conducted on a group of mild asthmatics who experienced exacerbations that did not require oral prednisone or a visit to the emergency department. Given this limitation, it is notable we were able to detect significant associations between interferon expression and exacerbation severity. We speculate that these findings can be extrapolated to more severe exacerbations, but this remains to be tested. It is also unknown whether the change in interferon responses of asthmatic patients is different from a control ‘non‐asthmatic’ population.
In summary, viral infections induce expression of interferons, which have well‐recognized antiviral properties. Our data suggest that during the early and acute phases of a virus‐induced exacerbations of asthma, interferon responses are increased relative to uncomplicated colds. The causality of this association remains to be determined, but suggest that either more severe illnesses induce greater interferon responses or alternately exuberant virus‐induced interferon responses contribute to airway inflammation and exacerbations of asthma.
Conflict of interest
EAS, DMM and MDE have no conflict of interests. LCD, JEG, NNJ and SKM are PI or Co‐PI on NIH grants. LCD is a consultant for Novartis. JEG is a consultant for GlaxoSmithKline, Biota, Centocor, Boehringer Ingelheim, MedImmune, Theraclone, Merck and Gilead. NNJ is a consultant for Boston Scientific and Genentech. SKM is a consultant for TEVA.
Supporting information
Data S1. The study protocol (as depicted in Figure S1) involved recruitment within 48 hours of cold symptoms. In less than 4 days, a study visit designated the ‘acute visit’ occurred, and a sputum induction was performed.
Figure S1. Study Visit Structure. Timeline including study visits and sample collections is shown.
Acknowledgements
The authors thank the participants of the study for their dedication to asthma research. Also, we thank the nurses, research coordinators, research laboratory staff and administrative staff of the University of Wisconsin Allergy and Asthma Research Program, including Gina Crisafi, Cheri Swenson, Evelyn Falibene, Erin Billmeyer, Michelle Wolff, Holly Eversoll and Katie Popp. This work was supported by National Institutes of Health Grants: HL088594, HL69116.
LCD, NNJ and SKM conceived of the study. DMM, LCD, JEG, NNJ and SKM designed the experiments. EAS performed the experiments. EAS, MDE, LCD and SKM analysed the data. EAS and SKM wrote the manuscript. EAS, DMM, MDE, LCD, JEG, NNJ and SKM edited the manuscript.
Schwantes E. A., Manthei D. M., Denlinger L. C., Evans M. D., Gern J. E., Jarjour N. N. and Mathur S. K., Clinical & Experimental Allergy, 2014. (44) 813–821.
References
- 1. O'Byrne PM, Pedersen S, Lamm CJ, Tan WC, Busse WW. Severe exacerbations and decline in lung function in asthma. Am J Respir Crit Care Med 2009; 179:19–24. [DOI] [PubMed] [Google Scholar]
- 2. Jackson DJ, Johnston SL. The role of viruses in acute exacerbations of asthma. J Allergy Clin Immunol 2010; 125:1178–87; quiz 1188–89. [DOI] [PMC free article] [PubMed] [Google Scholar]
- 3. Nicholson KG, Kent J, Ireland DC. Respiratory viruses and exacerbations of asthma in adults. BMJ 1993; 307:982–6. [DOI] [PMC free article] [PubMed] [Google Scholar]
- 4. Gern JE. The ABCs of rhinoviruses, wheezing, and asthma. J Virol 2010; 84:7418–26. [DOI] [PMC free article] [PubMed] [Google Scholar]
- 5. DeMore JP, Weisshaar EH, Vrtis RF et al Similar colds in subjects with allergic asthma and nonatopic subjects after inoculation with rhinovirus‐16. J Allergy Clin Immunol 2009; 124:245–52, 252.e1–3. [DOI] [PMC free article] [PubMed] [Google Scholar]
- 6. Fleming HE, Little FF, Schnurr D et al Rhinovirus‐16 colds in healthy and in asthmatic subjects: similar changes in upper and lower airways. Am J Respir Crit Care Med 1999; 160:100–8. [DOI] [PubMed] [Google Scholar]
- 7. Fensterl V, Sen GC. Interferons and viral infections. BioFactors 2009; 35:14–20. [DOI] [PubMed] [Google Scholar]
- 8. Sumino K, Tucker J, Shahab M et al Antiviral IFN‐γ responses of monocytes at birth predict respiratory tract illness in the first year of life. J Allergy Clin Immunol 2012; 129:1267–73.e1. [DOI] [PMC free article] [PubMed] [Google Scholar]
- 9. Kenyon NJ, Kelly EA, Jarjour NN. Enhanced cytokine generation by peripheral blood mononuclear cells in allergic and asthma subjects. Ann Allergy Asthma Immunol 2000; 85:115–20. [DOI] [PubMed] [Google Scholar]
- 10. Handzel ZT, Busse WW, Sedgwick JB et al Eosinophils bind rhinovirus and activate virus‐specific T cells. J Immunol 1998; 160:1279–84. [PubMed] [Google Scholar]
- 11. Gern JE, Vrtis R, Kelly EA, Dick EC, Busse WW. Rhinovirus produces nonspecific activation of lymphocytes through a monocyte‐dependent mechanism. J Immunol 1996; 157:1605–12. [PubMed] [Google Scholar]
- 12. Korpi‐Steiner NL, Bates ME, Lee W‐M, Hall DJ, Bertics PJ. Human rhinovirus induces robust IP‐10 release by monocytic cells, which is independent of viral replication but linked to type I interferon receptor ligation and STAT1 activation. J Leukoc Biol 2006; 80:1364–74. [DOI] [PubMed] [Google Scholar]
- 13. Megjugorac NJ, Gallagher GE, Gallagher G. Modulation of human plasmacytoid DC function by IFN‐λ1 (IL‐29). J Leukoc Biol 2009; 86:1359–63. [DOI] [PubMed] [Google Scholar]
- 14. Gavala ML, Bashir H, Gern JE. Virus/Allergen interactions in asthma. Curr Allergy Asthma Rep 2013; 13:298–307. [DOI] [PMC free article] [PubMed] [Google Scholar]
- 15. Wark PAB, Johnston SL, Bucchieri F et al Asthmatic bronchial epithelial cells have a deficient innate immune response to infection with rhinovirus. J Exp Med 2005; 201:937–47. [DOI] [PMC free article] [PubMed] [Google Scholar]
- 16. Johnston SL. Innate immunity in the pathogenesis of virus‐induced asthma exacerbations. Proc Am Thorac Soc 2007; 4:267–70. [DOI] [PubMed] [Google Scholar]
- 17. Contoli M, Message SD, Laza‐Stanca V et al Role of deficient type III interferon‐lambda production in asthma exacerbations. Nat Med 2006; 12:1023–6. [DOI] [PubMed] [Google Scholar]
- 18. Denlinger LC, Sorkness RL, Lee W‐M et al Lower airway rhinovirus burden and the seasonal risk of asthma exacerbation. Am J Respir Crit Care Med 2011; 184:1007–14. [DOI] [PMC free article] [PubMed] [Google Scholar]
- 19. Jackson DJ, Evans MD, Gangnon RE et al Evidence for a causal relationship between allergic sensitization and rhinovirus wheezing in early life. Am J Respir Crit Care Med 2012; 185:281–5. [DOI] [PMC free article] [PubMed] [Google Scholar]
- 20. Guilbert TW, Singh AM, Danov Z et al Decreased lung function after preschool wheezing rhinovirus illnesses in children at risk to develop asthma. J Allergy Clin Immunol 2011; 128:532–8.e1–10. [DOI] [PMC free article] [PubMed] [Google Scholar]
- 21. Mosser AG, Vrtis R, Burchell L et al Quantitative and qualitative analysis of rhinovirus infection in bronchial tissues. Am J Respir Crit Care Med 2005; 171:645–51. [DOI] [PubMed] [Google Scholar]
- 22. Wos M, Sanak M, Soja J, Olechnowicz H, Busse WW, Szczeklik A. The presence of rhinovirus in lower airways of patients with bronchial asthma. Am J Respir Crit Care Med 2008; 177:1082–9. [DOI] [PMC free article] [PubMed] [Google Scholar]
- 23. Gern JE, Galagan DM, Jarjour NN, Dick EC, Busse WW. Detection of rhinovirus RNA in lower airway cells during experimentally induced infection. Am J Respir Crit Care Med 1997; 155:1159–61. [DOI] [PubMed] [Google Scholar]
- 24. Pizzichini MM, Pizzichini E, Efthimiadis A et al Asthma and natural colds. Inflammatory indices in induced sputum: a feasibility study. Am J Respir Crit Care Med 1998; 158:1178–84. [DOI] [PubMed] [Google Scholar]
- 25. Hastie AT, Moore WC, Meyers DA et al Analyses of asthma severity phenotypes and inflammatory proteins in subjects stratified by sputum granulocytes. J Allergy Clin Immunol 2010; 125:1028–36.e13. [DOI] [PMC free article] [PubMed] [Google Scholar]
- 26. Wood LG, Simpson JL, Wark PAB, Powell H, Gibson PG. Characterization of innate immune signalling receptors in virus‐induced acute asthma. Clin Exp Allergy 2011; 41:640–8. [DOI] [PubMed] [Google Scholar]
- 27. Grissell TV, Powell H, Shafren DR et al Interleukin‐10 gene expression in acute virus‐induced asthma. Am J Respir Crit Care Med 2005; 172:433–9. [DOI] [PubMed] [Google Scholar]
- 28. Bullens DMA, Decraene A, Dilissen E et al Type III IFN‐lambda mRNA expression in sputum of adult and school‐aged asthmatics. Clin Exp Allergy 2008; 38:1459–67. [DOI] [PubMed] [Google Scholar]
- 29. Gern JE, Vrtis R, Grindle KA, Swenson C, Busse WW. Relationship of upper and lower airway cytokines to outcome of experimental rhinovirus infection. Am J Respir Crit Care Med 2000; 162:2226–31. [DOI] [PubMed] [Google Scholar]
- 30. Schroth MK, Grimm E, Frindt P et al Rhinovirus replication causes RANTES production in primary bronchial epithelial cells. Am J Respir Cell Mol Biol 1999; 20:1220–8. [DOI] [PubMed] [Google Scholar]
- 31. Sorkness RL, Gonzalez‐Fernandez G, Billmeyer EE, Evans MD, Gern JE, Jarjour NN. The asthma index: a continuous variable to characterize exacerbations of asthma. J Allergy Clin Immunol 2008; 122:838–40. [DOI] [PubMed] [Google Scholar]
- 32. Lee W‐M, Lemanske RF Jr, Evans MD et al Human rhinovirus species and season of infection determine illness severity. Am J Respir Crit Care Med 2012; 186:886–91. [DOI] [PMC free article] [PubMed] [Google Scholar]
- 33. Sykes A, Edwards MR, Macintyre J et al Rhinovirus 16‐induced IFN‐α and IFN‐β are deficient in bronchoalveolar lavage cells in asthmatic patients. J Allergy Clin Immunol 2012; 129:e6. [DOI] [PubMed] [Google Scholar]
- 34. Brooks GD, Buchta KA, Swenson CA, Gern JE, Busse WW. Rhinovirus‐induced interferon‐gamma and airway responsiveness in asthma. Am J Respir Crit Care Med 2003; 168:1091–4. [DOI] [PubMed] [Google Scholar]
- 35. Gehlhar K, Bilitewski C, Reinitz‐Rademacher K, Rohde G, Bufe A. Impaired virus‐induced interferon‐alpha2 release in adult asthmatic patients. Clin Exp Allergy 2006; 36:331–7. [DOI] [PubMed] [Google Scholar]
- 36. Busse WW, Lemanske RF, Gern JE. The role of viral respiratory infections in asthma and asthma exacerbations. Lancet 2010; 376:826–34. [DOI] [PMC free article] [PubMed] [Google Scholar]
- 37. Miller EK, Hernandez JZ, Wimmenauer V et al A mechanistic role for type III IFN‐λ1 in asthma exacerbations mediated by human rhinoviruses. Am J Respir Crit Care Med 2012; 185:508–16. [DOI] [PMC free article] [PubMed] [Google Scholar]
- 38. Message SD, Laza‐Stanca V, Mallia P et al Rhinovirus‐induced lower respiratory illness is increased in asthma and related to virus load and Th1/2 cytokine and IL‐10 production. Proc Natl Acad Sci USA 2008; 105:13562–7. [DOI] [PMC free article] [PubMed] [Google Scholar]
- 39. Bodey KJ, Semper AE, Redington AE et al Cytokine profiles of BAL T cells and T‐cell clones obtained from human asthmatic airways after local allergen challenge. Allergy 1999; 54:1083–93. [DOI] [PubMed] [Google Scholar]
Associated Data
This section collects any data citations, data availability statements, or supplementary materials included in this article.
Supplementary Materials
Data S1. The study protocol (as depicted in Figure S1) involved recruitment within 48 hours of cold symptoms. In less than 4 days, a study visit designated the ‘acute visit’ occurred, and a sputum induction was performed.
Figure S1. Study Visit Structure. Timeline including study visits and sample collections is shown.