Abstract
Cardiac and skeletal muscle myosins have the central role in contraction transducing ATP free energy into the mechanical work of moving actin. Myosin has a motor domain containing ATP and actin binding sites and a lever-arm that undergoes rotation impelling bound actin. The lever-arm converts torque generated in the motor into the linear displacement known as step-size. The myosin lever-arm is stabilized by bound essential and regulatory light chains (ELC and RLC). RLC phosphorylation at S15 is linked to modified lever-arm mechanical characteristics contributing to myosin filament based contraction regulation and to the response of the muscle to disease. Myosin step-size was measured using a novel quantum dot (Qdot) assay that previously confirmed a 5 nm step-size for fast skeletal myosin and multiple unitary steps, most frequently 5 and 8 nm, and a rare 3 nm displacement for β cardiac myosin (βMys). S15 phosphorylation in βMys is now shown to change step-size distribution by advancing the 8 nm step frequency. After phosphorylation, the 8 nm step is the dominant myosin step-size resulting in significant gain in the average step-size. An increase in myosin step-size will increase the amount of work produced per ATPase cycle. The results indicate that RLC phosphorylation modulates work production per ATPase cycle suggesting the mechanism for contraction regulation by the myosin filament.
Keywords: ventricular myosin step-size, Qdot assay, cardiac myosin RLC phosphorylation, actin-activated ATPase, in vitro motility
INTRODUCTION
Cardiac and skeletal muscle myosins are cellular movers comprised of a motor domain containing ATP and actin binding sites, a lever-arm that undergoes rotation impelling bound actin, and a tail forming the thick filament with other myosins. Muscle myosins have the central role in contraction by transducing ATP free energy into mechanical work. The lever-arm converts torque generated in the motor into linear displacement (step-size) and undergoes shear strain due to the resisting load. Bound myosin light chains, essential (ELC) and regulatory (RLC), stabilize the lever-arm (2-4). RLC post translational modification is a recognized pathway for the thick filament regulation in cardiac and skeletal muscle (5, 6). Computational modeling indicated a role for RLC phosphorylation in cardiac contraction regulation (7). Inheritable cardiomyopathies (ICs) are more frequently linked to myosin mutations than other sarcomeric proteins. IC mutations are located throughout the myosin molecule impacting many protein functional characteristics. Hereditary skeletal myopathies linked to myosin are less common. They lead to muscle weakness (8) or affect myosin isoforms expressed during development leading to arthrogryposis syndromes (9). Some disease linked mutations and other normal post translational modifications affect the myosin mover specifically in its mechanical responsiveness to motor impulsive force (10). Our long term goal is to discover how the myosin mover adapts its mechanical characteristics in response to changing demands on muscle power output or to the effects of disease. We are concerned here specifically with quantitation of myosin step-size and its adaptation by post translational modification of the RLC.
The in vitro motility assay measures actin gliding velocity over myosin immobilized on a surface. Myosin translates actin only while the two molecules are strongly bound. The myosin duty cycle is the ratio of time spent strongly actin bound divided by the time to complete the ATPase cycle. Muscle myosin has low duty cycle to enable rapid actin translation in a muscle fiber containing densely packed arrays of myosin motors (11). Low duty cycle skeletal and cardiac myosins elude conventional single molecule assays because actomyosin dissociates quickly and the freely moving element diffuses away prohibiting further interaction. We introduced super-resolution particle tracking of Qdot-actin in the standard in vitro motility assay (Qdot assay). The in vitro motility assay has modestly more actomyosin interactions than a single molecule encounter while actin diffusion is inhibited by methylcellulose in the motility buffer. The net effect sustains the actomyosin complex while preserving a subset of encounters that do not overlap in time on a single actin filament. A single myosin step is isolated in time and space then characterized using super-resolution.
The Qdot assay performed on rabbit skeletal HMM (sHMM) indicated a ~5 nm step-size as expected for this isoform (12). Porcine βcardiac myosin (βMys) indicated multiple unitary steps-sizes of ~3, ~5, and ~8 nm with relative normalized frequencies of 12.5%, 50%, and 37.5% (13). We proposed that the major 5 nm step is the default step identical to the unitary step in sHMM. The 8 nm step is somewhat less likely and we proposed different from the 5 nm step by involving an extra interaction with actin via the unique N-terminus of the cardiac ELC (cELC) (14, 15). The minor 3 nm step is the unlikely conversion of the 5 nm step to the full cELC bound 8 nm step. It occurs in just 1 of 8 cycles and is isolated in time from the 5 nm step by slow ADP dissociation hence we observe it as a separate step (16).
RLC mutants implicated in disease lower velocity, force, and shear strain (10, 17) suggesting they alter lever-arm processing of shear stress. Changes to RLC phosphorylation levels in the cardiac muscle affect power output in model organisms (5). We investigated if RLC phosphorylation affects the unitary step-size frequency using the Qdot assay. βMys was specifically phosphorylated at S15 in RLC using a smooth muscle myosin light chain kinase (smMLCK) (1). Phosphorylated βMys (pβMys) has 81-89% of the myosin phosphorylated. We found that phosphorylation causes a dramatic re-distribution of step-size frequencies when compared to unphosphorylated βMys providing a significant gain in average step-size for pβMys.
MATERIALS AND METHODS
Chemicals
Quantum dot 585 streptavidin conjugate (Qdot), rhodamine-phalloidin, biotin-XX-phalloidin, phalloidin, and 10% Tris-Glycine Mini Gels were obtained from Life Technologies (Grand Island, NY). Glucose oxidase was purchased from MP Biomedicals (Santa Ana, CA). Biotin free bovine serum albumin (BSA, cat # A3059) and catalase were from Sigma-Aldrich (St. Louis, MO). Other chemicals were purchased from Sigma-Aldrich or Affymetrix (Cleveland, OH). Protein concentrations were measured using the Bradford assay (Bio-Rad, Hercules, CA).
Protein preparations
βMys was prepared from porcine heart ventriculum as described (13, 18). G-actin was obtained from rabbit skeletal muscle acetone powder by using the method described by Pardee and Spudich (19) then stored immediately under argon gas in liquid nitrogen. Before actin was used, the frozen G-actin was thawed and spun at 160,000×g for 90 min to remove denatured actin. Biotin-XX-phalloidin plus rhodamine-phalloidin labeling of actin filaments was performed as described (13).
Phosphorylated cardiac myosin was prepared using recombinant smooth muscle myosin light chain kinase (smMLCK) as described previously with some modifications (1). 2 μM βMys was phosphorylated with 1.2 μM smMLCK in buffer containing 30 mM KCl, 25 mM Tris-HCl pH7.4, 12 mM MgCl2, 10 mM DTT, 0.1mM PMSF, 10 μg/ml leupeptin, 5 mM ATP, 0.2 mM CaCl2 and 12 μM calmodulin. After 24 hours incubation on ice, 3 mM EGTA was added to stop the reaction. ATP, smMLCK, and calmodulin were removed from the phosphorylated myosin using 2 precipitations at low ionic strength with ice cold 5 mM phosphate buffer pH 6.5. Between precipitations the phosphorylated myosin was resuspended in 0.6 M KCl and 5 mM EDTA to remove ATP. This method removed ~99% of the smMLCK and calmodulin from the phosphorylated myosin verified by SDS-PAGE.
The purified phosphorylated myosin was resuspended in 0.6 M KCl, 50 mM Tris-HCl pH 7.4, 4 mM MgCl2, 2 mM DTT and 10 μg/ml leupeptin, mixed with 50% glycerol and stored at −20°C until used. The level of RLC-phosphorylation was checked by urea gel electrophoresis stained with SYPRO Ruby and the fluorescence was quantitated with ImageJ (NIH, USA). RLC-phosphorylation level was initially 89% and decayed to 81% in ~12 hr. Results were pooled from motility experiments conducted during the 12 hr interval. Unphosphorylated myosin was treated with the same steps for generating phosphorylated myosin except without the addition of smMLCK and calmodulin.
Actin-activated myosin ATPase
Actin-activated myosin ATPase was measured as described (4) with some modifications. Myosin stored in 50% glycerol was precipitated with addition of 12× volumes of ice cold water containing 2 mM DTT, collected by centrifugation, then resuspended in 300 mM KCl, 25 mM imidazole pH 7.4, 4 mM MgCl2, 1 mM EGTA, 10 mM DTT, and 10 μg/mL leupeptin.
Actin activated ATPase measurements were done in an assay buffer containing 25 mM imidazole pH 7.4, 4 mM MgCl2, 1 mM EGTA, 10 mM DTT, 10 μg/mL leupeptin at a final concentration of 25 mM KCl. Myosin concentration was 2 μM. Actin concentrations were tested between 0.1-30 μM. ATPase activity was initiated by the addition of 3 mM ATP. Inorganic phosphate production was measured using the Fiske and SubbaRow method (20). Assays were done at 21 °C.
In vitro motility
The βMys was prepared for in vitro motility as described (13). In vitro motility of Qdot+rhodamine-phalloidin labeled actin was observed with through-the-objective total internal reflection fluorescence (TIRF) (21) on an Olympus IX71 inverted microscope using a 150×, 1.45 NA objective. Images were acquired with an Andor EMCCD camera (iXon3 897 with 16 × 16 μm pixels and 16 bit dynamic range) at 5 frames per second and 30 ms exposures using the software supplied by the manufacturer (SOLIS). The frame rate corresponds to 200 ms frame capture intervals indicated by Δt. Intensity values were converted to photons using the conversion formula in SOLIS as appropriate for our camera and the images output in TIFF format for reading into ImageJ. Assays were done at 21 °C.
Super-resolution measurements
The QuickPALM software (22) identified and localized point objects that qualified for super-resolution fitting according to user specifications including minimum SNR (> 25 isolating Qdots) and maximum full width at half maximum (FWHM) of 5 pixels (107 nm/pixel in object space for the 150× objective). QuickPALM analysis produced a table (SRTable) listing each qualifying particle, particle position in pixels, position standard deviation, and frame identifier. Using the SRTable, QuickPALM rendered the super-resolved particle data as single pixels per particle in the frame sequence of the original data. Rendered frames were read into ImageJ and analyzed with MTrackJ (23). Single pixel resolution (107 nm) of the rendered images is much less than super-resolution (<10 nm). Manual tracking was needed only to link the super-resolved particle positions into a track connecting time-ordered frames. A separate program, SRTrack written in Mathematica, linked the actual super-resolved particle coordinate to the track then updated the SRTable with the frame-to-frame tracking linked list. SRTrack eliminated any incorrectly identified MTrackJ particles that did not have a super-resolved equivalent. The latter removed the effect of Qdot blinking. Representative Qdot displacement vs time data is included in Supplementary Information Figure S1.
In any motility assay a few Qdots did not visibly move due to apparent immobilization on the glass surface. These particles were tracked at super-resolution to quantitate thermal/mechanical fluctuations.
Simulation
We simulated motility assay velocity event density as described previously for an actin filament 1.2 μm long (13). Simulation generates unitary myosin binding events during successive Δt’s that are converted to actin displacement by the myosin step-size then to actin velocity by dividing by Δt. Simulated and measured velocity event density histograms are compared for fit to choose best fitting parameters. Unitary step events are counted and converted to relative step frequency by dividing the unitary step count by the total number of unitary steps. The best fitting velocity event density histogram and the corresponding unitary step frequencies characterize the actomyosin interaction.
Myosin phosphorylation and actin activated ATPase
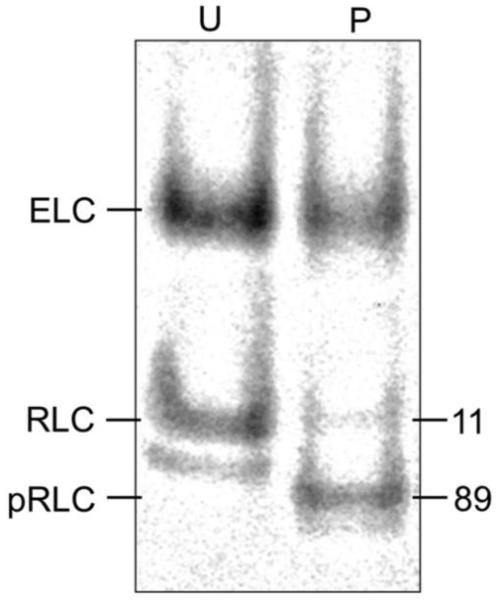
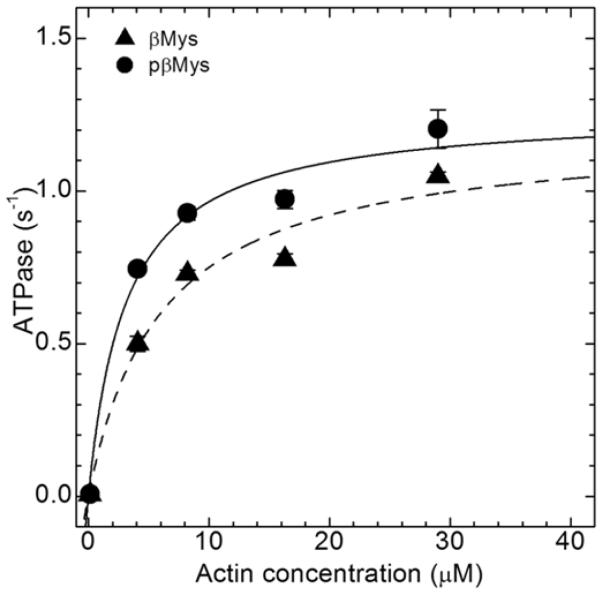
RLC S15 was specifically phosphorylated and the phosphorylation level measured as described previously (1). Figure 1 indicates that the fully phosphorylated myosin (pβMys) was 81-89% modified. A 40% phosphorylated sample used in the Qdot assay described below was a mixture of pβMys and βMys. Figure 2 shows actin-activated ATPase for βMys and pβMys with the tabulated Michaelis-Menten constants Km and Vmax. The weak actin binding constant and maximum ATPase do not significantly differ between βMys and pβMys.
Figure 1.
Urea PAGE of unphosphorylated (U) and phosphorylated (P) βMys. Protein bands were stained with SYPRO Ruby and the fluorescence quantitated with ImageJ. The faint band below the main RLC band is an unphosphorylated RLC with altered charge due to methylation or other post translational modification (1). Numbers indicate % of total RLC content.
Figure 2.
Actin-activated ATPase of unphosphorylated (triangle) and phosphorylated (circle) βMys. Michaelis-Menten fitting constants Vmax = 1.20 ± 0.13 and 1.26 ± 0.09 s−1, Km = 6 ± 2 and 3 ± 1 μM for unphosphorylated and phosphorylated samples are derived using ATPase=Vmax•[Actin]/(Km+[Actin]). Error bars show standard deviation.
Alternatively, analysis of variance using phosphorylation status (0 or 0.89 for unphosphorylated or phosphorylated) and actin concentration as factors finds the effect of phosphorylation on ATPase is strongly implied (p-test<0.01, phosphorylation affects actin-activated ATPase). The significance test does not specify whether Vmax, Km, or both are affected.
In vitro motility
Actin motility assays used a Qdot+rhodamine-phalloidin labeled actin. Single Qdots were tracked but both chromophores were visualized to inspect actin filament length and integrity prior to motility measurements. We used MTrackJ to do the manual tracking and average velocity calculation (23).
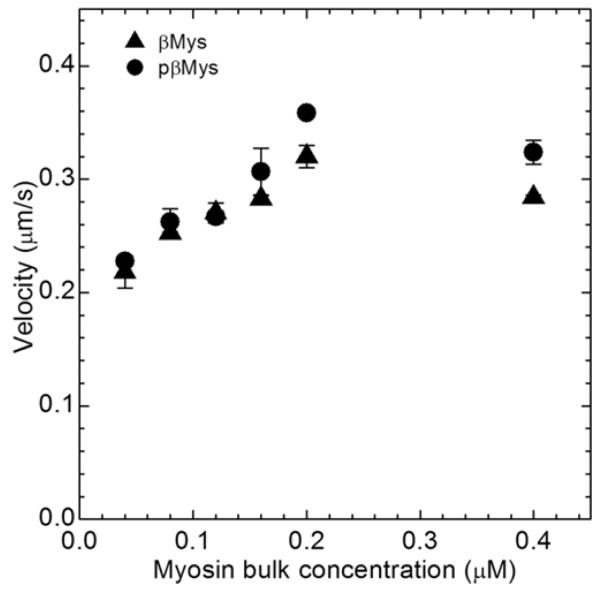
Figure 3 shows the average motility velocities vs bulk βMys or pβMys concentrations. Each filament was tracked for >10 μm. The sliding velocity of actin filaments at each myosin concentration was measured by averaging the speeds of 40-50 filaments from 2 slides. Error bars show standard deviation. Average motility velocity increases with increasing bulk myosin concentrations (and presumably with increasing myosin surface density) as expected for a low duty cycle motor. Motility saturates for both βMys and pβMys preparations at ~0.16 μM myosin as reported previously (13). We also showed previously that Qdot+rhodamine-phalloidin labeled actin filaments move as quickly as the standard rhodamine-phalloidin labeled filaments for myosin bulk concentrations ≥ 0.08 μM (13).
Figure 3.
Ensemble average in vitro motility velocity vs bulk myosin concentration of unphosphorylated (triangle) and phosphorylated (circle) βMys for Qdot+rhodamine-phalloidin labeled actin. Error bars show standard deviation.
Analysis of variance using phosphorylation status and myosin bulk concentration finds the effect of phosphorylation on motility velocity is not implied by data in Figure 3 (no presumption against the null hypothesis).
Super-resolution particle tracking
We processed photon counting images for super-resolution using the QuickPALM ImageJ plugin algorithm in 2 dimensions (22). QuickPALM renders the super-resolved single Qdot data as single pixels in the frame sequence of the original data that we track manually using MTrackJ. Output from MTrackJ is used to link the super-resolved Qdot path over the In every motility assay a few Qdots did not visibly move due to apparent immobilization on the glass surface. They were used to quantify baseline velocity distributions from thermal/mechanical fluctuation events.
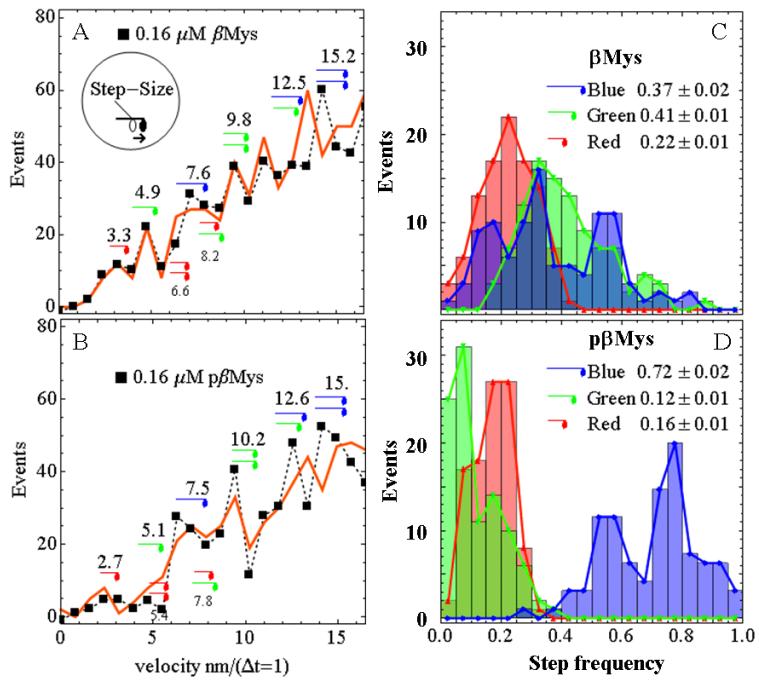
Figure 4 Panels A & B show actin sliding velocity event distributions in the low velocity domain 0-15 nm/(Δt=1) for Δt = 200 msec. Baselines due to thermal/mechanical fluctuations were subtracted. Peaks corresponding to short (red), intermediate (green), and long (blue) step-sizes of ~3, ~5, and ~8 nm are indicated as observed previously (13). Some step combinations are indicated with the appropriate symbol combinations.
Figure 4.
Measured (squares and dashed line) and simulated (red line) velocity event distributions for unphosphorylated (Panel A) and phosphorylated (Panel B) βMys (βMys and pβMys) and 200 ms frame capture interval. The Panel A insert indicates translation of the motor domain associated with unitary step-size and lever-arm rotation. Unitary steps of ~3 nm (red), ~5 nm (green), and ~8 nm (blue) are indicated symbolically near their event distribution peak. Several unitary step combinations are also indicated. Panels C & D show the histograms for step frequency. βMys panels (0% phosphorylation) corresponded to 894 total unitary events and pβMys panels (81-89% phosphorylated) to 710 total unitary events. The simulated velocity curve corresponds to the best fitting single simulation while the histograms summarize findings from the best 100 simulations. Errors are SEM for 100 simulations.
Simulated curves, indicated by the red solid lines, are computed as described in Methods. We performed 12,000 simulations of the velocity event distribution in each condition then selected the 100 best fitting curves. Each simulated curve estimates the number of 3, 5, or 8 nm steps (step count) in the velocity curve. Step count is normalized by dividing the step count by the total number of unitary steps to give the relative step frequency. Each simulation gives the step frequency for 3, 5, and 8 nm steps. In 100 simulations we have 100 estimates of the step frequency. The histogram height in Figure 4 Panels C & D reflects the number of times (events) step frequency falls within a bin width of 0.05 for each of the three unitary steps. Step frequency numerical averages ± SEM (n=100) for the 3, 5, and 8 nm unitary steps are also shown in the panels. The 5 nm step in βMys has highest average frequency, 8 nm slightly lower, and 3 nm a low average frequency as expected (13). A dramatic re-distribution is observed for pβMys where the ~8 nm step on average accounts for 72% of all steps. Measurements at bulk myosin concentrations from 0.08 to 0.16 (shown) μM indicated phosphorylation caused the myosin to favor the longest unitary step-size.
The low probability event combinations falling into the range occupied by unitary steps are indicated under the velocity curve in Figure 4 Panels A & B in the smaller font. The short-step probability is too low to contribute significantly as a doublet. In the unphosphorylated βMys case, the ~8 nm peak is similar in length to the short and medium steps in combination. We adapted the simulation to investigate the relative contributions of the combined steps and unitary 8 nm step to the 8 nm peak as described (13). We obtained results identical to those reported previously where with the 8 nm unitary step included in the simulation, the best fits fully account for observation (red line Figure 4 Panels A & B). Without the 8 nm unitary step, best fitting causes the simulation to substantially overshoot the 3 and 5 nm peaks in the velocity histogram indicating the event deficit at 8 nm. The peak assigned to the combined 5 and 8 nm steps is substantially under-occupied in the simulation, again demonstrating the need for the unitary 8 nm step. Representative curves were already shown for this case [blue line Figure 5 Panels A & B in Wang et al. (13)]. In the pβMys case probability for 3 and 5 nm steps were frequently negligible leaving the 8 nm step as the principal unitary step.
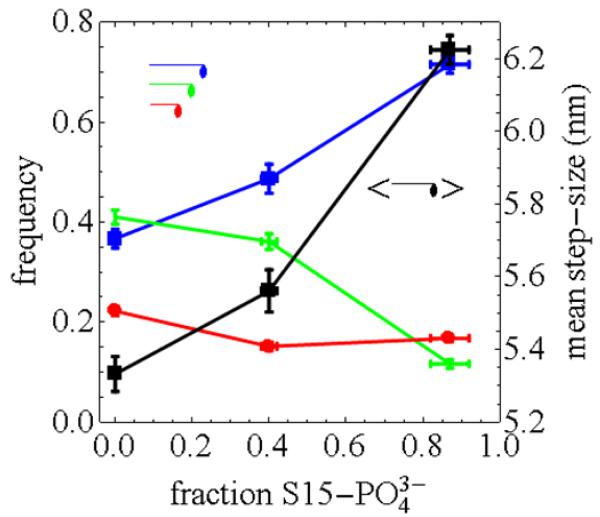
Figure 5 shows relative frequencies for the short (red), intermediate (green), and long (blue) step-sizes of 3, 5, and 8 nm and for the 0, 0.4, and 0.85 phosphorylated fraction samples. The curves indicate that frequency gain for the 8 nm step depletes the 5 nm step frequency while the short step frequency is unchanged as the fraction of S15’s phosphorylated increases. The black curve is the mean step size vs the fraction of S15’s phosphorylated. It shows an approximately linear increase.
Figure 5.
Relative frequency (left abscissa) and mean step-size (right abscissa) associated with the unitary steps vs the fraction of RLC S15 phosphorylation. The blue (8 nm), green (5 nm), and red (3 nm) curves indicate that the frequency gain as the fraction of S15’s phosphorylated increases. The black curve shows the approximately linear increase in the mean step size vs the fraction of S15’s phosphorylated. Vertical error bars in blue, green, and red curves are frequency SEM for 100 simulations. Vertical error bars for the black curve are mean step-size SEM combining step-size and step frequency errors. Horizontal error bars on all curves are estimates based on the declining phosphorylated fraction over the course of the experiments as indicated in Figure 1.
The motility velocity, vm equals d×Vmax/f, for step-size d and duty cycle f. Based on vm, average step-size, and Vmax measured here, duty cycles for pβMys and βMys are identical at 0.020 ± 0.004 in agreement with accepted values (11).
DISCUSSION
We detected 3 unitary step-sizes for βMys (gene MYH7, slow skeletal myosin) vs the apparent single 5 nm unitary step for rabbit sHMM (gene MYH2, fast skeletal myosin) (12) using the Qdot assay (13). In βMys we observed most frequently a 5 nm step like that in sHMM, a less frequent 8 nm step, and a rare 3 nm step. Relative frequencies of the 3 and 5 nm steps are very different making it unlikely that they are sub-steps of the longer 8 nm unitary step. Cardiac myosin ELC’s (cELC, genes MYL3 or MYL4) have a unique N-terminus known to bind actin and to influence myosin function in the heart (14, 24, 25). Fast skeletal myosin ELC (MYL1) corresponds to either long (LC1) or short (LC3) ELC on sHMM with LC1 probably making an actin contact but unlike the binding of cELC (26). We proposed previously that the 3 and 8 nm steps in βMys were coupled to cELC actin binding suggesting why sHMM does not indicate multiple steps (13).
Three different publications over a 12 year span reported cardiac myosin step-size consistent with a single 7 ± 3 nm step (27-29). The single unitary displacement reported is consistent with the 6.2 nm weighted average of our three step-sizes. The reported step-size resolution for the laser trap experiments is too low to discern the different unitary steps we observed except for the 3 nm step. The Qdot assay is a different approach with better spatial resolution because absolute displacements of ~1 nm are measurable under favorable conditions. Our step-size standard error corresponds to about half a nanometer for the short step. The minor probability of the short step makes it a negligible contributor until skeletal and cardiac myosin Qdot assays are compared head-to-head. Then the multistep signature of the cardiac myosin is definitive [compare Figures 4 and 5 in Wang et al. (13)]. This clear skeletal/cardiac myosin distinction caused additional scrutiny leading to identification of 3 unitary step-sizes. The multiple unitary step-sizes in βMys have an apparent probability that could be altered to affect contraction velocity and efficiency under load. We hypothesized that unitary step-size probabilities are adjusted in vivo to accomplish thick filament contractility regulation (13).We investigated this hypothetical mechanism with the present work.
Changes to RLC phosphorylation levels in the cardiac muscle affect power output in model organisms (5). Large model simulation suggested that mechanical coupling by the lever-arm complex plays a critical role in contraction via lever-arm stiffness and stiffness modulation by RLC phosphorylation (7). We showed here that RLC phosphorylation affects the distribution of βMys step-sizes. The result is summarized in Figure 5 where average step-size increases ~17% with 0-85% S15 phosphorylation. The adaptive myosin step-size is a new mechanism for thick filament contraction regulation. Higher phosphorylation levels correlate with higher isometric force and power output in permeabilized rat cardiac trabeculae and with heart failure in human tissue (30). The longer working stroke may contribute to the increase in force and power associated with higher phosphorylation levels that are used to compensate the power shortage in a failing heart.
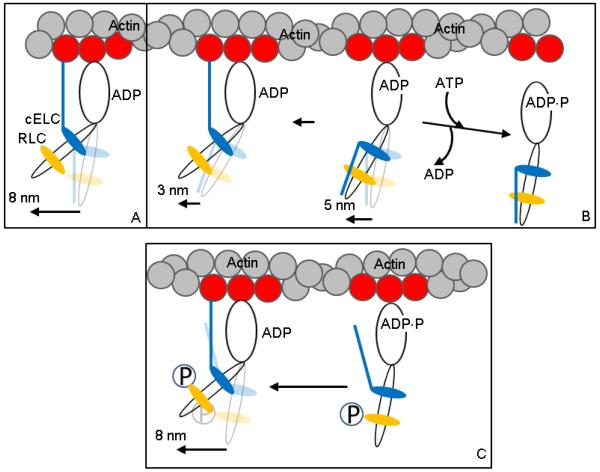
Figure 6 shows a hypothetical 3 step-size mechanism describing βMys movement of actin in vitro and its proposed modification to accommodate our new results for phosphorylated RLC. Panels A and B depict the unphosphorylated RLC case. Panel A is the full lever-arm swing of 8 nm with actin binding of the cELC N-terminus. Panel B shows the default 5 nm step detaching from actin (towards right) with ATP binding before the binding of the cELC can occur, and, an unlikely event when lingering ADP causes a subsequent 3 nm step (towards left) (13). The unphosphorylated RLC does not repel the actin binding cELC N-terminus peptide allowing the peptide to frequently maintain a conformation unfavorable for interaction with actin. Panel C depicts the phosphorylated RLC case. The presence of charged phosphate modifying S15 in RLC restricts the cELC N-terminus conformation to one more favorable for interaction with actin. In this case, steady-state for the 3 step-size mechanism favors the 8 nm step-size with the 3 and 5 nm steps in the minority. The hypothetical mechanism indicated in Figure 6 focuses on the impact of RLC phosphorylation on the local cELC N-terminus conformation. Mechanisms suggesting RLC phosphorylation affects the whole cross-bridge conformation to favor actin interaction by cross-bridge repulsion from the thick filament (31) appears qualified to account for our observations however our data suggests that the structure of the nominally intact fiber with interdigitated thin and thick filament is not necessary lending credibility to our local model.
Figure 6.
Hypothetical 3 step-size mechanism for βMys moving actin in vitro and its modification by RLC S15 phosphorylation. Panels A and B depict the unphosphorylated βMys species and Panel C the phosphorylated species. Panel A is the full lever-arm swing of 8 nm with actin binding of the cELC N-terminus. Panel B shows the 5 nm step followed by detachment from actin (towards right) or an unlikely event when lingering ADP causes a subsequent 3 nm step (towards left). The actin binding N-terminus peptide of cELC is frequently constrained to a position unfavorable for its attachment to actin. Panel C shows the actin binding N-terminus peptide of cELC pre-positioned to interact with actin due to repulsion of the peptide by phosphate (P) at S15 of pRLC. This conformation favors the 8 nm step.
Figure 5 indicates that RLC S15 phosphorylation promotes a frequency gain for the 8 nm step and frequency loss in the 5 nm step while the 3 nm step frequency is largely unaffected. The Figure 6 model suggests the declining frequency for the 5 nm step should trigger a frequency decline for the 3 nm step since the 3 nm step follows on the 5 nm step. This does not appear to be the case implying the shortest step originates independently or that the normally low frequency for the short step limits our ability to properly count its contribution. The ~20% step frequency for the short step is difficult to accurately separate from thermal/mechanical fluctuations.
Alternative to the Figure 6 model, RLC phosphorylation was proposed to increase lever-arm stiffness based on motility velocity measurements of skeletal myosin under load (32). Increased stiffness in the lever-arm was not directly measured (unlike our step-size and step frequency) but it could cause the observed increased step-frequency for the longest step-size. In this case, modulating lever-arm stiffness due to S15 phosphorylation would modulate the relative step frequencies in cardiac myosin but the cELC/actin link is still needed to address the origin of the 1 step-size vs 3 step-sizes in skeletal vs cardiac myosin. This alternative hypothesis involves an untested mechanism for coupling RLC phosphorylation to lever-arm stiffness analogous to that depicted in Figure 6 for coupling phosphorylation to repulsion of the ELC N-terminus.
Lever-arm lengths in skeletal and cardiac myosin are identical by homology modeling hence the full 8 nm step facilitated by the cELC/actin link corresponds to a lever-arm rotation ~19 deg larger than for a 5 nm step (assuming a 9 nm lever-arm length and a 3 nm step). If the cELC N-terminus is necessary for the 8 nm step it implies that the heavy chain itself does not modulate step-size and that a significant part of the energy transduction mechanism lies outside the βMys heavy chain.
CONCLUSION
Three unitary step-sizes at work in βMys were discovered previously using the novel Qdot assay (13). Here we use the Qdot assay to assess the effect of RLC S15 phosphorylation on unitary step-size distribution. We show that the unitary step frequency responds to the phosphorylation of S15. The manner of the response is nominally linear with increasing mean step-size correlated with increasing levels of S15 phosphorylation. Mean step-size increases by ~0.9 nm going from 0 to 85% S15 phosphorylation. This finding identifies the regulatory mechanism granting the influence of RLC phosphorylation over cardiac function.
Supplementary Material
HIGHLIGHTS.
Qdot motility assay simplifies and refines in vitro myosin step-size measurements
We measured multiple unitary step-sizes in cardiac ventricular myosin
Myosin regulatory light chain phosphorylation modulates multiple step-size frequency
Increasing levels of phosphorylation correlates with increasing mean step-size
We identify the mechanism granting phosphorylation control over cardiac function
ACKNOWLEDGEMENTS
This work was supported by NIH grants R01AR049277 and R01HL095572 and by the Mayo Foundation. Smooth muscle myosin light chain kinase (smMLCK) was expressed at the Recombinant Protein and Monoclonal Antibody Production Shared Resource at Baylor College of Medicine with funding from NIH Cancer Center Support Grant P30 CA125123.
ABBREVIATIONS
- βMys
β cardiac myosin (gene MYL7)
- cELC
Cardiac myosin ELC’s (genes MYL3 or MYL4)
- pβMys
RLC S15 phosphorylated βMys
- RLC
Cardiac myosin regulatory light chain (gene MYL2)
- smMLCK
smooth muscle myosin light chain kinase
Footnotes
Publisher's Disclaimer: This is a PDF file of an unedited manuscript that has been accepted for publication. As a service to our customers we are providing this early version of the manuscript. The manuscript will undergo copyediting, typesetting, and review of the resulting proof before it is published in its final citable form. Please note that during the production process errors may be discovered which could affect the content, and all legal disclaimers that apply to the journal pertain.
DISCLOSURES
None
REFERENCES
- 1.Josephson MP, Sikkink LA, Penheiter AR, Burghardt TP, Ajtai K. Smooth muscle myosin light chain kinase efficiently phosphorylates serine 15 of cardiac myosin regulatory light chain. Biochem. Biophys. Res. Commun. 2011;416:367–371. doi: 10.1016/j.bbrc.2011.11.044. [DOI] [PMC free article] [PubMed] [Google Scholar]
- 2.Lowey S, Waller GS, Trybus KM. Function of skeletal muscle myosin heavy and light chain isoforms by an in vitro motility assay. J. Biol. Chem. 1993;268:20414–20418. [PubMed] [Google Scholar]
- 3.Sherwood JJ, Waller GS, Warshaw DM, Lowey S. A point mutation in the regulatory light chain reduces the step size of skeletal muscle myosin. Proceedings of the National Academy of Sciences. 2004;101:10973–10978. doi: 10.1073/pnas.0401699101. [DOI] [PMC free article] [PubMed] [Google Scholar]
- 4.Pant K, Watt J, Greenberg M, Jones M, Szczesna-Cordary D, Moore JR. Removal of the cardiac myosin regulatory light chain increases isometric force production. The FASEB Journal. 2009;23:3571–3580. doi: 10.1096/fj.08-126672. [DOI] [PMC free article] [PubMed] [Google Scholar]
- 5.Scruggs SB, Solaro RJ. The signficiance of regulatory light chain phosphorylation in cardiac physiology. Arch. Biochem. Biophys. 2011;510:129–134. doi: 10.1016/j.abb.2011.02.013. [DOI] [PMC free article] [PubMed] [Google Scholar]
- 6.Stull JT, Kamm KE, Vandenboom R. Myosin light chain kinase and the role of myosin light chain phosphorylation in skeletal muscle. Arch. Biochem. Biophys. 2011;510:120–128. doi: 10.1016/j.abb.2011.01.017. [DOI] [PMC free article] [PubMed] [Google Scholar]
- 7.Sheikh F, Ouyang K, Campbell SG, Lyon RC, Chuang J, Fitzsimons D, Tangney J, Hidalgo CG, Chung CS, Cheng H, Dalton ND, Gu Y, Kasahara H, Ghassemian M, Omens JH, Peterson KL, Granzier HL, Moss RL, McCulloch AD, Chen J. Mouse and computational models link Mlc2v dephosphorylation to altered myosin kinetics in early cardiac disease. J. Clin. Invest. 2012;122:1209–1221. doi: 10.1172/JCI61134. [DOI] [PMC free article] [PubMed] [Google Scholar]
- 8.Oldfors A. Hereditary myosin myopathies. Neuromuscul. Disord. 2007;17:355–367. doi: 10.1016/j.nmd.2007.02.008. [DOI] [PubMed] [Google Scholar]
- 9.Toydemir RM, Rutherford A, Whitby FG, Jorde LB, Carey JC, Bamshad MJ. Mutations in embryonic myosin heavy chain (MYH3) cause Freeman-Sheldon syndrome and Sheldon-Hall syndrome. Nat. Genet. 2006;38:561–565. doi: 10.1038/ng1775. [DOI] [PubMed] [Google Scholar]
- 10.Burghardt TP, Sikkink LA. Regulatory Light Chain Mutants Linked to Heart Disease Modify the Cardiac Myosin Lever-Arm. Biochemistry. 2013;52:1249–1259. doi: 10.1021/bi301500d. [DOI] [PMC free article] [PubMed] [Google Scholar]
- 11.O’Connell CB, Tyska MJ, Mooseker MS. Myosin at work: Motor adaptations for a variety of cellular functions. Biochimica Biophysica Acta. 2007;1773:615–630. doi: 10.1016/j.bbamcr.2006.06.012. [DOI] [PubMed] [Google Scholar]
- 12.Steffen W, Smith D, Simmons R, Sleep J. Mapping the actin filament with myosin. Proc. Nat. Acad. Sci. USA. 2001;98:14949–14954. doi: 10.1073/pnas.261560698. [DOI] [PMC free article] [PubMed] [Google Scholar]
- 13.Wang Y, Ajtai K, Burghardt TP. Qdot Labeled Actin Super-Resolution Motility Assay Measures Low Duty Cycle Muscle Myosin Step-Size. Biochemistry. 2013;52:1611–1621. doi: 10.1021/bi301702p. [DOI] [PMC free article] [PubMed] [Google Scholar]
- 14.Miyanishi T, Ishikawa T, Hayashibara T, Maita T, Wakabayashi T. The two actin-binding regions on the myosin heads of cardiac muscle. Biochemistry. 2002;41:5429–5438. doi: 10.1021/bi0118355. [DOI] [PubMed] [Google Scholar]
- 15.Schaub MC, Hefti MA, Zuellig RA, Morano I. Modulation of contractility in human cardiac hypertrophy by myosin essential light chain isoforms. Cardiovasc. Res. 1998;37:381–404. doi: 10.1016/s0008-6363(97)00258-7. [DOI] [PubMed] [Google Scholar]
- 16.Siemankowski RF, White HD. Kinetics of the interaction between actin, ADP, and cardiac myosin-S1. J. Biol. Chem. 1984;259:5045–5053. [PubMed] [Google Scholar]
- 17.Greenberg MJ, Kazimierczak K, Szczesna-Cordary D, Moore JR. Cardiomyopathy-linked myosin regulatory light chain mutations disrupt myosin strain-dependent biochemistry. Proc. Nat. Acad. Sci. USA. 2010;107:17403–17408. doi: 10.1073/pnas.1009619107. [DOI] [PMC free article] [PubMed] [Google Scholar]
- 18.Ajtai K, Garamszegi SP, Park S, Velazquez Dones AL, Burghardt TP. Structural characterization of β-cardiac myosin subfragment 1 in solution. Biochemistry. 2001;40:12078–12093. doi: 10.1021/bi0112098. [DOI] [PubMed] [Google Scholar]
- 19.Pardee JD, Spudich JA. Purification of muscle actin. Methods Enzymol. 1982;85:164–179. doi: 10.1016/0076-6879(82)85020-9. [DOI] [PubMed] [Google Scholar]
- 20.Fiske CH, Subbarow Y. The Colorimetric Determination of Phosphorus. J. Biol. Chem. 1925;66:375–400. [Google Scholar]
- 21.Stout AL, Axelrod D. Evanescent field excitation of fluorescence by epi-illumination microscopy. Applied Optics. 1989;28:5237–5242. doi: 10.1364/AO.28.005237. [DOI] [PubMed] [Google Scholar]
- 22.Henriques R, Lelek M, Fornasiero EF, Valtorta F, Zimmer C, Mhlanga MM. QuickPALM: 3D real-time photoactivation nanoscopy image processing in ImageJ. Nature Methods. 2010;7:339–340. doi: 10.1038/nmeth0510-339. [DOI] [PubMed] [Google Scholar]
- 23.Meijering E, Dzyubachyk O, Smal I. Chapter nine - Methods for Cell and Particle Tracking. In: Conn PM, editor. Methods Enzymol. Academic Press; 2012. pp. 183–200. [DOI] [PubMed] [Google Scholar]
- 24.Morano I. Tuning the human heart molecular motors by myosin light chains. J.Mol.Med. 1999;77:544–555. doi: 10.1007/s001099900031. [DOI] [PubMed] [Google Scholar]
- 25.Michael JJ, Gollapudi SK, Ford SJ, Kazmierczak K, Szczesna-Cordary D, Chandra M. Deletion of 1–43 amino acids in cardiac myosin essential light chain blunts length dependency of Ca2+ sensitivity and cross-bridge detachment kinetics. American Journal of Physiology - Heart and Circulatory Physiology. 2013;304:H253–H259. doi: 10.1152/ajpheart.00572.2012. [DOI] [PMC free article] [PubMed] [Google Scholar]
- 26.Kazmierczak K, Xu YY, Jones M, Guzman G, Hernandez OM, Kerrick WGL, Szczesna-Cordary D. The role of the N-terminus of the myosin essential light chain in cardiac muscle contraction. J. Mol. Biol. 2009;387:706–725. doi: 10.1016/j.jmb.2009.02.006. [DOI] [PMC free article] [PubMed] [Google Scholar]
- 27.Sugiura S, Kobayakawa N, Fujita H, Yamashita H, Momomura S.-i., Chaen S, Omata M, Sugi H. Comparison of Unitary Displacements and Forces Between 2 Cardiac Myosin Isoforms by the Optical Trap Technique: Molecular Basis for Cardiac Adaptation. Circ. Res. 1998;82:1029–1034. doi: 10.1161/01.res.82.10.1029. [DOI] [PubMed] [Google Scholar]
- 28.Palmiter KA, Tyska MJ, Dupuis DE, Alpert NR, Warshaw DM. Kinetic differences at the single molecule level account for the functional diversity of rabbit cardiac myosin isoforms. The Journal of Physiology. 1999;519:669–678. doi: 10.1111/j.1469-7793.1999.0669n.x. [DOI] [PMC free article] [PubMed] [Google Scholar]
- 29.Debold EP, Saber W, Cheema Y, Bookwalter CS, Trybus KM, Warshaw DM, VanBuren P. Human actin mutations associated with hypertrophic and dilated cardiomyopathies demonstrate distinct thin filament regulatory properties in vitro. J. Mol. Cell. Cardiol. 2010;48:286–292. doi: 10.1016/j.yjmcc.2009.09.014. [DOI] [PMC free article] [PubMed] [Google Scholar]
- 30.Toepfer C, Caorsi V, Kampourakis T, Sikkel MB, West TG, Leung M-C, Al-Saud SA, MacLeod KT, Lyon AR, Marston SB, Sellers JR, Ferenczi MA. Myosin Regulatory Light Chain (RLC) Phosphorylation Change as a Modulator of Cardiac Muscle Contraction in Disease. J. Biol. Chem. 2013;288:13446–13454. doi: 10.1074/jbc.M113.455444. [DOI] [PMC free article] [PubMed] [Google Scholar]
- 31.Colson BA, Locher MR, Bekyarova T, Patel JR, Fitzsimons DP, Irving TC, Moss RL. Differential roles of regulatory light chain and myosin binding protein-C phosphorylations in the modulation of cardiac force development. The Journal of Physiology. 2010;588:981–993. doi: 10.1113/jphysiol.2009.183897. [DOI] [PMC free article] [PubMed] [Google Scholar]
- 32.Greenberg MJ, Mealy TR, Watt JD, Jones M, Szczesna-Cordary D, Moore JR. The molecular effects of skeletal muscle myosin regulatory light chain phosphorylation. American Journal of Physiology - Regulatory Integrative & Comparative Physiology. 2009;297:R265–R274. doi: 10.1152/ajpregu.00171.2009. [DOI] [PMC free article] [PubMed] [Google Scholar]
Associated Data
This section collects any data citations, data availability statements, or supplementary materials included in this article.


