

We were glad to see discussion of the dangers of distracted driving to vulnerable road users in the article by Stimpson et al. in the November/December 2013 issue of Public Health Reports.1 However, we question the conclusion that pedestrian and bicyclist victims of distracted driving crashes are disproportionately non-Hispanic white. This inference appears to be drawn from the results in Table 1 of the article, where the rates are calculated per one million total population, which fails to account for the different sizes of the populations of each race/ethnicity. To correctly evaluate the rate of fatal crashes for a particular race/ethnicity (e.g., non-Hispanic white people), it is necessary to normalize by the pertinent population—non-Hispanic white people—rather than the total population. A similar rule applies to selecting a denominator for the other rates in the table. As it is, the values in Table 1 of Stimpson et al. provide little information on the relative burden of fatal crashes among different groups.
Original Table 1 (with a population column). Characteristics of pedestrian, bicycle rider, and motorist fatalities from distracted driving-related crashes in the U.S.: Fatality Analysis Reporting System, 2005–2010
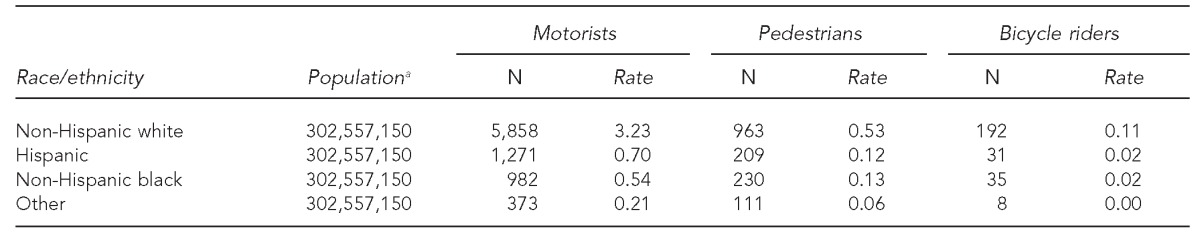
aAverage U.S. population, 2005–2010. Source: Census Bureau (US). National intercensal estimates (2000–2010) [cited 2014 Apr 11]. Available from: URL: http://www.census.gov/popest/data/intercensal/national/nat2010.html
In the revised table we have provided, we computed the rates for the race/ethnicity category according to the average intercensal estimates of population by race during the six-year period of interest. We also provide the corresponding section of the original table for comparison. The revised results indicate that there is significantly less variation among racial/ethnic groups. The non-Hispanic black population is disproportionately victim to fatal distracted driving crashes as pedestrians, while both the non-Hispanic white and non-Hispanic black populations have higher rates of fatalities as bicycle riders. These differences may also be explained by differences in exposure to the different modes, so we are reluctant to draw any strong conclusions.
Revised Table 1. Characteristics of pedestrian, bicycle rider, and motorist fatalities from distracted driving-related crashes in the U.S.: Fatality Analysis Reporting System, 2005–2010

aAverage U.S. population by race, 2005–2010. Source: Census Bureau (US). National intercensal estimates (2000–2010) [cited 2014 Apr 11]. Available from: URL: http://www.census.gov/popest/data/intercensal/national/nat2010.html
REFERENCE
- 1.Stimpson JP, Wilson FA, Muelleman RL. Fatalities of pedestrians, bicycle riders, and motorists due to distracted driving motor vehicle crashes in the U.S., 2005–2010. Public Health Rep. 2013;128:436–42. doi: 10.1177/003335491312800603. [DOI] [PMC free article] [PubMed] [Google Scholar]