

Abstract
Objective
Illegal drug use is a persistent problem, prescription drug abuse is on the rise, and there is clinical evidence that drug use reduces driving performance. This study describes trends in characteristics of drivers involved in fatal motor vehicle crashes who test positive for drugs.
Methods
We used the Fatality Analysis Reporting System—a census of motor vehicle crashes resulting in at least one fatality on U.S. public roads—to investigate suspected drug use for the period 1993–2010.
Results
Drugged drivers who were tested for drug use accounted for 11.4% of all drivers involved in fatal motor vehicle crashes in 2010. Drugged drivers are increasingly likely to be older drivers, and the percentage using multiple drugs increased from 32.6% in 1993 to 45.8% in 2010. About half (52.4%) of all drugged drivers used alcohol, but nearly three-quarters of drivers testing positive for cocaine also used alcohol. Prescription drugs accounted for the highest fraction of drugs used by drugged drivers in fatal crashes in 2010 (46.5%), with much of the increase in prevalence occurring since the mid-2000s.
Conclusions
The profile of a drugged driver has changed substantially over time. An increasing share of these drivers is now testing positive for prescription drugs, cannabis, and multiple drugs. These findings have implications for developing interventions to address the changing nature of drug use among drivers in the U.S.
Overall fatality rates from motor vehicle crashes in the United States, including those from drunk driving, have declined in recent years,1,2 but less is known about the trend in legal and illegal drug use and traffic fatalities involving drugged drivers in the U.S.3 Empirical evidence from observational and clinical studies shows the negative influence of illegal drug use on driving behavior and crash risk.4–13 For example, cannabis has been shown to increase driving reaction times, impair time and distance estimation, and decrease motor coordination for up to three hours after dosage.14 One study found that cannabis doubles the risk of being fatally injured in traffic and found large increases in the odds of injury when cannabis is combined with cocaine, alcohol, or benzodiazepines.15 Another study showed that cannabis is the most frequently found drug among fatally injured drivers who were speeding at the time of the crash.16 High doses of cocaine and methamphetamines are associated with aggressive and reckless driving behaviors.14,16–19 A recent and growing body of epidemiological and clinical research also demonstrates the complex influence that prescription medications have on crash risk.20–28 Results from these studies may be cause for concern in light of a recent report that prescription drug abuse is on the rise and is a growing public health problem.29 We used population data to report on trends involving certain legal and illegal drugs in fatal motor vehicle crashes and describe the characteristics of people in crashes who tested positive for drugs.
METHODS
Data sources
We used the National Highway Traffic Safety Administration's (NHTSA's) Fatality Analysis Reporting System (FARS) to examine trends in the characteristics of drugged drivers and their involvement in fatal motor vehicle crashes. FARS is a census of all crashes on public roads that result in at least one fatality within 30 days of the crash. It provides detailed records for every crash compiled from several authoritative sources, including police, medical examiners, emergency medical technicians, and hospital providers, and contains detailed information on all occupants involved in the crash. If investigators suspect drug use by people involved in fatal crashes, blood and/or urine samples are collected from the driver or other vehicle occupants and sent to a laboratory for toxicology testing. Nicotine, aspirin, or any drug administered by emergency medical or hospital personnel after a crash are excluded from test results. Results from toxicology reports for each tested vehicle occupant are provided. More information on FARS is available elsewhere.30
The study period was 1993–2010. Toxicology findings prior to 1993 are not available, and 2010 is the most recent year of data available from FARS. A total of 986,173 drivers aged 16 years or older were involved in fatal crashes during this period; 287,907 (29.2%) of these drivers were tested for drugs. Of the drivers who were tested for drugs, 184,554 (64.1%) tested negative, 60,560 (21.0%) tested positive and the drugs used were identified (excluding inhalants), 42,696 (14.8%) tested positive but the drugs were not identified by name, and 97 (<1%) tested positive for inhalants. A total of 128,602 (13.0%) drivers involved in fatal crashes were unknown to have been tested.
This study examines the 60,560 drivers who tested positive for at least one identifiable drug from 1993 to 2010. The distribution of tests given to drivers testing positive for drugs in 2010 was 87.0% blood testing only, 4.8% urine testing only, 7.2% both blood and urine testing, and 1.0% other testing. These findings compare with 66.2% blood testing only, 17.7% urine testing only, 14.5% both blood and urine testing, and 1.6% other testing in 1993.
Measures
FARS provides the drug names from positive drug testing, spanning 373 possible drugs in eight drug categories, including narcotics, depressants, stimulants, hallucinogens, cannabinoids, phencyclidine (PCP), anabolic steroids, and inhalants. Indeterminate drug results were coded as “other,” “tested; results unknown,” “tested; drugs found; type unknown,” or “unknown if tested for drugs.” We examined drugs classified by the U.S. Drug Enforcement Agency (DEA) into Schedules I-V.31 Schedule I drugs include those determined by the DEA to “have a high potential for abuse, have no currently accepted medical use in treatment in the United States, and there is a lack of accepted safety for use of the drug or other substance under medical supervision.”
Schedule II-V drugs may be prescribed by physicians for medical treatment but vary in their potential for drug abuse and psychological/physical dependence.31 Schedule definitions and selected examples of these drugs are provided in Figure 1. Schedule II-V drugs are defined as prescription drugs in the analysis. Inhalants such as volatile solvents, plastic cement, paint, and aerosols were excluded.
Figure 1.
Schedule definitions and examples of controlled substances classified by the U.S. Drug Enforcement Administration: U.S., 2013a
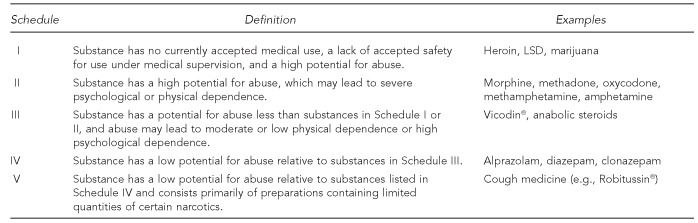
aSource: Drug Enforcement Administration (US), Office of Diversion Control. Controlled substance schedules [cited 2013 Jun 21]. Available from: URL: http://www.deadiversion.usdoj.gov/schedules/index.html
The most commonly abused illicit drugs identified in FARS—cannabis, cocaine (including crack), and methamphetamine—were examined separately and compared with prescription drugs. The cannabis variable includes all cannabinoid variants (e.g., delta 9, hashish, and tetrahydrocannabinol [better known as THC]). The cocaine variable includes cocaine and benzoylecgonine, a metabolite for cocaine. Prescription drugs are defined as other Schedule II-V drugs. Note that cocaine and methamphetamine are Schedule II drugs and, thus, may be prescribed for medical reasons; however, they are excluded from the definition of other Schedule II-V drugs.
Demographic variables included gender and age. We categorized driver's age as 16–29, 30–49, or ≥50 years of age. Other characteristics included whether the driver was drinking and U.S. Census region. We examined blood alcohol concentration (BAC) level using multiple imputation values for BAC provided by NHTSA.32 We categorized the use of multiple drugs as testing positive for one, two, or ≥3 drugs. We also examined injury severity (none, nonfatal injury, or fatal injury) of drugged drivers.
Analytical plan
We examined all drivers testing positive for drugs and their motor vehicle crashes from 1993–2010. We also compared drugged drivers by cannabis, cocaine, methamphetamine, and prescription drug use in 2010. Trends in multidrug use are shown, and the most prevalent illicit and prescription drugs detected in drugged drivers are identified. We used Stata® version 12 for all analyses.33
RESULTS
From 1993 to 2010, the number of drivers tested for drugs among all drivers involved in fatal motor vehicle crashes increased from 1,631 to 2,363. Drugged drivers involved in fatal motor vehicle crashes in 2010 tended to be male (75.4%) and younger than 50 years of age (72.8%). However, the age distribution of drivers varied by drug type. For example, in 2010, 59.9% of cannabis-only users vs. 24.9% of prescription drug and 24.8% of cocaine-only users were younger than 30 years of age; 39.2% of prescription drug users were ≥50 years of age (Table). In fact, the percentage of all drugged drivers aged ≥50 years increased from 14.4% in 1993 to 26.2% in 2010 (data not shown but available from the authors upon request).
Table.
Characteristics of drugged drivers involved in fatal motor vehicle crashes: U.S., 2010a
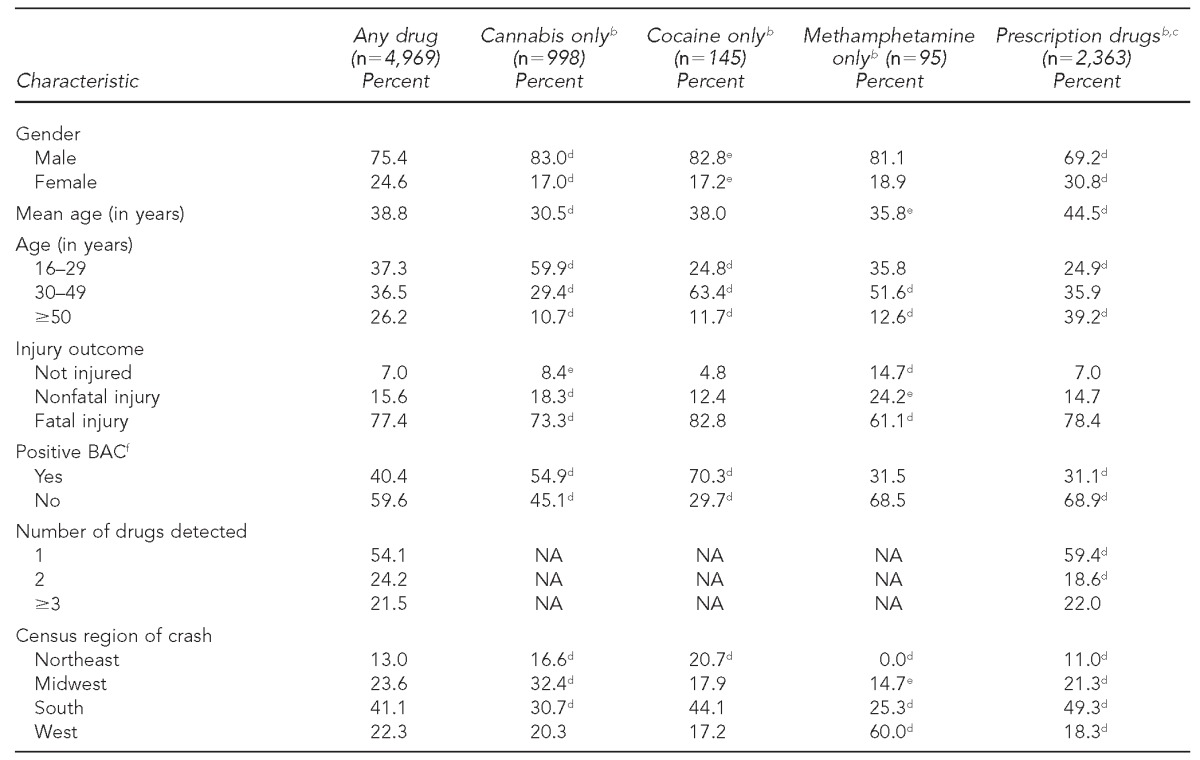
Data source: National Highway Traffic Safety Administration (US). FARS analytic reference guide 1975–2009. DOT HS 811 352. Washington: Department of Transportation (US); 2010.
bPearson's Chi-square test was used to test statistical significance by characteristic and drug type (cannabis only, cocaine only, methamphetamine only, and prescription drugs).
cDefined as Schedule II-V drugs other than cocaine or methamphetamines
dSignificant at p<0.001
eSignificant at p<0.05
fBased on having a positive BAC using multiple imputation values provided by the National Highway Traffic Safety Administration
BAC = blood alcohol concentration
NA = not available
The likelihood of having a positive BAC also varied by drug type. In 2010, 54.9% of drivers testing positive for cannabis only and 70.3% of drivers testing positive for cocaine only were also using alcohol at the time of the motor vehicle crash vs. 31.1% of drivers testing positive for prescription drugs (excluding cocaine and methamphetamines). For methamphetamine-only users, 31.5% were using alcohol. Cannabis-only motor vehicle crashes were more likely to occur in the Midwest (32.4%) and South (30.7%), but nearly half of cocaine (44.1%) and prescription drug (49.3%) crashes occurred in the South; together, 85.3% of crashes involving methamphetamine-only drivers occurred in the South and West. We did find a rising trend in the number of drugs detected among drugged drivers (Table). The percentage of drivers detected with ≥3 drugs nearly doubled from 1993 to 2010, from 11.5% to 21.5% (p<0.001) (Figure 2).
Figure 2.
Trend in number of drugsa detected among drugged drivers involved in fatal motor vehicle crashes, by year: U.S., 1993–2010b

aExcluding alcohol
bData source: National Highway Traffic Safety Administration (US). FARS analytic reference guide 1975–2009. DOT HS 811 352. Washington: Department of Transportation (US); 2010.
Figure 3 shows the percentage of drugged drivers in fatal crashes using cannabis, cocaine, methamphetamine, other Schedule I drugs, and other Schedule II-V (prescription) drugs. The percentage of drugged drivers testing positive for cocaine decreased during the study period. For example, the percentage of drugged drivers detected using cocaine fell from 20.6% in 1993 to 9.8% in 2010 (p<0.001). By contrast, detection of cannabis in drugged drivers increased from 28.8% in 1993 to 36.9% in 2010 (p<0.001), although the trend was flat for much of the 2000s. Compared with the use of all other categories of drugs by drivers in fatal crashes, prescription drug use was more prevalent. After declining in use by drugged drivers from 42.2% in 1993 to 36.6% in 2004 (p=0.001), prescription drugs (Schedule II-V) were used by 46.5% of all drugged drivers in 2010 (p<0.001 since 2004).
Figure 3.
Trends in drugsa used as a percentage of all drugged drivers involved in fatal motor vehicle crashes, by drug type and year: U.S., 1993–2010b

aCocaine and methamphetamine are excluded from the other Schedule II-V category.
bData source: National Highway Traffic Safety Administration (US). FARS analytic reference guide 1975–2009. DOT HS 811 352. Washington: Department of Transportation (US); 2010.
Figure 4 presents trends in drugged drivers' use of the most commonly prescribed medications as a percentage of all prescribed drugs, excluding cocaine and methamphetamine, for 1993–2010 (p<0.001 for each medication). The presence of diazepam (e.g., Valium®) steadily declined during the study period, from 18.5% of all prescribed medications used in 1993 to 8.4% of all prescribed medications used in 2010. The analgesic oxycodone (e.g., Oxycontin®) quickly increased in use after 1999, accounting for 10.2% of prescribed medications used by drugged drivers in 2010. The use of alprazolam (e.g., Xanax®) and hydrocodone by drugged drivers in fatal motor vehicle crashes also increased. In 2010, alprazolam, which is also a benzodiazepine, became the most commonly detected prescription drug used by drugged drivers. In 2010, 12.1% of detected prescription drugs were alprazolam followed by hydrocodone (11.1%), oxycodone (10.2%), and diazepam (8.4%).
Figure 4.
Trends in prescription drugs used by drugged drivers in motor vehicle crashes, as a percentage of all prescribed drugs tested, by drug and year: U.S., 1993–2010a

aData source: National Highway Traffic Safety Administration (US). FARS analytic reference guide 1975–2009. DOT HS 811 352. Washington: Department of Transportation (US); 2010.
DISCUSSION
The findings in our study show that the share of drugged drivers in fatal motor vehicle crashes who tested positive for cannabis reached 36.9% in 2010 (Figure 3). Our results indicate that drivers aged ≥50 years account for an increasing share of drugged drivers and for the highest proportion of prescription drug users. In fact, a study by the Substance Abuse and Mental Health Services Administration (SAMHSA) shows that the percentage of adults aged 50–59 years reporting illicit drug use more than doubled from 2002 to 2010, increasing from 3.4% to 7.2%. Also, consistent with our findings on gender differences, self-reported users of illicit drugs in the SAMHSA study were more likely to be male, with 11.2% of men vs. 6.8% of women reporting drug use.34
Our results suggest that the share of drugged drivers testing positive for prescription drugs in motor vehicle crashes increased during the last decade; more drivers involved in fatal crashes tested positive for prescription medications than for any other drug type. This trend is consistent with an increase in the number of drugs being prescribed per capita since the 1990s. The number of annual prescriptions dispensed in the U.S. nearly doubled from 1993 to 2009, reaching 3.9 billion. The average number of prescriptions dispensed annually per person increased 62% during the study period, from 7.8 per person in 1993 to 12.6 per person in 2010.35,36 Unfortunately, a comprehensive study has not been performed examining trends in dispensed prescriptions having side effects that would compromise driving ability. Given the increase in prescription drug use, more research on trends in specific cognitive-impairing prescription drugs is needed. Furthermore, many of these prescription drugs are abused; in fact, an estimated seven million people ≥12 years of age abuse prescription drugs in the U.S.37
Much of the total volume of prescriptions dispensed is concentrated in older age groups. For example, 90% of people ≥65 years of age vs. 58% of people younger than 65 years of age have prescription drug expenses.35 These percentages are consistent with our findings that an increasing portion of drugged drivers are older drivers, many of whom would be expected to take prescription medications. The New England Healthcare Institute estimates that poor medication adherence and suboptimal prescribing, drug administration, and diagnosis cost the U.S. economy nearly $300 billion annually.38 Crashes involving drugged drivers using prescription medications are expected to further increase these economic losses.
Benzodiazepines such as alprazolam account for the highest percentage of prescription drugs used by drugged drivers in fatal motor vehicle crashes, followed by hydrocodone and oxycodone. Several studies have linked the use of benzodiazepines to increased crash risk resulting from their side effects of dizziness and drowsiness.13,21–28,39 For example, one study showed that errors in maintaining lane position while driving increased 50% for drivers who were prescribed alprazolam vs. a placebo.24 Hydrocodone and oxycodone also impair critical thinking skills and increase drowsiness, and driving is not recommended for users of these medications.40
Our findings suggest that the profile of the average drugged driver has changed over time, and there are reasons to believe this trend will continue for several more years. First, much of this trend is driven by prescription medication use. As the U.S. population ages, both the number and potency of prescription medications will likely rise as the population's health-care needs increase. Pharmaceutical management will also increase in complexity, with a higher prevalence of comorbidities in the aging population, which will further increase problems with drug side effects and harmful interactions. In fact, our study results show a possible relationship between certain drugs and using multiple drugs and mixing alcohol with drugs. This finding is consistent with findings from Gjerde et al. showing substantially higher odds of fatal injury for drivers using two or more drugs and mixing drugs with alcohol.5 Results from another study on fatally injured drivers suggest that multidrug use and mixing drugs with alcohol are more likely to be associated with risky behaviors such as speeding and non-use of seatbelts.16 Although prescription medications are expected to have substantial positive benefits in increasing quality of life and longevity, patients may not fully appreciate that some side effects can seriously compromise driving ability. Furthermore, opportunities for prescription drug abuse will continue to increase as the number of prescriptions per capita increases with an aging population.
Second, a large fraction of drugged drivers involved in fatal crashes tested positive for cannabis. Unless policy makers address this issue, perhaps by increasing penalties for drugged driving in localities with greater accessibility to cannabis, the high incidence in drugged driver use of cannabis will likely continue. Currently, 18 states plus Washington, D.C., have legalized medical marijuana, and more state legislatures are considering similar policies.41 At the same time, current state drug policies may not be effective in addressing the threat of drugged driving on traffic safety. For example, a recent study by Anderson and Rees concluded that per se drugged driving laws have not been effective in decreasing traffic fatality rates in states implementing these laws.42
Policy makers should consider additional measures to increase primary prevention of drug use by drivers. For example, our study findings suggest that older drivers using drugs, including prescription medications, may be responsible for a growing share of road fatalities. Novel policies that examine the licensing of people who take multiple cognitive-impairing medications may be warranted in light of these findings. However, it may not be feasible and/or cost-effective to screen for medication use alongside a test for eyesight in a driver's licensing office. At a minimum, physicians should be encouraged to counsel their patients about the potential dangers of driving while taking cognitive-impairing medications. In addition, primary prevention of drugged driving may be enhanced with policies that increase affordable access to mass transit and other alternatives to driving, especially during the day, when our results suggest that a large fraction of fatal drugged-driving crashes occur.
Limitations
These results should be interpreted with the following limitations. First, these data relied on blood and/or urine testing of drivers suspected of drug use; as such, if law enforcement does not suspect drug use, cases of drugged driving will go unreported. In fact, Romano and Voas showed that only 12 states in 2005–2009 tested at least 80% of fatally injured drivers for drug use.16 For this reason, our analyses were restricted to drivers who tested positive for drugs. However, the likelihood of being tested by law enforcement may have -systematically changed for specific drugs (e.g., marijuana vs. cocaine) over time. In addition, there may have been variation in laboratory testing procedures over time and across jurisdictions and in the sensitivity and reliability of these procedures. Our results indicate that blood tests have become more prevalent and urine tests have become less prevalent in testing drugged drivers.
Second, FARS provides no information on the time elapsed between the motor vehicle crash and drug testing. For example, the U.S. Department of Transportation currently requires commercial drivers involved in a fatal motor vehicle crash to be tested within 32 hours for drugs.43 If the average delay between crash and testing was significant and systematically varied over time in the U.S., it may influence trends in the detection of certain drugs.
Finally, we cannot establish causality between taking certain drugs and involvement in a fatal motor vehicle crash. The pharmacological effects of certain medications (e.g., benzodiazepines) on driving have been studied, but there are no data in FARS concerning the degree of impairment a drugged driver may have experienced at the time of a crash. Thus, while our analysis documents the profile of drugged drivers in the U.S., we cannot make inferences as to the effect specific drugs have had on roadway safety.
CONCLUSIONS
Concurrent with trends in prescribing drugs, more drugged drivers involved in fatal crashes are testing positive for prescription medications in recent years. Prescription medications have provided—and will continue to provide—many positive benefits in both improving quality of life and extending the lives of patients. However, people driving under the influence of prescription drugs seem to represent an increasing share of drugged drivers involved in fatal collisions. This trend is expected to continue with the aging U.S. population and as reliance on pharmaceutical treatment increases. More emphasis on the negative consequences of improper drug use and on side effects that negatively impact driving skills may be warranted in patient-physician discussions regarding pharmaceutical treatment.
Footnotes
The Robert Wood Johnson Foundation's Public Health Law Research Program funded this work. This research was based on public-use secondary data files; therefore, institutional review board approval was not required.
REFERENCES
- 1.National Highway Traffic Safety Administration (US) Washington: Department of Transportation (US); 2011. Early estimate of motor vehicle traffic fatalities in 2010. Traffic Safety Facts DOT HS 811 451. [Google Scholar]
- 2.National Highway Traffic Safety Administration (US) Washington: Department of Transportation (US); 2012. Alcohol-impaired driving. Traffic Safety Facts DOT HS 811 606. [Google Scholar]
- 3.National Highway Traffic Safety Administration (US) Washington: Department of Transportation (US); 2010. Drug involvement of fatally injured drivers. Traffic Safety Facts DOT HS 811 415. [Google Scholar]
- 4.Bates MN, Blakely TA. Role of cannabis in motor vehicle crashes. Epidemiol Rev. 1999;21:222–32. doi: 10.1093/oxfordjournals.epirev.a017998. [DOI] [PubMed] [Google Scholar]
- 5.Gjerde H, Normann PT, Christophersen AS, Samuelsen SO, Mørland J. Alcohol, psychoactive drugs and fatal road traffic accidents in Norway: a case-control study. Accid Anal Prev. 2011;43:1197–203. doi: 10.1016/j.aap.2010.12.034. [DOI] [PubMed] [Google Scholar]
- 6.O'Kane CJ, Tutt DC, Bauer LA. Cannabis and driving: a new perspective. Emerg Med (Fremantle) 2002;14:296–303. [PubMed] [Google Scholar]
- 7.Kelly E, Darke S, Ross J. A review of drug use and driving: epidemiology, impairment, risk factors and risk perceptions. Drug Alcohol Rev. 2004;23:319–44. doi: 10.1080/09595230412331289482. [DOI] [PubMed] [Google Scholar]
- 8.Ramaekers JG, Berghaus G, van Laar M, Drummer OH. Dose related risk of motor vehicle crashes after cannabis use. Drug Alcohol Depend. 2004;73:109–19. doi: 10.1016/j.drugalcdep.2003.10.008. [DOI] [PubMed] [Google Scholar]
- 9.Lenné MG, Dietze PM, Triggs TJ, Walmsley S, Murphy B, Redman JR. The effects of cannabis and alcohol on simulated arterial driving: influences of driving experience and task demand. Accid Anal Prev. 2010;42:859–66. doi: 10.1016/j.aap.2009.04.021. [DOI] [PubMed] [Google Scholar]
- 10.Ronen A, Chassidim HS, Gershon P, Parmet Y, Rabinovich A, Bar-Hamburger R, et al. The effect of alcohol, THC and their combination on perceived effects, willingness to drive and performance of driving and non-driving tasks. Accid Anal Prev. 2010;42:1855–65. doi: 10.1016/j.aap.2010.05.006. [DOI] [PubMed] [Google Scholar]
- 11.Hels T, Lyckegaard A, Simonsen KW, Steentoft A, Bernhoft IM. Risk of severe driver injury by driving with psychoactive substances. Accid Anal Prev. 2013;59:346–56. doi: 10.1016/j.aap.2013.06.003. [DOI] [PubMed] [Google Scholar]
- 12.Verster JC, Pandi-Perumal SR, Ramaekers JG, de Gier JJ, editors. Drugs, driving and traffic safety. Basel (Switzerland): Birkhäuser; 2009. [Google Scholar]
- 13.Schulze H, Schumacher M, Urmeew R, Auerbach K. Bergisch Gladbach (Germany): Federal Highway Research Institute; 2012. [cited 2013 Jun 21]. DRUID final report: work performed, main results and recommendations. Also available from: URL: http://www.druid-project.eu/cln_031/nn_107548/Druid/EN/Dissemination/downloads__and__links/Final__Report,templateId=raw,property=publicationFile.pdf/Final_Report.pdf. [Google Scholar]
- 14.Logan BK, Couper FJ. Washington: Department of Transportation (US), National Highway Traffic Safety Administration; 2004. Drugs and human performance fact sheets. DOT HS 809 725. [Google Scholar]
- 15.Dussault C, Brault M, Bouchard J, Lemire AM. Pompidou Group, editor. Road traffic and psychoactive substances. Strasbourg (France): Council of Europe Publishing; 2004. The contribution of alcohol and other drugs among fatally injured drivers in Quebec: some preliminary results; pp. 215–23. [Google Scholar]
- 16.Romano E, Voas RB. Drug and alcohol involvement in four types of fatal crashes. J Stud Alcohol Drugs. 2011;72:567–76. doi: 10.15288/jsad.2011.72.567. [DOI] [PMC free article] [PubMed] [Google Scholar]
- 17.Brookoff D, Cook CS, Williams C, Mann CS. Testing reckless drivers for cocaine and marijuana. N Engl J Med. 1994;331:518–22. doi: 10.1056/NEJM199408253310807. [DOI] [PubMed] [Google Scholar]
- 18.Logan BK. Methamphetamine and driving impairment. J Forensic Sci. 1996;41:457–64. [PubMed] [Google Scholar]
- 19.Gustavsen I, Mørland J, Bramness JG. Impairment related to blood amphetamine and/or methamphetamine concentrations in suspected drugged drivers. Accid Anal Prev. 2006;38:490–5. doi: 10.1016/j.aap.2005.11.005. [DOI] [PubMed] [Google Scholar]
- 20.Ray WA, Fought RL, Decker MD. Psychoactive drugs and the risk of injurious motor vehicle crashes in elderly drivers. Am J Epidemiol. 1992;136:873–83. doi: 10.1093/aje/136.7.873. [DOI] [PubMed] [Google Scholar]
- 21.Neutel CI. Risk of traffic accident injury after a prescription for a benzodiazepine. Ann Epidemiol. 1995;5:239–44. doi: 10.1016/1047-2797(94)00112-7. [DOI] [PubMed] [Google Scholar]
- 22.Hemmelgarn B, Suissa S, Huang A, Boivin JF, Pinard G. Benzodiazepine use and the risk of motor vehicle crash in the elderly. JAMA. 1997;278:27–31. [PubMed] [Google Scholar]
- 23.Barbone F, McMahon AD, Davey PG, Morris AD, Reid IC, McDevitt DG, et al. Association of road-traffic accidents with benzodiazepine use. Lancet. 1998;352:1331–6. doi: 10.1016/s0140-6736(98)04087-2. [DOI] [PubMed] [Google Scholar]
- 24.Verster JC, Volkerts ER, Verbaten MN. Effects of alprazolam on driving ability, memory functioning and psychomotor performance: a randomized, placebo-controlled study. Neuropsychopharmacology. 2002;27:260–9. doi: 10.1016/S0893-133X(02)00310-X. [DOI] [PubMed] [Google Scholar]
- 25.Movig KL, Mathijssen MP, Nagel PH, van Egmond T, de Gier JJ, Leufkens HG, et al. Psychoactive substance use and the risk of motor vehicle accidents. Accid Anal Prev. 2004;36:631–6. doi: 10.1016/S0001-4575(03)00084-8. [DOI] [PubMed] [Google Scholar]
- 26.Engeland A, Skurtveit S, Mørland J. Risk of road traffic accidents associated with the prescription of drugs: a registry-based cohort study. Ann Epidemiol. 2007;17:597–602. doi: 10.1016/j.annepidem.2007.03.009. [DOI] [PubMed] [Google Scholar]
- 27.Orriols L, Philip P, Moore N, Castot A, Gadegbeku B, Delorme B, et al. Benzodiazepine-like hypnotics and the associated risk of road traffic accidents. Clin Pharmacol Ther. 2011;89:595–601. doi: 10.1038/clpt.2011.3. [DOI] [PubMed] [Google Scholar]
- 28.Rapoport MJ, Lanctôt KL, Streiner DL, Bédard M, Vingilis E, Murray B, et al. Benzodiazepine use and driving: a meta-analysis. J Clin Psychiatry. 2009;70:663–73. doi: 10.4088/JCP.08m04325. [DOI] [PubMed] [Google Scholar]
- 29.Vital signs: overdoses of prescription opioid pain relievers—United States, 1999–2008. MMWR Morb Mortal Wkly Rep. 2011;60(43):1487–92. [PubMed] [Google Scholar]
- 30.National Highway Traffic Safety Administration (US) Washington: Department of Transportation (US); 2010. FARS analytic reference guide 1975–2009. DOT HS 811 352. [Google Scholar]
- 31.Drug Enforcement Administration (US), Office of Diversion Control. Controlled substance schedules. [cited 2013 Jun 21]. Available from: URL: http://www.deadiversion.usdoj.gov/schedules/index.html.
- 32.Subramanian R. Washington: Department of Transportation (US); 2002. Transitioning to multiple imputation—a new method to estimate missing blood alcohol concentration (BAC) values in FARS. DOT HS 809 403. [Google Scholar]
- 33.StataCorp. Stata®: Release 12. College Station (TX): StataCorp; 2011. [Google Scholar]
- 34.Substance Abuse and Mental Health Services Administration (US) NSDUH Series H-41. Rockville (MD): SAMHSA; 2011. Results from the 2010 National Survey on Drug Use and Health: summary of national findings. [Google Scholar]
- 35.Kaiser Family Foundation. Prescription drug trends fact sheet—May 2010 update. [cited 2013 Jun 21]. Available from: URL: http://www.kff.org/rxdrugs/upload/3057-08.pdf.
- 36.National Institute for Health Care Management, Research and Educational Foundation. Washington: NIHCM; 2002. [cited 2013 Jun 21]. Prescription drug expenditures in 2001: another year of escalating costs. Also available from: URL: http://nihcm.org/pdf/spending2001.pdf. [Google Scholar]
- 37.Executive Office of the President (US), Office of National Drug Control Policy. A response to the epidemic of prescription drug abuse. [cited 2013 Jun 21]. Available from: URL: http://www.whitehouse.gov/sites/default/files/ondcp/Fact_Sheets/prescription-_drug_abuse_fact_sheet_4-25-11.pdf.
- 38.New England Healthcare Institute. Thinking outside the pillbox: a system-wide approach to improving patient medication adherence for chronic disease. 2009. [cited 2013 Jun 21]. Available from: URL: http://www.nehi.net/publications/17-thinking-outside-the-pillbox-a-system-wide-approach-to-improving-patient-medication-adherence-for-chronic-disease/view.
- 39.O'Hanlon JF, Haak TW, Blaauw GJ, Riemersma JB. Diazepam impairs lateral position control in highway driving. Science. 1982;217:79–81. doi: 10.1126/science.7089544. [DOI] [PubMed] [Google Scholar]
- 40.National Library of Medicine. Drugs and supplements. [cited 2013 Jun 21]. Available from: URL: http://www.ncbi.nlm.nih.gov/pubmedhealth/s/drugs_and_supplements.
- 41.National Conference of State Legislatures. State medical marijuana laws. [cited 2013 Jun 21]. Available from: URL: http://www.ncsl.org/issues-research/health/state-medical-marijuana-laws.aspx.
- 42.Anderson DM, Rees DI. Bonn (Germany): Institute for the Study of Labor; 2012. [cited 2013 Jun 21]. Per se drugged driving laws and traffic fatalities. Also available from: URL: http://ftp.iza.org/dp7048.pdf. [Google Scholar]
- 43.Department of Transportation (US), Federal Motor Carrier Safety Administration. Federal alcohol and drug testing requirements: information for motor carriers. [cited 2013 Jun 21]. Available from: URL: http://www.fmcsa.dot.gov/safety-security/safety-initiatives/drugs/drug-testing-guide.htm.