

ABSTRACT
The objective of the present study was to define a systematic approach to design and prepare solid dispersions of poorly water-soluble drug. The systematic approach can be defined in four phases. In the first phase, glass forming ability is assessed, and in the second phase, probable excipients are screened. The screened excipients are evaluated (third phase) for glass transition temperatures (Tg) and miscibility studies according to Florey–Huggins interaction parameter. The predicted excipients are used to prepare the solid dispersion and evaluated for Tg and any interactions using Fourier transfer infrared studies (fourth phase), and the findings are correlated with phase three predictions. For this investigation, cilostazol (CIL) was selected as model drug, which was classified as a poor glass former. As per the physical chemical properties of CIL, ten excipients, both polymeric and non-polymeric, were selected and screened. Out of these, povidone, copovidone, hypromellose and Eudragit EPO were found theoretically miscible with CIL. After going through phase 2 to phase 4, only povidone, copovidone and hypromellose were confirmed as polymer of choice for preparing the solid dispersion of CIL with a prediction of better physical solid-state stability on the basis of good miscibility between drug and carrier.
Key words: amorphous, cilostazol, glass transition temperature, miscibility, solid dispersions, solubility parameters
INTRODUCTION
In the last two decades, the use of high-throughput screening methodology generated a large number of new drug candidates with high permeability but poor aqueous solubility (1), generally classified as ‘class II’ as per biopharmaceutical classification systems (BCS) (2,3). However, the poor aqueous solubility and dissolution rate are the rate-limiting steps for absorption of such drug candidates due to which scientists in drug development strive for improving the product bioavailability. In order to increase the bioavailability of ‘class II’ drug candidates and thus the efficacy of the drugs, diverse approaches have been employed like particle size reduction (4), drug–polymer solid dispersion (SD) (amorphous systems) (5), lipid-based approaches such as SEDDs (6), use of surfactants and cyclodextrins (7) etc.
One of the most common approaches of increasing the rate of dissolution is by preparing amorphous systems or solid dispersions (8). Solid solutions represent the ideal category of solid dispersions wherein two or more components are in an amorphous single-phase system. In general, the concept of amorphous formulations into the mainstream of pharmaceutical research brings in two equally important aspects. On one hand, the amorphous state provides superior kinetic solubility, dissolution rate and hence improved bioavailability, and sometimes better compression characteristics and, on the other hand, amorphous solids are physically and chemically less stable than their crystalline counterparts. An amorphous state exhibits glass transition temperature (Tg), which is a temperature approximately 2/4 to 4/5 of the crystalline melting point measured in kelvin. Unlike the melting point, Tg is a kinetic parameter, depending on the scanning rate and thermal history (9). Amorphous state exhibits a sudden change in derived thermodynamic properties (e.g. enthalpy, entropy and free energy). However, the excess of enthalpy, entropy and free energy that confer the desirable property of high solubility often generates a strong possibility of its spontaneous conversion to the more stable crystalline state during processing, handling or storage conditions (10). To overcome the solid-state instability of pure amorphous compounds, the use of carrier to prepare solid dispersion was introduced (11) which can provide reasonable or good physical stability to the amorphous systems. The amorphous drug in solid dispersion has lower thermodynamic barrier to dissolution coupled with reduced particle size.
In general, three key concepts are utilized in designing the solid dispersions: firstly, generating the high energy amorphous from which lowers the energy barrier of drug dissolution; secondly, the drug present in amorphous polymer at molecular level provides extended surface area, which increases the dissolution of the drug and thirdly, incorporation of a functional excipient apart from drug and amorphous polymer matrix modifies the microenvironment at the dissolution front resulting in the enhancement of drug solubility. However, in the design and preparation of solid dispersions, principally inconsistent or skill-based approaches have been used. The approaches to predict the formation of solid dispersion discussed in literature are glass transition temperature, miscibility behaviour, solubility parameters, interaction parameters etc. (12–16). However, there is no systematic approach illustrated to design and prepare solid dispersions of class II drugs. Therefore, it appears a rational starting point to develop and define a systematic approach to design and prepare solid dispersions of class II drugs in order to enhance their dissolution rate and thus the bioavailability.
The objective of the present work was to define a systematic approach to design and prepare solid dispersions of poorly water-soluble drugs. For this, cilostazol (CIL) was selected as model drug. CIL, 6-[4-(1-cyclohexyl-1H-tetrazol-5-yl) butoxy]-3, 4-dihydro-2(1H)-quinolinone and several of its metabolites are inhibitors of phosphodiesterase III which suppresses platelet aggregation and also acts as a direct arterial vasodilator (17). The chemical structure of CIL is presented in Fig. 1. This drug is indicated for the treatment of intermittent claudication, approved in the USA and several European countries under the brand name Pletal® tablets, and is available in 50 and 100 mg strengths (18,19). CIL has a molecular weight of 369.47, and its melting point ranges from 432.4 to 433.3 K. It is classified as a class II drug as per the BCS. It is neutral molecule having an aqueous solubility of 3 μg/ml at 298 K, and its octanol–water distribution coefficients (log Poct) range from 2.72 (pH 2.0) to 2.76 (pH 11.0). In addition, the apparent permeability estimated by Caco-2 cell methodology is 1.92 × 10⁻⁵ cm/s for CIL.
Fig. 1.
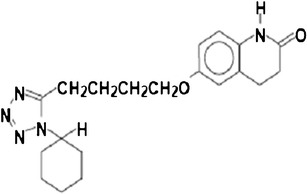
Structure of cilostazol
Being a class II drug, the absorption of CIL is dissolution rate dependent. The therapeutic applications of CIL are confined in pharmaceutical formulations due to its poor aqueous solubility and bioavailability (20–22). In case of CIL, there are very few reports for improving the solubility and dissolution. The only technique explored so far in this regard appears to be micronization (22–25). So far, three crystalline forms of CIL have been reported (A, B and C) where A is the most stable and others are metastable forms (26,27). Further, no work has been reported for amorphous system of CIL.
Hence, to define a systematic approach to design and prepare solid dispersions of poorly water-soluble drugs, an approach was developed and which can be divided into four phases (Fig. 2). In the first phase (assessment phase), the glass forming ability (GFA) was assessed because if the candidate itself has good glass forming ability, then the compound in amorphous from itself can be used in drug development and there should not be any requirement for preparation of solid dispersions. However, if the candidate is a poor glass former (as in case of CIL), then it has to go to the second phase. In the second phase (gross screening phase), based on the physicochemical properties of drug candidate, polymeric and non-polymeric excipients are selected and screened through solubility parameters (12–14). As an outcome, the excipients with high prediction of miscibility as per difference in solubility parameter are taken to next phase (third phase). In the third phase (evaluation of predictions), the selected excipients from second phase are further evaluated for glass transition temperatures (Tg) both theoretical and in situ in differential scanning calorimeter (DSC) (14,15) and miscibility studies according to Florey–Huggins (FH) interaction parameter (16,28,29). For the next phase, the fourth phase (confirmation of predictions), as an outcome to the third phase, the best excipients as per Tg and miscibility are taken up to prepare (ex situ) the solid dispersion (in different proportions) using solvent evaporation, spray drying, melt quenching, melt extrusion etc. at laboratory scale. The solid dispersions prepared are evaluated for actual Tg (using DSC) and physical–chemical interactions using Fourier transfer infrared (FTIR) studies (11,30). The outcome of these studies is correlated with the predictions of the third phase, and the decision is made to proceed further in drug development for actual preparation of solid dispersions with the selected excipient(s) and further characterizations and evaluations in particular physical solid-state stability (not a part of this research paper).
Fig. 2.
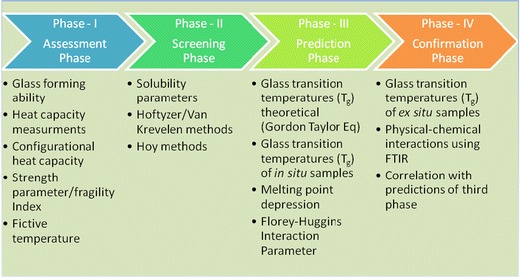
Systematic approach to design and prepare solid dispersions
MATERIAL AND METHODS
Materials
CIL was a kind gift from Daewoong Pharmaceuticals Co. (Hyderabad, India). Povidone (Plasdone K-29/32) and copovidone (Plasdone S-630) were provided by ISP Corporation, India. Hypromellose (HPMC; Methocel E5) and Eudragit EPO were purchased from Colorcon India and Evonik, India, respectively. All chemicals were of laboratory reagent grade. Calibration standards—indium and sapphire (TA Instruments, USA)—were used to calibrate the DSC and modulated temperature differential scanning calorimetry (MTDSC), respectively.
Thermogravimetric Analysis
Thermogravimetric analysis (TGA) was performed using TGA Q500 (TA Instruments, NJ, USA) in platinum pan at a heating rate of 10 K/min from 298 to 473 K under nitrogen purging (50 ml/min). The sample weight was about 2–3 mg. The data were analysed using Universal Analysis Software from TA Instruments, USA.
Differential Scanning Calorimetry
Conventional DSC and MTDSC experiments were performed using DSC Q200 (TA Instruments, NJ, USA) with a refrigerated cooling assembly (RCS) and a modulated capability. The DSC cell was purged with 50 ml/min dry nitrogen, and the RCS was purged with 150 ml/min nitrogen. The DSC cell was calibrated for baseline using empty pans of matched weight and for temperature using three temperature standards (cyclohexane, Tm = 279.54 K; indium, Tm = 429.61 K; tin, Tm = 504.93 K). About 3–5 mg of samples was exposed to the desired heating rates from the desired starting temperature to above the melting point of CIL under dry nitrogen purging (50 ml/min) in hermetically sealed aluminium pans. The data was analysed using Universal Analysis Software from TA Instruments, NJ, USA.
X-ray Powder Diffraction
The X-ray Powder Diffraction (pXRD) solid-state pattern of CIL was measured with D8 Advance (Bruker, USA) using an online recorder (PM 8203A) and LynxEye being the detector. Radiations were generated from CuKα source and filtered through Ni filters with a wavelength of 0.154 nm at generator current of 20 mA and voltage of 35 kV. The instrument was operated over the 2θ range of 2–50° at step size of 0.015°.
Scanning Electron Microscopy
Surface morphology was examined by JEOL JSM-6400 (Jeol Ltd., Tokyo, Japan) scanning electron microscope (SEM). The samples were coated with gold with using sputtering technique, and the gold-coated samples were viewed for surface topography in SEM at an acceleration voltage of 10 kV at ×150 and ×500 magnification.
Heat Capacity Measurements
To determine the heat capacity of amorphous and crystalline materials, MTDSC is cited as one of the most acceptable techniques (31). However, to avoid erroneous results, modulation parameters viz., heating rate, period and amplitude are very important. For this study, the modulation parameters viz., heating rate of 3 K/min, period of 60 s and the amplitude of 0.5 K were selected. Samples weighing about 3–5 mg were compressed into discs for the crystalline phase while the amorphous samples were prepared from the same crystalline sample in situ and were encapsulated in standard hermetically sealed aluminium pans. The sample and reference pan weights were matched to within 20 μg to minimize background heat capacities. Heat capacity measurement was done over a range of 293–323 K, encompassing the glass transition range of CIL. Heat capacity was calculated by deconvolution, using Universal Analysis Software from TA Instruments, NJ, USA. Each heat capacity measurement was done in triplicate. The arithmetic mean was used for calculations, and the percentage RSD was less than 5.
Solubility Parameter Calculations
The physical and chemical properties of components and their potential interaction play an important role in the preparation of composites. Such properties of individual component and composite can be easily estimated from knowledge of the solubility parameters (δ) measured in the units of MPa1/2. The solubility parameter is a measure of the cohesive energy density of the material and is an important parameter to understand the solubility tendency of one component into another component (32). For the present study, solubility parameters were calculated using Hoftyzer/Van Krevelen and Hoy methods (14).
In the Hoftyzer/Van Krevelen method, solubility parameters are calculated by the following equations:
 |
where δt is the total solubility parameter, δd is the contribution from dispersion forces, δp is the contribution from polar forces, δh is the contribution of hydrogen bonding, Fdi is the molar attraction constant due to dispersion component, Fpi is the molar attraction constant due to polar component, Ehi is the hydrogen bonding energy and V is the molar volume.
In the Hoy method, solubility parameters are calculated by the following equation
 |
where Ft is the molar attraction constant, V is the molar volume and B is the base, which is constant. For various groups, the values of Fdi, Fpi, Ehi, Ft and V are reported in literature (14). As an example, the calculations carried out for cilostazol are given in Tables I and II. For polymeric excipients, determination of the solubility parameter was based on the average molecular weight.
Table I.
Solubility Parameters by Hoftyzer and Van Krevelen Method
| No. of groups | Group | F di | F 2pi | E hi | V m |
|---|---|---|---|---|---|
| 11 | –CH2– | 2,970 | 0 | 0 | 180.07 |
| 1 | –CH< | 80 | 0 | 0 | 10.80 |
| 1 | =C< | 70 | 0 | 0 | 8.00 |
| 1 | >C=O | 290 | 592,900 | 2,000 | 18.50 |
| 4 | =N– | 80 | 2,560,000 | 20,000 | 16.00 |
| 1 | –NH– | 160 | 44,100 | 3,100 | 5.30 |
| 1 | –O– | 100 | 160,000 | 3,000 | 8.00 |
| 1 | Ph– | 1,270 | 12,100 | 0 | 69.00 |
| 2 | Ring | 380 | 0 | 0 | 0 |
| ∑ | 5,400 | 3,369,100 | 28,100 | 315.67 |
Table II.
Solubility Parameters by Hoy Method
| No. of groups | Group | vF t | V | n × F t | n × V |
|---|---|---|---|---|---|
| 11 | –CH2– | 269 | 15.55 | 2,959 | 171.05 |
| 1 | –CH< | 176 | 9.56 | 176 | 9.56 |
| 1 | =C< | 173 | 7.18 | 173 | 7.18 |
| 1 | >C=O | 538 | 17.3 | 538 | 17.3 |
| 4 | =N– | 125 | 12.6 | 500 | 50.4 |
| 1 | –NH– | 368 | 11.0 | 368 | 11.0 |
| 1 | –O– | 235 | 6.45 | 235 | 6.45 |
| 3 | CHar | 241 | 13.42 | 723 | 40.26 |
| 3 | Car | 201 | 7.42 | 603 | 22.26 |
| ∑ | 6,270 | 335.46 | |||
| Base (B) = 277 |
Preparation of Glassy CIL
Amorphous CIL was prepared by heating crystalline drug (3–5 mg) in DSC in a hermetically sealed aluminium pan to a temperature of 5 K above the melting point (433 K), held isothermally for 1 min and then immediately cooled to 223 K at 20 K/min. The high-performance liquid chromatography assay of the amorphous samples established that no degradation occurred during the preparation of amorphous form.
Preparation of Drug–Excipient/Polymer Binary Physical Mixtures
The binary physical mixtures were prepared by gently grinding accurately weighed quantities of drug and excipient/polymer using a mortar and pestle for 2 min. The physical mixtures were prepared in three different compositions as per the excipient/polymer content (20%, 50% and 80%).
Preparation of Solid Dispersions
The ex situ solid dispersions with polymer content of 20%, 50% and 80% of the composition were prepared by spray drying technology using a laboratory scale instrument (LU-228 Advanced spray drier, Labultima, Mumbai, India) equipped with a spray nozzle of 0.7 mm diameter and a peristaltic pump to feed the substrate. Solutions were sprayed using a feed rate of 2–5 g/min, at an atomization pressure of 0.8 bars, an inlet temperature of 403 K and an outlet temperature of 353 K. These parameters were maintained for the different dispersions. The drug and polymer were dissolved in dichloromethane (10%, w/w), after which the solvent was removed by spray drying.
Glass Transition Temperature
The glass transition temperature (Tg) of the binary system can be predicted by Gordon–Taylor (GT) equation (14) as per the following equation:
 |
where Tg is glass transition temperature, w1 and w2 are the weight fractions of components and K is calculated from the densities ρ and Tg of the respective components.
The Tg of the drug polymer compositions were predicted by GT equation for compositions containing 0%, 20%, 50%, 80% or 100% polymer. Also the Tg of the drug polymer solid dispersions (both in situ and ex situ) were determined experimentally by thermal analysis using DSC Q200 (TA Instruments, NJ, USA) with a RCS and a modulated capability. The DSC cell was purged with 50 ml/min dry nitrogen, and the RCS was purged with 150 ml/min nitrogen. The DSC cell was calibrated for baseline using empty pans of matched weight and for temperature using three temperature standards (cyclohexane, Tm = 279.54 K; indium, Tm = 429.61 K; tin, Tm = 504.93 K). For determining the Tg’s of the solid dispersion, two different regimens were used. The ex situ samples were equilibrated to 273 K and then heated at a rate of 10 K/min under dry nitrogen purging (50 ml/min) in hermetically sealed aluminium pans to 438 K. In the other regimen, samples were equilibrated at 273 K, heated at 20 K/min to 473 K, then cooled to 223 K at 80 K/min and again heated at 10 K/min to 438 K (heat–cool–heat cycle; in situ samples). All samples were run in duplicate. The data were analysed using Universal Analysis Software from TA Instruments, NJ, USA.
Florey–Huggins Interaction Parameter
To determine the FH interaction parameter (χ) for CIL and the respective polymer, melting point depression technique was adopted (16,28). To deduce the melting point depression, drug and polymer particles were sized (50–100 μm) using standard sieves and dried over phosphorus pentaoxide (P2O5) for at least 1 week. The drug and polymer physical mixtures were prepared as above. The melting temperature of CIL in the presence of polymer was deduced with a TA Q200 DSC equipped with a refrigerated cooling accessory (TA instruments, NJ, USA). Each sample (3–5 mg) was first heated to 393 K at the scan rate of 10°/min and then continued to 438 K at a scan rate of 1°/min (16) under dry nitrogen purging (50 ml/min). Each DSC scan was done in duplicate. The data were analysed using Universal Analysis Software from TA Instruments, USA. The offset of melting was taken as the extrapolated offset of the bulk melting endotherm. Average of the two scan was reported as the melting point. The DSC cell was calibrated for baseline using empty pans of matched weight and for temperature using three temperature standards (cyclohexane, Tm = 279.54 K; indium, Tm = 429.61 K; tin, Tm = 504.93 K). The melting point depression (physical mixture) deduced was used to calculate the FH interaction parameter as per the below equation (28),
 |
where Tm and T0m are the melting temperatures of the drug in drug/polymer physical mixtures and the pure drug, respectively; R is the gas constant; ∆H is the heat of fusion of the pure drug; ϕ is the volume fraction of the drug; m is the ratio of the volume of a polymer chain to that of a lattice site (defined here as the volume of a drug molecule) and χ is the drug–polymer interaction parameter. The following equation (33) is used to calculate the m, where Mw and ρ are the molecular weight and true density of the drug and polymer, respectively.
 |
FTIR Spectroscopy Studies
The neat drug, neat polymers and solid dispersions prepared ex situ were examined by FTIR spectroscopy using Perkin-Elmer [model: Spectrum 65 (C85069), UK] in diffused reflectance mode. Two to 3 mg of samples was thoroughly mixed, triturated with potassium bromide (100 mg) and placed in the sample holder. The samples were scanned from 4,000 to 450 cm−1. The recording conditions were resolution, 4.0; zero fitting, 2.0; sample scan, 16 and acquisition, single sided.
RESULTS AND DISCUSSION
Characterization CIL Received
The samples of CIL were characterized for thermal (DSC), FTIR, pXRD and SEM for assessing the amorphous or crystalline behaviour. As per the DSC, at a heating rate of 20 K/min, CIL exhibited a single-sharp fusion endotherm at 432.4 K (Fig. 3). The sharp fusion endotherm peak, the pXRD pattern (Fig. 4), FTIR spectra (Fig. 5) and SEM (Figs. 6 and 7) all proved that the sample of CIL received was crystalline and polymorphic form A (26,27).
Fig. 3.
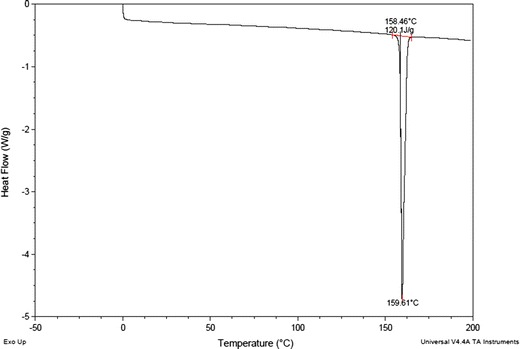
DSC thermogram of cilostazol
Fig. 4.
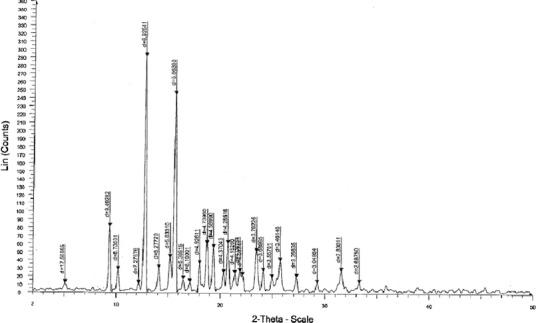
pXRD diffractogram of cilostazol
Fig. 5.
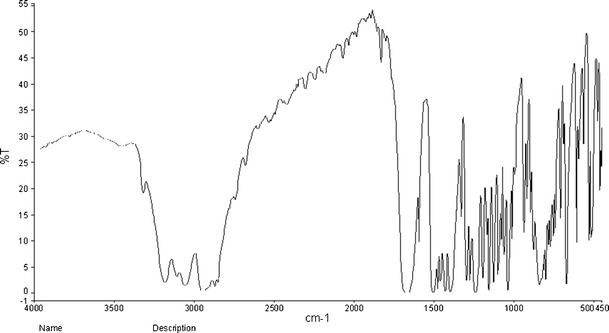
FTIR spectra of cilostazol
Fig. 6.
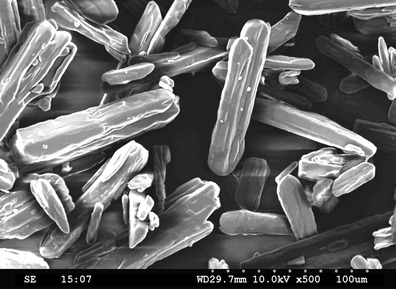
SEM of cilostazol ×500
Fig. 7.
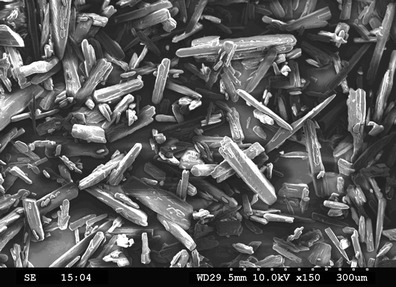
SEM of cilostazol ×150
Phase I (Assessment): Assessing the Glass Forming Ability of the Drug Compound
DSC Study of Crystalline and Amorphous CIL
The crystalline CIL showed a single-sharp endotherm corresponding to the melting of the crystalline form. The melting of the crystalline material starts at 431.5 K while a very sharp melting peak was observed at 432.4 K. As the melting peak was very sharp, 432.4 K was considered to be the melting point (Tm) of CIL for calculating the other thermodynamic parameters. By integrating the endothermic peak, enthalpy of fusion (∆Hm) was calculated, and using the melting point and enthalpy of fusion, the entropy of fusion (∆Sm = ∆Hm/Tm) was calculated. The amorphous CIL was prepared in situ in DSC by melt quenching method, which on reheating exhibited a glass transition event exhibiting a Tg of 305 K (±0.5 K). The Tg is also called as the critical molecular mobility region and is a very important parameter to assess the strong or fragile behaviour of a glassy material. The thermodynamic properties of the crystalline and amorphous forms are summarized in Table III.
Table III.
Thermodynamic Properties of Crystalline and Amorphous Cilostazol
| Thermodynamic property | Value |
|---|---|
| Melting temperature (T m) (K) | 432.4 |
| Enthalpy of fusion (∆H m) (kJ/mol) | 41.9 |
| Entropy of fusion (∆S m) (J/mol/K) | 96.9 |
| ∆S m/R | 11.7 |
| Glass transition temperature (T g) (K) | 305 |
| T m/T g | 1.42 |
| T g/T m | 0.71 |
Glass Forming Ability of CIL
The GFA is defined as the relative ability of compounds to form a glassy or amorphous state upon supercooling of the melt. Good glass formers are materials where the chances of germinating a crystal during cooling at normal rates are so small that crystallization does not take place. GFA is calculated as the ratio of Tg/Tm, where Tm is the melting temperature, and for an excellent glass former, this ratio is greater than 0.7 (34). CIL exhibited a Tg/Tm (305/432.4 K) of 0.71. Thus, CIL is a borderline case on the basis of Tg/Tm rule and is expected to have poor physical stability like other fragile molecules such as acetaminophen and trimethoprim (35) where Tg/Tm values are 0.67 and 0.70, respectively, as compared to good glass formers like Irbesartan (36), Cefuroxime Axetil (37) and Quinapril HCl (38), where Tg/Tm values are 0.75, 0.80 and 0.91, respectively.
Slade and Levine (39) proposed the ratio Tm/Tg as an indicator to compute the fragility of liquid. According to this rule, if the value of Tm/Tg is less than 1.5, it classified as strong glass behaviour, and if the value is more than 1.5, it reflects a fragile behaviour. As the Tm/Tg value for CIL is 1.42, it indicates a borderline case with going toward a fragile behaviour like other fragile molecules such as Acetaminophen (40) and Miconazole (41) where Tm/Tg values are 1.49 and 1.58, respectively, as compared to good glass formers like ritonavir (40), Cefuroxime Axetil (37) and Quinapril HCl (38) where Tm/Tg values are 1.22, 1.25 and 1.10, respectively. Hence, according to Tm/Tg or Tg/Tm rule, CIL shows a poor glass forming ability.
Heat Capacity Measurements
To study the amorphous state of a material, heat capacity is one of the important parameter which is derived using DSC. In comparison to conventional DSC, heat capacity measurements by MTDSC are faster and more accurate and precise. Also it needs less operator expertise and single sample run as compared to the three scans for conventional DSC. Further to this, MTDSC is the preferred tool to separate two thermodynamic events of glass transition and enthalpy relaxation occurring in tandem. Undoubtedly, this has unlocked multiple alternatives for exploring new and advanced possibilities of exploring of heat capacity the measurements in the arena of solid state. Therefore, MTDSC was used to measure the heat capacities of CIL, and a reheating scan was performed after the heat capacity measurement for ensuring that no crystallization event occurred during the heat capacity measurements. The different thermodynamic properties measured are captured in Table IV.
Table IV.
Heat Capacity and Related Parameters of Cilostazol
| Parameter | Value |
|---|---|
| Heat capacity jump (∆C p) (J/mol/K) | 139.7 |
| Configurational heat capacity (C confp) (J/mol/K) | 212.4 |
| γC p | 0.657 |
| K (kJ/mol) | 58.42 |
For the crystalline CIL, the values of heat capacity measured were very consistent across the temperature range studied. However, the amorphous phase exhibited an abrupt jump in heat capacity around the glass transition temperature which is indicative of a massive increase in molecular specific volume. The heat capacities are measured for both the crystalline and amorphous phases of CIL as shown in Fig. 8. In addition to the measurement of heat capacitates, for amorphous and crystalline states, the configurational heat capacity (Cconfp) is also used to study the thermodynamic properties. The Cconfp is determined by subtracting the heat capacity of the crystalline state from the heat capacity of the amorphous state. The Cconfp of CIL as a function of temperature is represented in Fig. 9.
Fig. 8.
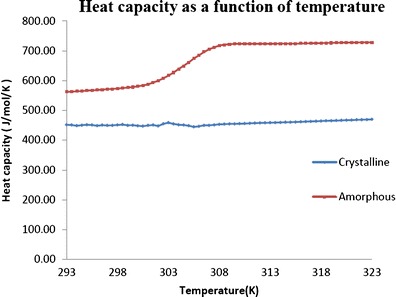
Heat capacity as a function of temperature for crystalline and amorphous cilostazol
Fig. 9.
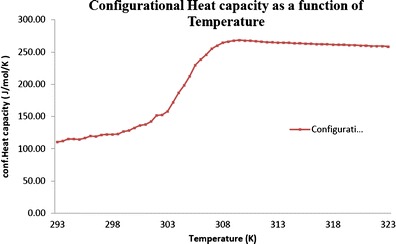
Configurational heat capacity of cilostazol
The jump in heat capacity at Tg is a very valuable property to assess the fragility of glasses. In general, the fragile materials exhibit a very high jump in heat capacity at Tg (even up to 80%) as compared to the strong glasses, which shows negligible jump (42). The higher ∆Cp values of amorphous state at Tg as compared to the crystalline state are indicative of increased molecular mobility may be because of additional degrees of freedom which can lead to non-directional, non-covalent interactions. Amorphous CIL exhibits a high jump (139.7 J/mol/ K) in heat capacity at Tg as compared to the crystalline state indicating it to be a fragile material. The heat capacities in term of γCp values are also used to assess the strong/fragile behaviour of the glassy material. In general, γCp falls between 0 and 1 for any material under consideration. A γCp value approaching 1 indicates strong glass behaviour while a γCp value approaching 0 indicates fragile behaviour. As the γCp value for CIL is 0.66, it indicates a moderately fragile behaviour as compared to good glass formers like Cefuroxime Axetil and Indomethacin (37), where the γCp values are 0.92 and 0.83, respectively.
Kauzmann and Fictive Temperatures
Kauzmann temperature (TK) is defined as the temperature region where the molecular mobility of the supercooled liquid becomes negligible even for long time scales of experiments (43,44). Also known as zero molecular mobility region, it is considered as a very important thermodynamic property, which helps to calculate the conservative maximum storage temperature for amorphous systems. However, as TK cannot be calculated by experiments directly, TK can be calculated by employing the mathematical methods based on Tg, Tm, Tg-50 rule, configurational entropy, enthalpy or heat capacity etc. (45). The Kauzmann temperature (TK) for CIL was calculated to be ranged between 215 and 275 K (Table V) indicating that in this temperature range, the probability of devitrification of amorphous CIL is insignificant. However, in the most conservative way, 215 K is upper limit of storage temperature to keep CIL in amorphous form for longer periods. It is fairly obvious that maintaining a storage temperature below 215 K is not desirable from commercial point of view and indirectly hints that CIL is a poor glass former.
Table V.
Calculated Kauzmann and Fictive Temperatures for Cilostazol
| Parameter | Value (K) |
|---|---|
| Kauzmann temperature (T K) based on T g-50 rule | 255.0 |
| Kauzmann temperature (T K) based on T g and T m | 215.2 |
| Kauzmann temperature (T K) based on configurational entropy | 260.2 |
| Kauzmann temperature (T K) based on configurational enthalpy | 223.1 |
| Kauzmann temperature (T K) based on configurational heat capacity | 275.0 |
| Fictive temperature (T f) at 298 K | 303.0 |
As compared to Kauzmann temperature, another important parameter used to study the dynamics of amorphous system is the fictive temperature (Tf). At fictive temperature, the hypothetical amorphous system has the same thermodynamic properties as that of the real amorphous system at experimental temperature (T). At fictive temperature, the system under investigation has the same thermodynamic properties as its equilibrium state at that temperature and time (46). Also, the Tf is not a fixed temperature; rather, it changes with the experimental temperature for a particular compound under investigation. However, Tf is unique in itself as compared to other thermodynamic parameters as it is independent of the DSC heating rate used to measure it. The practical utility of characterizing a glass in terms of its Tf is that it allows the molecular mobility to be estimated from excess enthalpy or entropy present in a glass (47). The Tf values of amorphous CIL were determined for the temperature range encompassing the TK and Tg (Fig. 10). A fictive temperature of 303 K for CIL at ambient storage temperature (298 K) is very close to the Tg and gives strong indication for crystallization at ambient storage temperature. Again this parameter also points for a fragile behaviour for CIL.
Fig. 10.
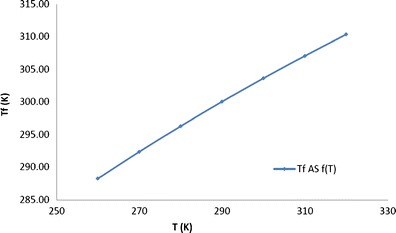
Fictive temperature as a function of temperature
Fragility of Amorphous CIL
The idea of fragility was first reported by Angell (48) by plotting the structural relaxation time (τ) against Tg/T (Angell’s plot). Based on this concept, the materials were classified as strong and fragile liquids based on the magnitude of change in configurational heat capacity at Tg or the differences in temperature dependence of mean molecular relaxation time (τ). While strong liquids demonstrate an Arrhenius type of relationship, i.e., temperature-independent activation energy, fragile liquids exhibit temperature-dependent activation energy (a deviation from Arrhenius behaviour). Based on the different ways of calculating the fragility of amorphous phase, parameters like strength parameter, fragility index, Tg − TK etc. were calculated for CIL (Table VI).
Table VI.
Fragility Parameters of Cilostazol
| Fragility parameter | Value |
|---|---|
| Strength parameter (D) | 4.0 |
| Fragility index (m) | 162.6 |
| T g − T K | 30.0 |
| T K/T g | 0.90 |
Strength Parameter
The strength parameter (D) obtained from the VTF equation (49) is commonly used to calculate D values for describing the fragility of the substance under consideration as per the below expression:
 |
where τ0, D and T0 are constants, τ0 represents the time scale of vibrational motions, D represents strength parameter and T0 denotes the T at which τ0 becomes infinite, indicative of negligible molecular mobility. In general, D parameter describes the deviation from the Arrhenius behaviour, with strong systems featuring D > 25 and fragile systems D < 10. Crowley and Zografi have demonstrated that several pharmaceutical glass formers give D parameters in the range of 7–15 indicating their moderate fragility (50). The D value calculated for CIL using VTF equation comes out to 4.0, which indicates a fragile behaviour like Rofecoxib and Valdecoxib (45) where the D values are 4.0 and 6.5, respectively, as compared to moderately fragile Celecoxib (36) where the D value is 11.5 and good glass formers like Salsalate and Tolbutamide (37) where the D values are 21.3 and 17.5, respectively.
Fragility Index
On the contrary, to the strength parameter, the steepness parameter or the fragility index (m) is calculated by the following expression to describe the fragility of the substance:
 |
In general, a larger m value represents a fragile behaviour while a small m value indicates a strong behaviour; specifically strong systems feature m < 40 and fragile systems m > 75. The m value of 162.6 indicates a fragile behaviour for CIL like Rofecoxib (45), Griseofulvin (37) and Acetaminophen (40) where the m values are, respectively, 162.0, 81.7 and 79.5 as compared to moderately fragile Celecoxib (35) where the m value is 67.0 and good glass formers like Cefuroxime Axetil, Temazepam (51) and Salsalate (37) where the m values are 57.7, 52.8 and 43.7, respectively. Hence, both strength parameter and fragility index postulated as fragile behaviour for amorphous CIL.
Tg − TK Rule
As per Hodge (52), the fragility of a compound can be numerically assigned by the Tg − TK rule, which is based on the positioning of TK with respect to Tg. Given that the fragility of a liquid dictates the steepness of the viscosity/mean molecular relaxation time (τ) fall near Tg, TK gets more close to Tg in more fragile liquid. A value of Tg − TK < 50 indicates a fragile glass former, while Tg − TK > 50 is indicative of strong glass behaviour as the Tg − TK value for CIL is 30, which indicates a fragile behaviour like Rofecoxib (45) where the Tg − TK value is 32.4 as compared to good glass formers like Valdecoxib (45), Temazepam (51) and Griseofulvin (53) where the Tg − TK value is 49.3, 100.0 and 92.0, respectively. Based on the above assessments, CIL was designated a poor glass former and was taken to the next phase to design the solid dispersions.
Phase II (Gross Screening and Prediction): Screening Using Solubility Parameters
Solubility Parameter Calculations
In general, solubility parameters (δ) are the most common tools available to predict the interaction of two or more materials in a binary mixtures or multi-component formulations and have been successfully used to screen different compositions for preparing solid dispersion (12,32,54). Greenhalgh et al. reported (13) that the energy of mixing released by interactions within the components is balanced by the energy released by interaction between the components. Therefore, the individual components with similar values for δ are likely to be miscible. As rule of thumb, if the difference between the solubility parameters of excipients and drugs (∆δ) is less than 7 MPa1/2, then the components under investigation are very likely to be miscible, while a ∆δ of more than 7 MPa1/2 indicates the immiscible behaviour of the components (14).
Since CIL exhibits an average δ value of 20.0 MPa1/2, it can be predicted that an excipient with a δ value more than less than 14.0 MPa1/2 and less than 27.0 MPa1/2 is likely to be immiscible. From the results summarised in Table VII, the excipients in this study can be easily grouped into two broad classes of miscible and immiscible based on the difference in solubility parameters. On one hand, povidone, copovidone, hypromellose and Eudragit EPO are the likely miscible excipients; on the other hand, lactose, mannitol, polyvinyl alcohol and sucrose are immiscible excipients. Citric acid with a ∆δ value of 7.7 MPa1/2 can be considered a borderline case. Therefore, based on the difference in solubility parameters (∆δ), only four excipients, namely povidone, copovidone, hypromellose and Eudragit EPO, were selected for the next phase evaluation.
Table VII.
Solubility Parameters of Drug and Excipients
| Drug and excipients | Solubility parameter (δ) (MPa1/2) | Group classification | |||
|---|---|---|---|---|---|
| Hoftyzer and Van Krevelen method | Hoy method | Average | ∆δ | ||
| Cilostazol | 20.4 | 19.5 | 20.0 | NA | Not applicable |
| Povidone | 22.4 | 20.7 | 21.6 | 1.6 | Miscible |
| Copovidone | 21.5 | 20.6 | 21.1 | 1.1 | Miscible |
| Hypromellose | 19.9 | 24.5 | 22.2 | 2.2 | Miscible |
| Eudragit EPO | 20.6 | 19.7 | 20.2 | 0.2 | Miscible |
| Citric acid | 29.4 | 25.9 | 27.7 | 7.7 | Borderline |
| Lactose monohydrate | 35.7 | 33.0 | 34.4 | 14.4 | Immiscible |
| Polyvinyl alcohol | 31.7 | 30.3 | 31.0 | 11.0 | Immiscible |
| Sucrose | 36.0 | 33.5 | 34.8 | 14.8 | Immiscible |
| Mannitol | 39.1 | 38.7 | 38.9 | 18.9 | Immiscible |
Phase III (Evaluation of Predictions): Using Tg and Florey–Huggins Interaction Parameter
Glass Transition Temperature (Tg)
The glass transition temperature is the most distinguishing attribute of all amorphous materials, including drugs, polymers and polymer-based composites. The estimation of Tg is one of the most widely used and established successful tool to evaluate miscibility in binary or multiple mixtures or blends. DSC is the most commonly employed technique to assess the number of amorphous phases existing in systems containing more than one component. The presence of a single Tg for the system under consideration is inferred as the existence of a single amorphous phase mixed ‘at the molecular level’. Conversely, the presence of more than one Tg is indicative of the presence of more than one amorphous phase (15).
For a binary mixture, the extent to which the Tg will change depends on the balance between the loss of elastic energy and the gain in free energy due to solubilization small drug molecule in high molecular weight polymer. Generally, the small drug molecules lower the Tg of the system by allowing the polymer chain segments to have greater freedom. This phenomenon is called a plasticization, and the small drug molecule is called a plasticizer. However, there are some exception to this phenomenon also, where Tg of the system can be higher than the either of the pure component. This can happen because of the strong intermolecular interactions between drug and polymer which decrease the free volume of the polymer. This phenomenon is called an anti-plasticization effect (55).
On the basis of the solubility parameter calculations, the four miscible excipients, i.e. povidone, copovidone, hypromellose and Eudragit EPO (all polymers), were taken up further to study their miscibility with CIL by glass transition temperature approach. Crystalline CIL melted at 160°C and amorphous CIL produced by heat quenching (in situ in DSC) showed Tg at 305 K (Table VIII). The polymers povidone, copovidone, hypromellose and Eudragit EPO are amorphous in nature and exhibited a Tg at 435, 382, 428 and 318 K, respectively.
Table VIII.
Glass Transition Temperatures
| Formulation | Polymer content (%) | Glass transition temperature (T g) (°C) | ||
|---|---|---|---|---|
| –a | –b | –c | ||
| Cilostazol | 0 | NA | 32.0 | NA |
| Povidone | 100 | NA | 178.0 | NA |
| Cilostazol/povidone | 80 | 93.1 | 105.4 | 101.2 |
| 50 | 54.3 | 66.8 | 62.1 | |
| 20 | 38.3 | 38.8 | 39.0 | |
| Copovidone | 100 | NA | 110.0 | NA |
| Cilostazol/copovidone | 80 | 75.6 | 75.7 | 76.1 |
| 50 | 50.7 | 50.5 | 52.5 | |
| 20 | 37.7 | 38.6 | 38.2 | |
| HPMC E5 | 100 | NA | 155.0 | NA |
| Cilostazol/HPMC | 80 | 86.7 | 66.7 | 65.8 |
| 50 | 52.5 | 33.9 | 34.9 | |
| 20 | 37.7 | 33.5 | 32.4 | |
| Eudragit EPO | 100 | NA | 45.1 | NA |
| Cilostazol/Eudragit EPO | 80 | 42.7 | 32.2 | ND |
| 50 | 38.3 | 32.5 | ND | |
| 20 | 34.8 | 32.8 | ND | |
HPMC hypromellose, ND not done, NA not applicable
aGT equation
bDSC of in situ solid dispersion
cDSC of ex situ solid dispersion
Binary Mixtures of CIL/PVP and CIL/Copovidone
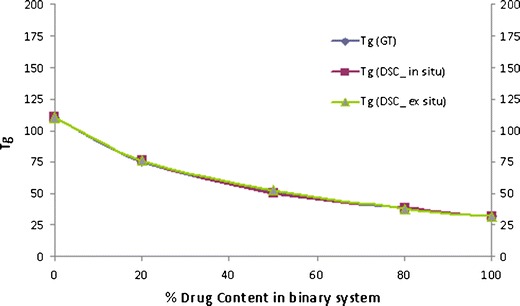
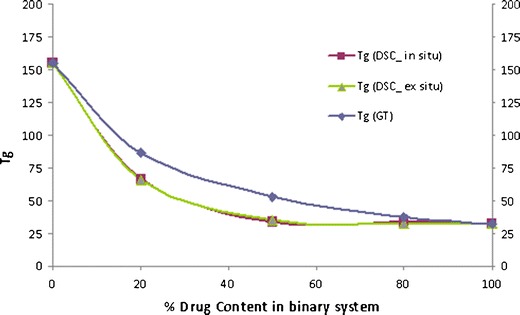
The three ratio (20%, 50% and 80% of polymer) studied for the binary mixtures of CIL with PVP and copovidone exhibited a single Tg and was between the Tg of the drug and the polymer, indicating miscibility of drug and respective polymer, and plasticization effect of CIL on PVP and copovidone. However, the Tg value of the in situ sample of CIL and PVP was higher than expected (Fig. 11) as per the Gordon–Taylor equation (positive deviation), and the deviation was higher with higher amount of polymer in the binary mixture. This may be due to some interaction between the drug and polymer. And it will be interesting to observe this in the FTIR spectra of this combination. Further, as compared to PVP, the Tg of in situ samples of CIL and copovidone did not illustrate any deviation (Fig. 12) to the Gordon–Taylor equation.
Fig. 11.
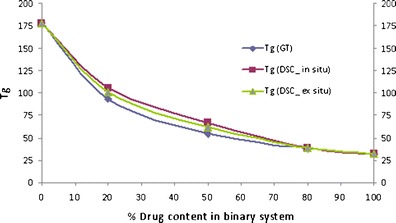
Phase diagram of cilostazol/PVP
Fig. 12.
Phase diagram of cilostazol/copovidone
Binary Mixtures of CIL/HPMC
The three ratio (20%, 50% and 80% of polymer) studied for the binary mixtures of CIL with HPMC exhibited a single Tg and was between the Tg of the drug and the polymer, indicating miscibility of drug and polymer, and plasticization effect of CIL on HPMC. However, the Tg value of the in situ sample of CIL and HPMC was lower than expected (Fig. 13) as per the Gordon–Taylor equation (negative deviation), and the deviation was higher with higher amount of polymer in the binary mixture. Again like PVP, further understanding will come after evaluating the Tg of ex situ samples and their respective FTIR spectra in next phase.
Fig. 13.
Phase diagram of cilostazol/HPMC
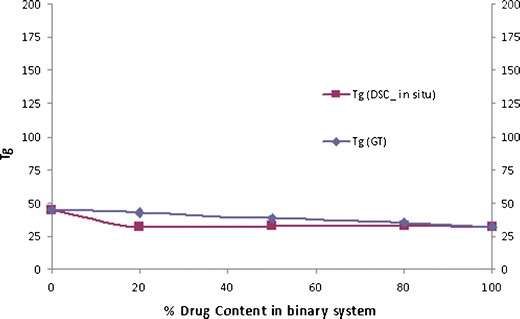
Binary Mixtures of CIL/EPO
Even with EPO also, the three ratio (20%, 50% and 80% of polymer) studied exhibited a single Tg; however, the values were just near to the Tg of CIL itself. Further, the Tg value of the in situ sample of CIL and EPO was not significantly different than expected (Fig. 14) as per the Gordon–Taylor equation. This odd behaviour needs further evaluations and as per Tg of the in situ samples may not provide sufficient physical stability even at 80% polymer concentration. Hence, EPO was not attempted further as part of this investigation.
Fig. 14.
Phase diagram of cilostazol/EPO
Therefore, based on the Tg evaluations of the binary mixtures and comparison to the Tg derived from the Gordon–Taylor equation, it was apparent that CIL illustrated complete miscibility with all the polymers studies in given ratios and hence can be predicted to form one phase amorphous system with these polymers. Further, it will be interesting to see the FTIR analysis of ex situ samples of CIL with PVP and HPMC where positive and negative deviations, respectively, were observed. Even though with EPO also CIL exhibited a single Tg, still the values of Tg were not significantly different than the drug itself. Therefore, this combination was not attempted further as part of this investigation.
Florey–Huggins Interaction Parameter
The polymer–polymer miscibility has been well understood using the lattice-based FH theory. As per the FH theory, the free energy of mixing can be divided into two parts, an entropy part that always favours mixing and the other the enthalpy part that can either facilitate or prevent mixing, depending on the nature and intensity of the interaction between the two components (33). Also, recently the same FH theory application was used for assessing the miscibility of drug and polymers (16), wherein the miscibility of drugs was evaluated with polymers using the melting point depression approach to calculate the FH interaction factor (χ) with modified FH equation by Nishi–Wang (56), rearranged as below.
 |
The slope of left-hand side of the above equation against (1 − ϕ)2 provides the value of FH interaction parameter (χ). In the present investigation, we have used this method of melting point depression (Fig. 15) and using the rearranged Nishi–Wang equation to determine the interaction parameters to assess the miscibility of CIL in povidone, copovidone and HPMC. As per the results, the interaction parameters between CIL and povidone, CIL and copovidone, and CIL and HPMC are −0.476, −0.313 and −0.135, respectively (Figs. 16, 17 and 18). Apart from the initial and depressed melting point of CIL at different polymer contents of the mixture, the following values of the constants were used in calculations of interaction parameter (Table IX): ΔH = 44,373.347 J/mol, R = 8.321 J/K/mol, MCIL = 369.47 g/mol, ρCIL = 1.26 g/cc, MPVP = 50,000 g/mol, ρPVP = 1.16 g/cc, Mcopovidone = 50,000, ρcopovidone = 1.16 g/cc, MHPMC = 14,637 g/mol and ρHPMC = 1.30 g/cc. As per the FH theory, at a given temperature, complete, partial or zero miscibility can be find with interaction parameter of >0 (very poor miscibility), ~0 (poor miscibility) or <0 (strong miscibility) (16,29,56). A negative interaction parameter between two components (here drug and polymer) represents stronger than average attractions between drug–polymer system as compared to individual drug–drug system to polymer–polymer system. Hence, in this situation, drug molecules prefer to be in contact with polymer segments than with other drug molecules. Further, the value becomes more negative when these interactions are much stronger. On the contrary, a positive interaction parameter represents where the drug molecules prefer to be in the neighbourhood of drug molecules, while the polymer molecules prefer to be in the neighbourhood of polymer molecules rather than mixing with each other.
Fig. 15.
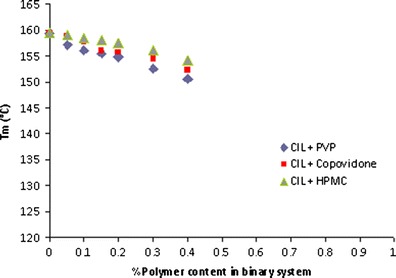
Melting point depressions of cilostazol with PVP, copovidone and HPMC
Fig. 16.
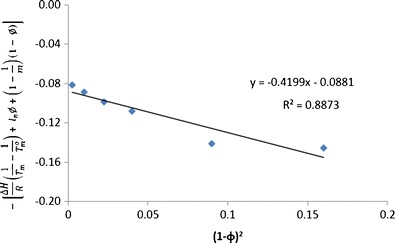
Flory–Huggins interaction parameter of cilostazol with PVP
Fig. 17.
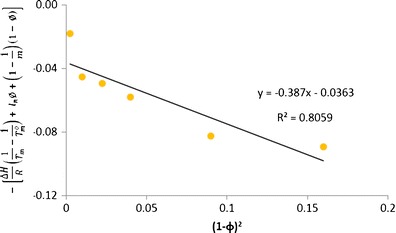
Flory–Huggins interaction parameter of cilostazol with copovidone
Fig. 18.
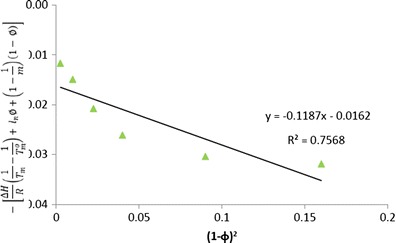
Flory–Huggins interaction parameter of cilostazol with HPMC
Table IX.
Important Properties Used to Calculate Glass Transition Temperature and Interaction Parameter
| Material | Molecular weight (g/mol) | Molecular volume (cc/mol) | True density (g/cc)a | Melting point (K) | T g (K) |
|---|---|---|---|---|---|
| Cilostazol | 369.47 | 293.23 | 1.26 | 432.4 | 305.0 |
| Povidone | 50,000 | 43,103.45 | 1.16 | 433.0 | 451.0 |
| Copovidone | 50,000 | 43,103.45 | 1.16 | 413.0 | 383.0 |
| HPMC | 14,637 | 11,259.23 | 1.30 | 473.0 | 428.0 |
| Eudragit EPO | 150,000 | 145,631.07 | 1.03 | NA | 318.1 |
HPMC hypromellose
aDetermined by helium pycnometer
As reported above in the present study, the negative interaction parameters for all the three polymers used indicated a good miscibility prediction between CIL and these polymers. And this understanding corresponds to the negative values (interaction parameter) reported between drug–polymer, e.g. Nifedipine, Indomethacin, Felodipine and Ketoconazole with PVP (16) and similarly between polymer–polymer (PLLA/EVA85) system (57).
Phase IV (Confirmation of Predictions): Using Tg and FTIR Analysis of Ex Situ Samples
Glass Transition Temperature (Tg)
The ex situ samples of CIL and three polymers (PVP, copovidone and HPMC) prepared in three different ratios (20%, 50% and 80% of polymer content) by spray drying technique exhibited a single Tg as observed for the in situ samples confirming the miscibility of CIL with these screened and predicted polymers. Also the positive and negative deviations to the Gordon–Taylor equation for povidone and HPMC, respectively, were observed with ex situ samples as well (Table VIII).
Even though the theoretical equations like Gordon–Taylor equation works really well to predict the Tg of multi-component amorphous system, however, these equations do not take into account the factor of ‘entropy of mixing’, which is very critical to the formation of glass (58). The entropy of mixing is inevitably a factor that affects the glass transition behaviour of glass forming mixtures, therefore on the basis of entropy gained through mixing can shift the glass transition temperature of the mixture. In case of strongly interacting components (negative entropy of mixing), the entropy of mixing is expected to show positive deviation from the theoretically predicted Tg as observed in case of CIL/PVP solid dispersions, while for weakly interacting components, the positive entropy of mixing leads to lower shift for the theoretically predicted Tg as observed in case of CIL/HPMC solid dispersions (55). However, the weak or strong interactions for CIL/HPMC and CIL/PVP, respectively, need to be gauged through FTIR analysis of these solid dispersions.
FTIR Analysis
To investigate the potential interactions between CIL and respective polymer used to prepare the SD, FTIR analysis of CIL, individual polymer and respective solid dispersion was performed. To understand for specific interactions between CIL and respective polymer, the FTIR spectra of CIL, polymer and solid dispersion prepared with that polymer were overlaid and compared to the individual spectra versus the solid dispersion spectra and the understating for the probable interactions discussed below for specific CIL/polymer combination.
The FTIR spectra of pure CIL (Fig. 5) represent six specific characteristic peaks as compiled in Table X, well correlated with the already reported for CIL (59). In particular, the aliphatic C=O stretching and N–H stretching of quinolinone can be good hydrogen bonding sites.
Table X.
FTIR Analysis of Cilostazol
| S. No. | Wavenumber (cm−1) | Assignment |
|---|---|---|
| 1 | 2,870 to 3,310 | Aromatic and aliphatic C–H stretching |
| 2 | 1,760 | C=N stretching of tetrazole |
| 3 | 3,315 | N–H stretching of quinolinone |
| 4 | 1,690 | N=N stretching of tetrazole |
| 5 | 1,830 | Aliphatic C=O stretching band |
| 6 | 1,500 | Aromatic C=C stretching band |
Solid Dispersions of CIL/PVP
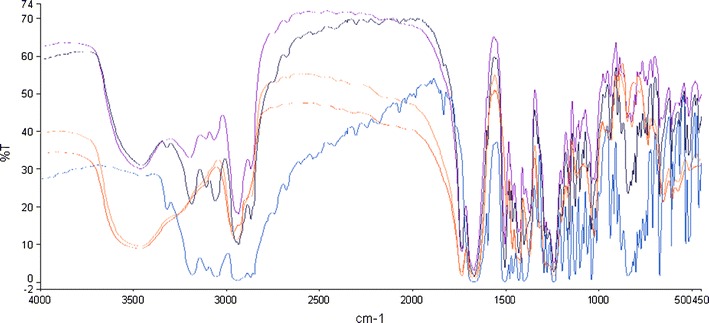
The FTIR spectrum of CIL has very sharp peaks summarised in Table X, particularly for the specific six characteristic peaks. However, the spectra of the spray-dried CIL/PVP solid dispersions (Fig. 19) are to some extent different to those of the pure CIL and pure polymer as the peaks are more obtuse and furthermore slightly shifted. As the CIL peak at 3,315 cm−1 (N–H stretching) is totally absent in all the SDs (at all concentrations of polymer), strong hydrogen bonding is hypothesized between the N–H bond of CIL and C=O of povidone (30). Also the peaks at 2,870–3,310 cm−1 became very broad and in particular with SDs having more than 50% of polymer, indicating weaker interactions. Also the aliphatic C=O stretching band at 1,830 cm−1 for CIL got totally eliminated from the spectra of SDs (at all concentrations of polymer), indicating strong hydrogen bonding because the C=O group of CIL can act as a hydrogen bond acceptor and aliphatic –CH group of povidone can act as hydrogen bond donor (11). However, any interactions below 1,500 cm−1 could not be inferred because of the crowded spectra, and also, there is no significant variations between individual and SDs spectra. The particular strong hydrogen bonding interactions observed in CIL/PVP solid dispersion correlate with the positive deviations observed in Tg against the predicted from Gordon–Taylor equation.
Fig. 19.
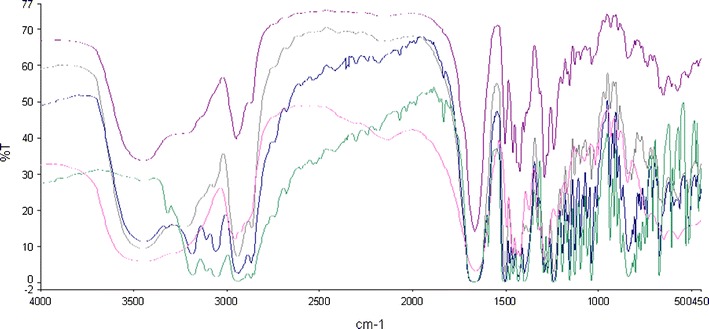
FTIR spectra of cilostazol/PVP. From top to bottom: SD (1:4), SD (1:1), SD (4:1), pure povidone and pure CIL
Solid Dispersions of CIL/Copovidone
The spectra of the spray-dried CIL/copovidone solid dispersions (Fig. 20) are to some extent different to those of the pure CIL and pure polymer as the peaks are more obtuse and furthermore slightly shifted, a behaviour observed in the SDs of CIL/PVP, and it is obvious because of the similarities in the structure and properties of PVP and copovidone. The intensity of CIL peak at 3,315 cm−1 (N–H stretching) is reduced in all the CIL/copovidone SDs, the most prominent reduction in SD with the highest part of polymer, indicating a very weak hydrogen bonding between the N–H bond of CIL and C=O of copovidone (contribution of povidone fraction; copovidone is combination polymer of povidone and vinyl acetate in 3:2 proportions). Also the peaks at 2,870–3,310 cm−1 are broad only in case of SD having 80% of polymer, indicating weaker interactions. Further, the aliphatic C=O stretching band at 1,830 cm−1 for CIL got totally eliminated from the spectra of SD with 80% polymer contribution, while the peak got reduced to a good extent for SDs with 20% and 50% polymer contribution, indicating weaker hydrogen bonding because the C=O group of CIL. However, any interactions below 1,500 cm−1 could not be inferred because of the crowded spectra, and also there is no significant variation for peak intensities and sharpness between individual and SD spectra. Hence, for copovidone-based SDs, the overall interactions were weak to medium and that may not have contributed much to the enthalpy of mixing and therefore did not show any significant deviation to the Tg predicted from Gordon–Taylor equation.
Fig. 20.
FTIR spectra of cilostazol/copovidone. From top to bottom: SD (1:4), SD (1:1), SD (4:1), pure copovidone and pure CIL
Solid Dispersions of CIL/HPMC
The spectra of the spray-dried CIL/HPMC solid dispersions (with all different polymer contents) were not significantly different to those of the pure CIL and pure polymer (Fig. 21) as the peaks are present in similar manner; however, some of the sharpness is little reduced and some got slightly shifted, a contrast behaviour to the one observed in case of the SDs of CIL/PVP and CIL/copovidone, and it is quite obvious because of the difference in the structure and properties of HPMC versus PVP/copovidone. The intensity of CIL peak at 3,315 cm−1 (N–H stretching) was slightly reduced only in SD with the highest part of polymer, indicating a very weak or no hydrogen bonding between the N–H bonds of CIL (11,30). This may be due to non-availability of free hydrogen bond acceptor from HPMC. Also the peaks at 2,870–3,310 cm−1 became shorter and got shifted toward lower wave numbers only in case of SD having 50% and 80% of polymer, indicating weak interactions. Further, the aliphatic C=O stretching band intensity at 1,830 cm−1 for CIL got reduced for the SDs with 20% and 50% polymer contribution, while the peak got almost eliminated for SD with 80% polymer contribution, indicating probability of weak to medium hydrogen bonding because the C=O group of CIL and C–H bonds form HPMC. However, like the previous interpretations of CIL/PVP and CIL/copovidone, any interactions below 1,500 cm−1 could not be inferred because of the crowded spectra, and also there is no significant variation for peak intensities and sharpness between individual and SD spectra. Hence, for HPMC-based SDs, the overall interactions were weak and that may not have contributed much to the enthalpy of mixing and therefore did not show any significant deviation to the Tg predicted from Gordon–Taylor equation.
Fig. 21.
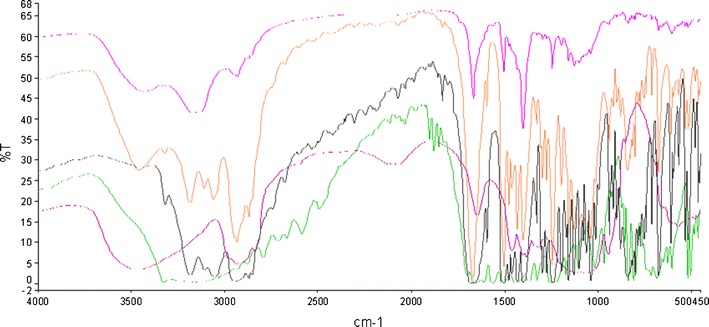
FTIR spectra of cilostazol/HPMC. From top to bottom: SD (1:4), SD (1:1), SD (4:1), pure hypromellose and pure CIL
Therefore, based on the glass transition temperatures of ex situ samples, it can be deduced that the three polymers (PVP, copovidone and HPMC) are miscible with CIL. However, as per FTIR analysis, SDs with povidone and copovidone are interacting better with the CIL as compared to HPMC, which will be important from the physical stability point of view. Hence, these three polymers (still more preferably PVP and copovidone) are the leads to prepare the solid dispersions and should be evaluated further for physical stability of the solid dispersions and relevant studies from development perspective.
CONCLUSIONS
In the present investigation, a systematic approach was defined to design and prepare solid dispersion of a poorly water-soluble drug. CIL was selected as the model drug to develop this approach. The systematic approach was divided into four phases. In the first phase, CIL was assessed for its glass forming ability. Based on the glass transition temperature, heat capacity measurements and fragility index, CIL was assigned to be a poor glass former. In the second phase, screening of selected excipients was carried out based on difference in solubility parameters, and PVP, copovidone, HPMC and EPO were selected as having good theoretical miscibility with CIL. The selected excipients were evaluated in the third phase for glass transition temperatures (Tg) and miscibility studies according to Florey–Huggins interaction parameter. Out of the four excipients selected in the second phase, only three (except EPO) were used to prepare the solid dispersion by spray drying and were evaluated for Tg and any interactions using FTIR studies (fourth phase). The outcome of Tg’s of the spray-dried samples and their FTIR analysis found a good correlation with predictions of the third phase. And after going through phases 2 to 4, only povidone, copovidone and hypromellose were confirmed as polymer of choice of preparing the solid dispersion of CIL with a prediction of better physical solid-state stability on the basis of good miscibility between drug and carrier.
Acknowledgments
Conflict of Interests
The authors declare no conflict of interest.
REFERENCES
- 1.Van deWaterbeemd H, Lennernas H, Artursson P. Drug bioavailability: estimation of solubility, permeability, absorption and bioavailability. New York: Wiley-VCH; 2003. [Google Scholar]
- 2.Amidon GL, Lennernas H, Shah VP, Crison JR. A theoretical basis for a biopharmaceutical drug classification: the correlation of in vitro drug product dissolution and in vivo bioavailability. Pharm Res. 1995;12:413–20. doi: 10.1023/A:1016212804288. [DOI] [PubMed] [Google Scholar]
- 3.Dressman JB, Amidon GL, Reppas C, Shah VP. Dissolution testing as a prognostic tool for oral drug absorption: immediate release dosage forms. Pharm Res. 1998;15:11–22. doi: 10.1023/A:1011984216775. [DOI] [PubMed] [Google Scholar]
- 4.Hu J, Johnston KP, William RO., III Nanoparticle engineering process for enhancing the dissolution rates of poorly water soluble drugs. Drug Dev Ind Pharm. 2004;30:233–45. doi: 10.1081/DDC-120030422. [DOI] [PubMed] [Google Scholar]
- 5.Habib MJ. Pharmaceutical solid dispersion technology. New York: CRC; 2000. [Google Scholar]
- 6.Pouton CW. Formulation of poorly water-soluble drugs for oral administration: physical–chemical and physiological issues and the lipid formulation classification systems. Eur J Pharm Sci. 2006;29:278–87. doi: 10.1016/j.ejps.2006.04.016. [DOI] [PubMed] [Google Scholar]
- 7.Yalkowsky SH. Solubility and solubilization in aqueous media. New York: Oxford University Press; 1998. [Google Scholar]
- 8.Hancock BC, Zografi G. Characteristics and significance of the amorphous state in pharmaceutical systems. J Pharm Sci. 1997;86:1–12. doi: 10.1021/js9601896. [DOI] [PubMed] [Google Scholar]
- 9.Hilden LR, Morris KR. Physics of amorphous solids. J Pharm Sci. 2004;93:3–12. doi: 10.1002/jps.10489. [DOI] [PubMed] [Google Scholar]
- 10.Privalko VP. Excess entropies and related quantities in glass forming liquids. J Phys Chem. 1980;84:3307–12. doi: 10.1021/j100461a034. [DOI] [Google Scholar]
- 11.Taylor LS, Zografi G. Sugar–polymer hydrogen bond interactions in lyophilized amorphous mixtures. J Pharm Sci. 1998;87:1615–21. doi: 10.1021/js9800174. [DOI] [PubMed] [Google Scholar]
- 12.Forster A, Hempenstall J, Tucker I, Rades T. Selection of excipients for melt extrusion with two poorly water-soluble drugs by solubility parameter calculation and thermal analysis. Int J Pharm. 2001;226:147–61. doi: 10.1016/S0378-5173(01)00801-8. [DOI] [PubMed] [Google Scholar]
- 13.Greenhalgh DJ, Williams AC, Timmins P, York P. Solubility parameters as predictors of miscibility in solid dispersions. J Pharm Sci. 1999;88(11):1182–90. doi: 10.1021/js9900856. [DOI] [PubMed] [Google Scholar]
- 14.Chokshi RJ, Sandhu HK, Iyer RM, Shah NH, Malick AW, Zia H. Characterization of physico-mechanical properties of Indomethacin and polymers to assess their suitability for hot-melt extrusion process as a means to manufacture solid dispersion/solution. J Pharm Sci. 2005;94(11):2463–74. doi: 10.1002/jps.20385. [DOI] [PubMed] [Google Scholar]
- 15.Lu X, Weiss RA. Relationship between the glass transition temperature and the interaction parameter of miscible binary polymer blends. Macromolecules. 1992;25:3242–6. doi: 10.1021/ma00038a033. [DOI] [Google Scholar]
- 16.Marsac PJ, Shamblin SL, Taylor LS. Theoretical and practical approaches for prediction of drug–polymer miscibility and solubility. Pharm Res. 2006;23(10):2417–26. doi: 10.1007/s11095-006-9063-9. [DOI] [PubMed] [Google Scholar]
- 17.Kimura Y, Tani T, Kanbe T, Watanabe K. Effect of cilostazol on platelet aggregation and experimental thrombosis. Arzneimittelforschung. 1985;35:1144–9. [PubMed] [Google Scholar]
- 18.Dawson DL. Comparative effects of cilostazol and other therapies for intermittent claudication. Am J Cardiol. 2001;87:19D–27. doi: 10.1016/S0002-9149(01)01673-3. [DOI] [PubMed] [Google Scholar]
- 19.Money SR, Herd JA, Isaacsohn JL, Davidson M, Cutler B, Heckman J, et al. Effect of cilostazol on walking distances in patients with intermittent claudication caused by peripheral vascular disease. J Vasc Surg. 1998;27:267–75. doi: 10.1016/S0741-5214(98)70357-X. [DOI] [PubMed] [Google Scholar]
- 20.Shimizu T, Osumi T, Niimi K, Nakagawa K. Physico-chemical properties and stability of cilostazol. Arzneimittelforschung. 1985;35:1117–23. [PubMed] [Google Scholar]
- 21.Toyobuku H, Tamai I, Ueno K, Tsuji A. Limited influence of P-glycoprotein on small-intestinal absorption of cilostazol, a high absorptive permeability drug. J Pharm Sci. 2003;92:2249–59. doi: 10.1002/jps.10490. [DOI] [PubMed] [Google Scholar]
- 22.Jinno JJ, Kamada N, Miyake M, Yamada K, Mukai T, Odomi M, et al. Effect of particle size reduction on dissolution and oral absorption of a poorly water-soluble drug, cilostazol, in beagle dogs. J Control Release. 2006;111:56–64. doi: 10.1016/j.jconrel.2005.11.013. [DOI] [PubMed] [Google Scholar]
- 23.Pinnamaneni S, Das NG, Das SK. Formulation approaches for orally administered poorly soluble drugs. Pharmazie. 2002;57:291–300. [PubMed] [Google Scholar]
- 24.Jinno JJ, Kamada N, Miyake M, Yamada K, Mukai T, Odomi M, et al. In vitro–in vivo correlation for wet-milled tablet of poorly water-soluble cilostazol. J Control Release. 2008;130:29–37. doi: 10.1016/j.jconrel.2008.05.013. [DOI] [PubMed] [Google Scholar]
- 25.Kim MS, Lee S, Park JS, Woo JS, Hwang JS. Micronization of cilostazol using supercritical antisolvent (SAS) process: effect of process parameters. Powder Technol. 2007;177:64–70. doi: 10.1016/j.powtec.2007.02.029. [DOI] [Google Scholar]
- 26.Whittall LB, Whittle RR, Stowell GW. Polymorphic forms of cilostazol. Acta Crystallogr C. 2002;58:525–7. doi: 10.1107/S0108270102012544. [DOI] [PubMed] [Google Scholar]
- 27.Stowell GW, Beheme RJ, Denton SM, Pfeiffer I, Sancilio FD, Whittall LB, et al. Thermally-prepared polymorphic forms of cilostazol. J Pharm Sci. 2002;9:2481–8. doi: 10.1002/jps.10240. [DOI] [PubMed] [Google Scholar]
- 28.Pajula K, Taskinen M, Lehto VP, Ketolainen J, Korhonen O. Predicting the formation and stability of amorphous small molecule binary mixtures from computationally determined Flory–Huggins interaction parameter and phase diagram. Mol Pharm. 2010;7(3):795–804. doi: 10.1021/mp900304p. [DOI] [PubMed] [Google Scholar]
- 29.Marsac PJ, Li T, Taylor LS. Estimation of drug–polymer miscibility and solubility in amorphous solid dispersions using experimentally determined interaction parameters. Pharm Res. 2009;26:139–51. doi: 10.1007/s11095-008-9721-1. [DOI] [PubMed] [Google Scholar]
- 30.Tajber L, Corrigan OI, Healy AM. Physicochemical evaluation of PVP–thiazide diuretic interactions in co-spray-dried composites—analysis of glass transition composition relationships. Eur J Pharm Sci. 2005;24:553–63. doi: 10.1016/j.ejps.2005.01.007. [DOI] [PubMed] [Google Scholar]
- 31.Guinot S, Leveiller F. The use of MTDSC to assess the amorphous phase content of a micronised drug substance. Int J Pharm. 1999;192:63–75. doi: 10.1016/S0378-5173(99)00273-2. [DOI] [PubMed] [Google Scholar]
- 32.Hancock BC, York PB, Rowe RC. The use of solubility parameters in pharmaceutical dosage form design. Int J Pharm. 1997;148:1–21. doi: 10.1016/S0378-5173(96)04828-4. [DOI] [Google Scholar]
- 33.Lin D, Huang Y. A thermal analysis method to predict the complete phase diagram of drug–polymer solid dispersions. Int J Pharm. 2010;399:109–15. doi: 10.1016/j.ijpharm.2010.08.013. [DOI] [PubMed] [Google Scholar]
- 34.Law B, Krill SL, Schmitt EA, Fort JJ, Qiu Y, Wang W, et al. Physicochemical considerations in the preparation of amorphous ritonavir–poly(ethylene glycol) 8000 solid dispersions. J Pharm Sci. 2001;90:1015–25. doi: 10.1002/jps.1054. [DOI] [PubMed] [Google Scholar]
- 35.Gupta P, Chawla G, Bansal AK. Physical stability and solubility advantage from amorphous celecoxib: the role of thermodynamic quantities and molecular mobility. Mol Pharm. 2004;1:406–13. doi: 10.1021/mp049938f. [DOI] [PubMed] [Google Scholar]
- 36.Chawla G, Bansal AK. Molecular mobility and physical stability of amorphous Irbesartan. Sci Pharm. 2009;77:695–709. doi: 10.3797/scipharm.0806-09. [DOI] [Google Scholar]
- 37.Graesera KA, Pattersonb JE, Zeitler JA, Gordond KC, Rades T. Correlating thermodynamic and kinetic parameters with amorphous stability. Eur J Pharm Sci. 2009;37:492–8. doi: 10.1016/j.ejps.2009.04.005. [DOI] [PubMed] [Google Scholar]
- 38.Guo YS, Bryn SR, Zografi G. Physical characteristics and chemical degradation of amorphous quinapril hydrochloride. J Pharm Sci. 2000;89:346–51. doi: 10.1002/(SICI)1520-6017(200001)89:1<128::AID-JPS13>3.0.CO;2-Z. [DOI] [PubMed] [Google Scholar]
- 39.Slade L, Levine H. Glass transition and water–food structure interactions. Adv Food Nutr Res. 1995;38:103–269. doi: 10.1016/S1043-4526(08)60084-4. [DOI] [PubMed] [Google Scholar]
- 40.Zhou D, Zhang GGZ, Law D, Grant DJW, Schmitt EA. Physical stability of amorphous pharmaceuticals: importance of configurational thermodynamic quantities and molecular mobility. J Pharm Sci. 2002;91:1863–72. doi: 10.1002/jps.10169. [DOI] [PubMed] [Google Scholar]
- 41.Six K, Verreck G, Peeters J, Augustijns P, Kinget A, Van den Mooter G. Characterization of glassy itraconazole: a comparative study of its molecular mobility below Tg with that of structural analogues using MTDSC. Int J Pharm. 2001;213:163–73. doi: 10.1016/S0378-5173(00)00662-1. [DOI] [PubMed] [Google Scholar]
- 42.Angell CA. The old problems of glass and the glass transition and the many new twists. Proc Natl Acad Sci U S A. 1995;92:6675–82. doi: 10.1073/pnas.92.15.6675. [DOI] [PMC free article] [PubMed] [Google Scholar]
- 43.Kauzmann W. The nature of the glassy state and the behavior of liquids at low temperatures. Chem Rev. 1948;43:219–56. doi: 10.1021/cr60135a002. [DOI] [Google Scholar]
- 44.Hancock BC, Shamblin SC. Molecular mobility of amorphous pharmaceuticals determined using differential scanning calorimetry. Thermochim Acta. 2001;380:95–107. doi: 10.1016/S0040-6031(01)00663-3. [DOI] [Google Scholar]
- 45.Kaushal AM, Bansal AK. Thermodynamic behaviour of glassy state of structurally related compounds. Eur J Pharm Biopharm. 2008;69:1067–76. doi: 10.1016/j.ejpb.2008.02.001. [DOI] [PubMed] [Google Scholar]
- 46.Hodge IM. Enthalpy relaxation and recovery in amorphous materials. J Non-Cryst Solids. 1994;169:211–66. doi: 10.1016/0022-3093(94)90321-2. [DOI] [Google Scholar]
- 47.Craig DQM, Royall PG, Kett VL, Hopton ML. The relevance of the amorphous state to pharmaceutical dosage forms: glassy drugs and freeze dried systems. Int J Pharm. 1999;179:179–207. doi: 10.1016/S0378-5173(98)00338-X. [DOI] [PubMed] [Google Scholar]
- 48.Angell CA. Relaxation in liquids, polymers and plastic crystals—strong/fragile patterns and problems. J Non-Cryst Solids. 1991;131:13–31. doi: 10.1016/0022-3093(91)90266-9. [DOI] [Google Scholar]
- 49.Angell CA. Thermodynamic aspects of the glass transition in liquids and plastic crystals. Pure Appl Chem. 1991;63(10):1387–92. doi: 10.1351/pac199163101387. [DOI] [Google Scholar]
- 50.Crowley KJ, Zografi G. The use of thermal methods for predicting glass-former fragility. Thermochim Acta. 2001;380:79–93. doi: 10.1016/S0040-6031(01)00662-1. [DOI] [Google Scholar]
- 51.Mooter GV, Augustijns P, Kinget R. Stability prediction of amorphous benzodiazepines by calculation of the mean relaxation time constant using the Williams–Watts decay function. Eur J Pharm Biopharm. 1999;48:43–8. doi: 10.1016/S0939-6411(99)00013-2. [DOI] [PubMed] [Google Scholar]
- 52.Hodge IM. Strong and fragile liquids—a brief critique. J Non-Cryst Solids. 1996;202:164–72. doi: 10.1016/0022-3093(96)00151-2. [DOI] [Google Scholar]
- 53.Hancock BC, Parks M. What is the true solubility advantage for amorphous pharmaceuticals? Pharm Res. 2000;17:397–404. doi: 10.1023/A:1007516718048. [DOI] [PubMed] [Google Scholar]
- 54.Yoo SU, Krill SL, Wang Z, Telang C. Miscibility/stability considerations in binary solid dispersion systems composed of functional excipients towards the design of multi-component amorphous systems. J Pharm Sci. 2009;98(12):4711–23. doi: 10.1002/jps.21779. [DOI] [PubMed] [Google Scholar]
- 55.Painter PC, Graf JF, Coleman MM. Effect of hydrogen bonding on the enthalpy of mixing and the composition dependence of the glass transition temperature in polymer blends. Macromolecules. 1991;24:5630–8. doi: 10.1021/ma00020a023. [DOI] [Google Scholar]
- 56.Crowley KJ, Zografi G. Water vapor absorption into amorphous hydrophobic drug/poly(vinylpyrrolidone) dispersions. J Pharm Sci. 2002;91:2150–65. doi: 10.1002/jps.10205. [DOI] [PubMed] [Google Scholar]
- 57.Yoona JS, Oha SH, Kimb MN, China IJ, Kim YH. Thermal and mechanical properties of poly(l-lactic acid)–poly (ethyleneco-vinyl acetate) blends. Polymer. 1999;P40:2303–12. doi: 10.1016/S0032-3861(98)00463-7. [DOI] [Google Scholar]
- 58.Pinal R. Entropy of mixing and the glass transition of amorphous mixtures. Entropy. 2008;10:207–23. doi: 10.3390/entropy-e10030207. [DOI] [Google Scholar]
- 59.Patel SG, Rajput SJ. Enhancement of oral bioavailability of cilostazol by forming its inclusion complexes. AAPS Pharm Sci Technol. 2009;10(2):660–9. doi: 10.1208/s12249-009-9249-7. [DOI] [PMC free article] [PubMed] [Google Scholar]