

Abstract
Emulsions are widely used as topical formulations in the pharmaceutical and cosmetic industries. They are thermodynamically unstable and require emulsifiers for stabilization. Studies have indicated that emulsifiers could affect topical delivery of actives, and this study was therefore designed to investigate the effects of different polymers, applied as emulsifiers, as well as the effects of pH on the release and topical delivery of the active. O/w emulsions were prepared by the layer-by-layer technique, with whey protein forming the first layer around the oil droplets, while either chitosan or carrageenan was subsequently adsorbed to the protein at the interface. Additionally, the emulsions were prepared at three different pH values to introduce different charges to the polymers. The active ingredient, salicylic acid, was incorporated into the oil phase of the emulsions. Physical characterization of the resulting formulations, i.e., droplet size, zeta potential, stability, and turbidity in the water phase, was performed. Release studies were conducted, after which skin absorption studies were performed on the five most stable emulsions, by using Franz type diffusion cells and utilizing human, abdominal skin membranes. It was found that an increase in emulsion droplet charge could negatively affect the release of salicylic acid from these formulations. Contrary, positively charged emulsion droplets were found to enhance dermal and transdermal delivery of salicylic acid from emulsions. It was hypothesized that electrostatic complex formation between the emulsifier and salicylic acid could affect its release, whereas electrostatic interaction between the emulsion droplets and skin could influence dermal/transdermal delivery of the active.
KEY WORDS: emulsion, release, salicylic acid, topical, transdermal
INTRODUCTION
Emulsions are widely used as topical formulations, due to their excellent solubilizing capabilities for lipophilic and hydrophilic active ingredients (1). However, various studies have shown that emulsifiers could affect dermal and transdermal delivery of actives from emulsions. Studies, in which the investigated emulsions had exactly the same composition, with variation only in the emulsifier component, showed that structure and physicochemical properties of emulsifiers, such as the hydrophilic–lipophilic balance value, emulsifier charge, or solid particles versus surfactant, could affect skin absorption of the active. Youenang Piemi et al. (2), for example, had found that positively charged emulsion droplets enhanced the delivery of econazole and miconazole nitrates through and into the skin. It was hypothesized that positively charged emulsion droplets could promote skin absorption, due to a superior binding of the positively charged droplets to the negatively charged skin surface. Another study indicated that Pickering emulsions, which are solely stabilized by solid particles, could enhance percutaneous penetration. Frelichowska et al. (3) investigated the skin absorption of caffeine from silica particle-stabilized water-in-oil emulsions and compared it to the absorption from surfactant-stabilized emulsions. They observed a three-fold higher flux of caffeine from the Pickering emulsion, which was explained by a higher adhesion of the silica particle-stabilized water droplets onto the skin surface. In addition, it was hypothesized that caffeine may have been transported into the skin by means of adsorption onto the silica particles, which were found to penetrate into the upper layers of the stratum corneum. Studies by Förster et al. (4) and Oborska et al. (5) indicated that permeation was inversely related to the hydrophilic chain length of the non-ionic surfactants. These results could be explained by an increasing solubilization effect of the non-ionic surfactant micelles with increasing length of the oxyethylene chain, without an apparent interaction between the surfactants and the stratum corneum lipids (6).
In recent years, research has also focused on biopolymers, derived from natural, renewable sources, as suitable emulsifiers for pharmaceutical delivery systems. Furthermore, in conjunction with the layer-by-layer technique, multi-layered emulsions could be produced, consisting of oppositely charged biopolymers, adsorbed to each other at the oil–water interface, with improved stability against environmental stresses, or controlled release properties (7). Such multi-layered emulsions are prepared by a multiple-step process. First, primary oil-in-water emulsions are prepared with a water-soluble ionic emulsifier, e.g., whey proteins. Secondary emulsions are subsequently formulated by adding another water-soluble biopolymer (e.g., carrageenan or chitosan), preferably with an opposite charge than the droplets in the primary emulsions, to form multi-layered, interfacial coatings. Ionic strength, pH, and temperature may alter the characteristics and functions of biopolymers and hence the stability of resulting emulsions (7). In addition, coatings formed by different biopolymers would have altered physicochemical properties, such as droplet charge, thickness of the biopolymer layer at the oil–water interface, its permeability, and environmental responsiveness, which concomitantly would lead to changes in emulsion characteristics, such as stability and delivery (8).
In this study, three different biopolymers were employed as potential emulsifiers, i.e., solely whey proteins (Whey emulsion), whey proteins layered with chitosan (Chi emulsion), and whey proteins layered with carrageenan (Car emulsion). Furthermore, three different pH values (pH 4, 5, and 6) were chosen for the emulsions in order to introduce different charges to the polymers. Whey proteins are derived from milk, comprising two major proteins, β-lactoglobulin and α-lactalbumin (9). Research on the stabilization of emulsions with whey proteins has been reported, but mostly in food science (10). It was found that whey proteins have a better emulsifying capacity than traditional emulsifiers and that β-lactoglobulin-stabilized emulsions showed higher resistance to gravitational separation (11). The isoelectric point (pI) of whey proteins was reported as pI ≈ 5.2 (10,12). At pH values higher than the pI (e.g., pH 6), the whey proteins have a negative charge, whereas at pH values below the pI (e.g., pH 4), they are positively charged. At pH 5, being close to the pI value, the whey proteins would have a net charge of around zero. Chitosan (Fig. 1) is a cationic biopolymer with a pKa value of ≈6.5. Therefore, chitosan would be positively charged at all pH values chosen for this study (pH < 6.5). Chitosan has further shown to have emulsifying properties (13) and penetration enhancing effects (14). Different states of complexation between chitosan and β-lactoglobulin in the aqueous phase at various pH values were reported (15) that could affect emulsion stability. In a study by Li et al. (16), for example, it was found that β-lactoglobulin–chitosan-stabilized emulsions were more stable to droplet aggregation at pH values between 3 and 6, but less stable at pH values higher than 6, due to the loss of the positive charge of chitosan at pH > 6. In contrast, carrageenan (Fig. 1) is an anionic polysaccharide with a pKa value of ≈2 (8) and would be negatively charged at all pH values used throughout this study (pH > 2). A study by Ru et al. (12) indicated that stable emulsions could be obtained with a combination of β-lactoglobulin and ι-carrageenan at pH values of 3.4 and 4, depending on the protein/polysaccharide ratio used. Contrary, it was found that extensive flocculation occurred at pH 6. A different trend in β-lactoglobulin–ι-carrageenan-stabilized emulsions was observed during a study by Gu et al. (17), where the most stable emulsions toward creaming were found at pH 6, most likely due to improved electrostatic repulsion between the emulsion droplets, owing to highly charged droplet surfaces.
Fig. 1.

Structures of salicylic acid, chitosan, and κ-carrageenan
This study was designed to evaluate the release and the topical delivery of salicylic acid-containing emulsions, by utilizing whey proteins as emulsifier, solely and in conjunction with chitosan or carrageenan at different pH values. Characterization of the various emulsions was performed, i.e., droplet size, zeta potential, and viscosity, to further investigate the effects of the various polymers and pH on the release of the active and also on the dermal and transdermal delivery thereof.
MATERIALS AND METHODS
Materials
Whey protein isolate (BiPro®) was kindly donated by Davisco Foods International (Le Sueur, MN, USA). As per the manufacturer, the whey protein isolate powder comprised at least 97% of dry basis protein, with the main proteins being β-lactoglobulin and α-lactalbumin. Miglyol 812 N® was kindly donated by Cremer (Hamburg, Germany). Carrageenan (commercial grade, type I, predominantly κ-carrageenan, lesser amounts of λ-carrageenan) and chitosan glutamate were purchased from Sigma Aldrich (Johannesburg, Republic of South Africa) and CarboMer (San Diego, CA, USA), respectively. Salicylic acid (99+%) was acquired from SAFC (St. Louis, MO, USA). Potassium chloride and citric acid anhydrous were also purchased from Sigma Aldrich (Johannesburg, Republic of South Africa). Sodium dihydrogen orthophosphate, disodium hydrogen orthophosphate anhydrous, propylene glycol, 1 N hydrochloric acid (HCl), 1 N sodium hydroxide (NaOH), and methanol were purchased from ACE Chemicals (Johannesburg, Republic of South Africa). Acetonitrile (LiChrosolv®, gradient grade for liquid chromatography) and acetic acid (glacial) were acquired from Merck Chemicals (Johannesburg, Republic of South Africa).
Aqueous and Oil Phase Preparation
The buffer solution used for the preparation of the aqueous phase of emulsions was prepared by dissolving 0.01 mol of citric acid and 0.02 mol of dibasic sodium phosphate in deionized water. The solutions were mixed in order to attain citrate-phosphate buffer solutions at pH 4, 5, and 6. The whey protein solution was then prepared by dispersing 3.5% wt. whey protein powder into citrate-phosphate buffer on a mixing plate at room temperature for approximately 2 h to ensure complete hydration. One percent wt. chitosan glutamate and 0.5% wt. carrageenan were separately dissolved in citrate-phosphate buffer at 60°C, and the resultant solutions were allowed to cool to room temperature.
The oil phase consisted of 2% wt. salicylic acid in Miglyol 812 N®. Salicylic acid was left to dissolve in Miglyol 812 N® overnight at 37°C.
Emulsion Preparation
The emulsions were prepared in two phases. First, primary emulsions were prepared by ultrasonication for 30 s (Model UP200St, Hielscher Ultrasonics, Teltow, Germany) at room temperature to yield 30% wt. oil-in-water emulsions. The aqueous phase used for the primary emulsion was the 3.5% wt. whey protein solution. The secondary emulsion was then prepared by diluting the primary emulsion 1:1 (v/v), either with pure citrate-phosphate buffer or 1% chitosan solution or 0.5% carrageenan solution by ultrasonication for 30 s at room temperature. After the secondary emulsion was prepared, the pH of the emulsion was adjusted to pH 4, 5, and 6 by adding 1 N HCl or NaOH. These emulsions were then again sonicated for 30 s to yield the final formulations. The compositions of the final emulsions are listed in Table I. An oil solution, containing the same concentration of salicylic acid as the final emulsions, was prepared as a control formulation.
Table I.
Composition of Secondary Emulsions and the Oil Solution
| Ingredients (% wt.) | Whey protein | Whey protein/chitosan | Whey protein/carrageenan | Oil solution |
|---|---|---|---|---|
| Oil phase | ||||
| Salicylic acid | 0.3 | 0.3 | 0.3 | 0.3 |
| Miglyol 812 N® | 14.7 | 14.7 | 14.7 | 99.7 |
| Water phase | ||||
| Whey protein | 1.225 | 1.225 | 1.225 | – |
| Chitosan glutamate | – | 0.5 | – | – |
| Carrageenan | – | – | 0.25 | – |
| Water | 83.775 | 83.275 | 83.525 | – |
Particle Size Analysis
Droplet size was determined by using the Malvern Mastersizer 2000, equipped with a wet cell Hydro 2000 SM dispersion unit (Malvern Instruments, Worcestershire, UK). The emulsions were diluted with deionized water to yield obscuration values between 10% and 20%. Particle size measurements were performed on days 0 (day of preparation), 1, and 7 to determine the changes in particle size over time. Measurements were taken from two freshly prepared samples per emulsion, with two readings made per sample.
The particle size was confirmed on day 0 by means of microscopy. A Motic microscope (Motic, Hong Kong) was used, equipped with a Moticam 3 camera and Motic Images Plus 2.0 software.
Zeta Potential Measurements
The zeta potential was determined, using a Malvern Zetasizer 2000 (Malvern Instruments, Worcestershire, UK). Prior to analysis, emulsions were diluted 1:3,000 (v/v) with citrate-phosphate buffer at the appropriate pH. Zeta potential measurements were taken on day 0 from one prepared sample per emulsion, with three readings per sample.
Viscosity Measurements
The apparent viscosity was determined with a Brookfield DV-II+ Viscometer + (Middleboro, MA, USA), equipped with a LV1 spindle. Measurements were taken at 100 rpm every 10 s over a time period of 100 s at room temperature. The average of 10 readings taken for each emulsion was calculated. The percentage torque was recorded between 7.8% and 28.9%.
Creaming Stability
Three milliliters of each emulsion was transferred into a separate test tube and sealed with plastic wrap. These samples were kept at room temperature for 1 week, and the height of the emulsion and of the creaming layer was measured after 7 days. The extent of creaming was assessed by using the creaming index (CI), which was calculated as per Eq. 1:
 |
1 |
Turbidity
The aqueous phases of the different emulsions, as well as aqueous solutions of pure salicylic acid and of the different pure biopolymers at pH 4, 5, and 6, were subjected to turbidity measurements. The samples were analyzed using a UV–VIS spectrophotometer (Specord 200 Plus, Analytic Jena, Germany) at 600 nm. Two readings were performed per sample.
Release of Active from the Formulations
The release of the active ingredient from all nine emulsions, as well as from the oil solution, was determined in quadruplicate, using Franz-type diffusion cells having a diffusion area of 1.13 cm2 and cellulose nitrate membranes (0.2 μm pore size, Whatman, Dassel, Germany). The release experiments were conducted at 37 ± 1°C in a heated water bath for 8 h. The membranes were soaked overnight in the receptor phase, consisting of phosphate buffer pH 7.4 and propylene glycol (PG) (1:1, v/v). Fifty percent of PG was included into the receptor phase to increase the solubility of salicylic acid therein to ensure sink conditions throughout the duration of the study. The receptor compartment was filled with 2 ml of preheated and degassed receptor phase and left to equilibrate before adding the donor phase. The donor compartment was filled with 1 ml of emulsion. The receptor fluid was stirred with a magnetic stirrer at 750 rpm. The entire volume of the receptor phase was withdrawn at 0.5, 1, 1.5, 2, 3, 4, 6, and 8 h and replaced with fresh pre-heated receptor media. The samples were analyzed by high-performance liquid chromatography (HPLC).
Skin Preparation
White female abdominal skin was obtained from cosmetic surgeries. The utilization of human skin was approved by the Ethics Committee of the North-West University, Potchefstroom, South Africa (Ethics number: NWU-00114-11-A5), and skin was obtained with the informed consent of the donors. The skin was thawed at room temperature. Split thickness skin (400 μm), containing stratum corneum, viable epidermis, and upper dermis, was removed with an electric dermatome (Zimmer Inc., Warsaw, IN, USA). The skin membrane was then placed with stratum corneum facing upward on filter paper, wrapped in aluminum foil, and frozen at −20°C until use. Prior to the diffusion experiments, the skin membrane was thawed at room temperature and cut into the required size (circular pieces of approximately 1.5 cm in diameter). The time from skin collection to use of the skin did not exceed 6 months.
In Vitro Skin Absorption Study
A randomized, complete block design was used to assess the effect of skin donor variability, as well as the effect of formulation on dermal and transdermal delivery. Three different skin donors were used per formulation, and each formulation was applied in duplicate on each donor skin, giving a total of six replicates per formulation.
Based on the results of the release and emulsion characterization data, five formulations plus the oil solution were selected for the skin diffusion study. Whey emulsions at pH 4, 5, and 6, the Chi emulsion at pH 6, and the Car emulsion at pH 6 were chosen. Skin diffusion studies were performed using Franz-type diffusion cells with a diffusion area of 1.13 cm2. The study was conducted at 37 ± 1°C in a heated water bath for 24 h. Prior to the skin diffusion study, the skin integrity was assessed by measuring electric resistance across the skin. For skin resistance, the donor and the receptor compartments were both filled with a 0.9% potassium chloride solution and placed in the heated water bath for an equilibration period of 30 min. Electrical resistance was measured by using a Tinsley LCR Databridge Model 6401 (Tinsley Precision Instruments, Croydon, UK). The reading was determined at 1 kHz with a maximum voltage of 300 mV root mean square in the parallel equivalent circuit mode, using an alternating current (18). Skin samples with resistance values below 10 kΩ were rejected from the study. After completion of the resistance measurements, both the donor and the receptor compartments were emptied. The receptor compartment was filled with 2 ml of preheated and degassed receptor phase (phosphate buffer pH 7.4 and PG (1:1, v/v)) and left for 30 min to equilibrate before adding the donor phase. The donor compartment was filled with 1 ml of emulsion. The receptor fluid was stirred, using a magnetic stirrer at 750 rpm. The entire volume of the receptor phase was withdrawn at times 3, 6, 9, 12, 18, and 24 h and replaced with fresh pre-heated receptor media. Prior recovery tests confirmed that salicylic acid was stable during 24 h of permeation experiments. The samples were analyzed by HPLC.
Skin Sample Preparation
After completion of the 24-h diffusion studies, the emulsions were removed from the donor compartment and the skin membranes removed from the cells and pinned onto filter paper with the stratum corneum facing upward. The remainder of the emulsion was removed by gently dabbing the skin surface with paper towel. Sixteen strips of 3 M Scotch® Magic™ tape, of which the first strip was discarded, were used to remove the stratum corneum. The remainder of the skin after the tape stripping was cut into pieces to increase the surface area for extraction. The tape strip samples as well as the cut skin pieces were separately placed into methanol in order to extract the salicylic acid over a period of at least 12 h and stored at 4°C. A longer storage period (up to 2 weeks) did not affect the stability of salicylic acid in the skin samples as confirmed by tests performed prior to the experiments. The samples were then vortex mixed and filtered through hydrophilic PVDF pre-filters with a pore size of 0.45 μm (Agela Technologies Inc., Wilmington, DE, USA) and subsequently analyzed by HPLC.
Statistical Analysis
Data from the release study were analyzed by means of one-way analysis of variance (ANOVA), and the data from the skin absorption study was analyzed by two-way ANOVA, using STATISTICA® (StatSoft Inc., Tulsa, OK, USA). For the skin absorption results, the formulation was employed as fixed effect and the skin donor as random effect. Subsequently, Tukey’s honestly significant difference test was performed on both data sets to compare the various formulations with each other, and data with p < 0.05 were considered statistically significant.
HPLC-UV Method
HPLC analysis of salicylic acid was performed using an Agilent® 1100 Series HPLC system (Agilent Technologies, Palo Alto, CA, USA), equipped with a high-performance, silica-based, reversed phase C18-2 column (150 × 4.60 mm) with 5 μm particle size (Venusil XBP Agela Technologies, Wilmington, DE, USA) in a controlled laboratory environment at 25°C. This instrument was equipped with a G1311A quaternary pump, G1313A autosampler, and a G1315A multi-wavelength, diode array detector. The mobile phase consisted of 1% acetic acid, 45% acetonitrile, and 54% Milli-Q® water and was degassed after preparation. Flow rate was set at 1 ml min−1 with a run time of approximately 6 min. The UV detector was set at 236 nm. All samples were injected in duplicate. Chromatograms were analyzed, using ChemStation Rev. A.10.03 software.
RESULTS
Characterization of Emulsions
The data obtained from the zeta potential analysis, droplet size measurement, viscosity, and creaming index (CI) are summarized in Table II. The data illustrate that within each emulsion set (whey, Chi, and Car emulsions), the zeta potential decreased with increasing pH. Furthermore, the addition of chitosan to the whey protein emulsions resulted in increased zeta potentials at all pH values, whereas the addition of carrageenan decreased the zeta potential. The results of the droplet size analyses were presented as volume weighted means (D [4,3]) and surface weighted means (D [3,2]). Table II shows that the Chi emulsions initially yielded the largest droplets (with volume weighted means between 25 and 46 μm on day 0), followed by whey and Car emulsions (with volume weighted means between 2 and 3 μm). The droplet size of the whey emulsions at pH 4 and 6, the Chi emulsion at pH 6, and all Car emulsions did not change significantly over the time period of 7 days. All other emulsions exhibited an increase in droplet size over time. Furthermore, shortly after preparation of the emulsions, the droplet size data obtained by laser light scattering were confirmed microscopically (Fig. 2). The microscopy images of the whey emulsion at pH 4, the Car emulsion at pH 4, and all of the Chi emulsions showed aggregation of emulsion droplets. From the CI, it could be seen that the whey emulsions at pH 4 and 6 and the Chi emulsion at pH 6 revealed the best stability against creaming. The apparent viscosity indicated that all nine formulations had similar, very low viscosity values.
Table II.
Physical Characterization of Emulsions Containing Salicylic Acid Presented as Average ± SD
| Whey | Chi | Car | |||||||
|---|---|---|---|---|---|---|---|---|---|
| pH 4 | pH 5 | pH 6 | pH 4 | pH 5 | pH 6 | pH 4 | pH 5 | pH 6 | |
| Zeta potentiala (mV) | |||||||||
| With Sal | 23.9 ± 0.8 | 3.8 ± 1.8 | −8.6 ± 1.4 | 32.4 ± 2.0 | 21.6 ± 0.8 | 14.9 ± 3.6 | 15.5 ± 0.8 | −13.0 ± 1.2 | −32.5 ± 12.2 |
| Without Sal | 23.7 ± 0.5 | 6.4 ± 2.2 | −9.7 ± 0.6 | 26.7 ± 1.3 | 20.7 ± 1.5 | 9.5 ± 3.1 | 22.5 ± 0.3 | −18.7 ± 5.5 | −21.0 ± 2.1 |
| Particle sizeb (μm) | |||||||||
| Day 0 | |||||||||
| D [4,3] | 2.61 ± 0.09 | 2.85 ± 0.06 | 2.47 ± 0.01 | 25.77 ± 3.21 | 46.07 ± 1.28 | 38.34 ± 3.01 | 3.09 ± 0.03 | 2.54 ± 0.02 | 2.39 ± 0.06 |
| D [3,2] | 1.85 ± 0.02 | 2.08 ± 0.02 | 1.80 ± 0.01 | 5.19 ± 0.41 | 5.84 ± 0.08 | 14.37 ± 0.83 | 2.31 ± 0.03 | 1.99 ± 0.02 | 1.90 ± 0.06 |
| Day 1 | |||||||||
| D [4,3] | 3.63 ± 1.12 | 94.13 ± 2.87 | 2.50 ± 0.03 | 46.77 ± 4.47 | 70.69 ± 7.32 | 36.36 ± 0.68 | 9.09 ± 4.92 | 16.22 ± 12.1 | 7.71 ± 6.18 |
| D [3,2] | 1.82 ± 0.02 | 21.68 ± 1.01 | 1.82 ± 0.02 | 7.66 ± 0.13 | 11.45 ± 0.08 | 13.76 ± 0.20 | 2.50 ± 0.09 | 2.12 ± 0.12 | 2.07 ± 0.13 |
| Day 7 | |||||||||
| D [4,3] | 3.69 ± 1.21 | 93.64 ± 6.71 | 2.38 ± 0.03 | 47.23 ± 4.85 | 58.02 ± 3.00 | 37.25 ± 1.57 | 7.64 ± 4.95 | 2.69 ± 0.04 | 2.26 ± 0.01 |
| D [3,2] | 1.83 ± 0.04 | 18.02 ± 2.92 | 1.79 ± 0.02 | 7.61 ± 0.19 | 10.60 ± 0.36 | 13.69 ± 0.30 | 2.46 ± 0.10 | 1.99 ± 0.01 | 1.74 ± 0.01 |
| CIc (%) | 0 | 47.3 | 0 | 57.1 | Flocs | 0 | 73.2 | 83.9 | 91.1 |
| Viscosityd (mPa s) | 7.88 ± 0.03 | 19.24 ± 0.71 | 4.69 ± 0.04 | 17.16 ± 0.09 | 5.99 ± 0.02 | 13.92 ± 0.08 | 13.65 ± 0.03 | 13.31 ± 0.09 | 10.18 ± 0.06 |
Whey whey protein, Chi whey protein/chitosan, Car whey protein/carrageenan, Sal salicylic acid, D[4,3] volume weighted mean diameter and D[3,2] surface weighted mean diameter, CI creaming index
a n = 3
b n = 4
cDetermined after 7 days
d n = 10
Fig. 2.

Light microscopy images of whey, Chi, and Car emulsions at pH 4, 5, and 6 obtained at a magnification of ×40. The scale bar in each photograph represents 10 μm
Turbidity
Data from the turbidity measurements are presented in Table III. They illustrate that the highest turbidity for the aqueous solution of whey proteins was obtained at pH 5, whereas the turbidity of the chitosan and the carrageenan solutions increased with pH. In addition, with an increase in pH, the insoluble complex formation between whey protein and chitosan increased. Contrary, the insoluble complex formation between whey protein and carrageenan decreased with increasing pH. The absorbance value for the whey–carrageenan solution at pH 4 was very high (>9). However, the samples were not diluted and the original polymer concentrations in the various aqueous solutions were maintained in order to enable a comparison between them. It was further noted that the addition of salicylic acid to the aqueous solutions of the various emulsifiers (solely whey, whey + Chi, or whey + Car) did not result in a significant change in turbidity, except for whey–Chi at pH 4 and whey–Car at pH 6.
Table III.
Turbidity Results (Absorbance Values at 600 nm) of Aqueous Solutions Presented as Average ± SD (n = 2)
| Turbidity (cm−1) | pH 4 | pH 5 | pH 6 |
|---|---|---|---|
| Sal | 0.008 ± 0.001 | 0.300 ± 0.002 | 0.339 ± 0.007 |
| Whey | 0.745 ± 0.007 | 2.430 ± 0.003 | 0.437 ± 0.001 |
| Whey + Sal | 0.749 ± 0.044 | 2.464 ± 0.011 | 0.469 ± 0.017 |
| Chi | 0.067 ± 0.013 | 0.945 ± 0.002 | 1.331 ± 0.022 |
| Whey + Chi | 0.302 ± 0.014 | 1.674 ± 0.039 | 2.990 ± 0.003 |
| Whey + Chi + Sal | 1.878 ± 0.017 | 2.720 ± 0.023 | 2.825 ± 0.001 |
| Car | 0.026 ± 0.001 | 0.319 ± 0.002 | 0.396 ± 0.004 |
| Whey + Car | >9 | 4.335 ± 0.487 | 0.450 ± 0.002 |
| Whey + Car + Sal | >9 | 3.789 ± 0.141 | 3.310 ± 0.163 |
Sal salicylic acid, Whey whey protein, Chi chitosan, Car carrageenan
Release of Active from the Formulations
All release samples taken at the different time points had salicylic concentrations below 10% of the solubility of salicylic acid in the receptor phase (cs = 31 mg ml−1), which indicated that sink conditions in the receptor phase were maintained throughout the release study. The results of the release study were divided into two groups, i.e., the effect of pH of each emulsion group (Fig. 3) and the effect of polymer at each pH value (Fig. 4). The results of the emulsions were also compared to the oil solution containing the same concentration of salicylic acid as the emulsions. The cumulative amount of salicylic acid released per surface area was plotted against the square root of time, according to Eq. 2, which represents the simplified Higuchi model.
 |
2 |
where ft is the cumulative amount of salicylic acid released per surface area, KH is the Higuchi dissolution constant, and  represents the square root of time. The release rate KH was calculated from the linear portion (t0.5 h − t8 h) of the correlation between the cumulative amount of released salicylic acid per surface area and square root of time. Calculated release rates and regression coefficients are presented in Table IV. As illustrated by Figs. 3 and 4, as well as by the regression coefficients in Table IV, the amount of salicylic acid released per surface area showed a linear relationship with the square root of time (R2 ≥ 0.99) for all formulations tested according to the Higuchi model.
Fig. 3.
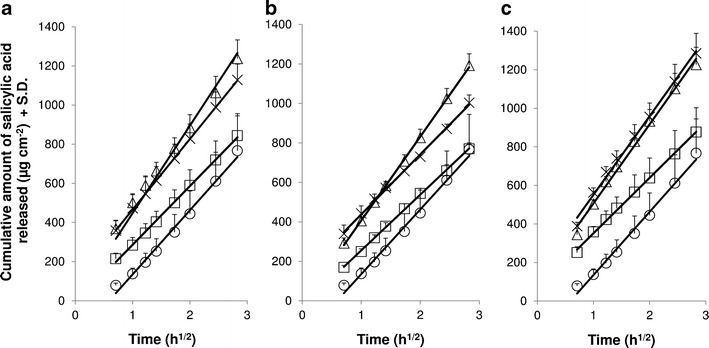
In vitro release of salicylic acid through cellulose nitrate membranes for a whey emulsions, b Chi emulsions, and c Car emulsions. Effect of pH: white square pH 4, white triangle pH 5, and multiplication sign pH 6. The oil solution (white circle) served as control. The release data are presented as linear fit against square root of time (according to simplified Higuchi equation). Average ± SD (n = 4). The cumulative amount of salicylic acid released in 8 h from all three emulsion types (whey, Chi, and Car) at pH 4 was statistically significantly different (p < 0.05) from the respective emulsions at pH 5 and 6. The cumulative released amount from the oil solution was also statistically significant (p < 0.05) from all three emulsion types at pH 5 as well as from whey and Car emulsions at pH 6. The release rate from Chi pH 5 was statistically significantly different (p < 0.05) from Chi pH 4 and 6, and the release rate from Car pH 4 was statistically significantly different (p < 0.05) from Car pH 5 and 6
Fig. 4.

In vitro release of salicylic acid through cellulose nitrate membranes for emulsions at a pH 4, b pH 5, and c pH 6. Effect of polymer: white square whey, white triangle Chi, and multiplication sign Car. The oil solution (white circle) served as control. The release data are presented as linear fit against square root of time (according to simplified Higuchi equation). Average ± SD (n = 4). The cumulative amount of salicylic acid released in 8 h from the oil solution was statistically significantly different (p < 0.05) from all three emulsion types at pH 5 as well as from the whey and Car emulsion at pH 6. The cumulative released amount was also statistically significant (p < 0.05) between Chi and Car at pH 6
Table IV.
Release Rate and Cumulative Release in 8 h Through Cellulose Nitrate Membranes Presented as Average ± SD (n = 4) and Steady-State Flux Through Human Skin Presented as Least Square Means (Formulation Effect) ± 95% Confidence Interval (n = 6)
| In vitro release through cellulose nitrate membranes | In vitro steady state flux trough human skin | ||||||
|---|---|---|---|---|---|---|---|
| k H a (μg cm−2 h−1/2) | R 2 | Cumulative release in 8 ha (%) | J SS b (μg cm−2 h−1) | R 2 | |||
| LSM | 95% CI | ||||||
| Whey | pH 4 | 300.35 ± 42.78 | 0.99 | 22.6 ± 2.6*** | 10.87*** | 7.72–15.29 | 0.99 |
| pH 5 | 400.48 ± 46.94 | 0.99 | 34.6 ± 2.3 | 0.75******* | 0.54–1.06 | 0.98 | |
| pH 6 | 361.15 ± 12.75 | 0.99 | 30.4 ± 1.9 | 0.26 | 0.18–0.37 | 0.95 | |
| Chi | pH 4 | 282.80 ± 10.59 | 1.00 | 22.9 ± 0.8**** | n.d. | ||
| pH 5 | 425.40 ± 33.90* | 1.00 | 33.8 ± 1.5 | n.d. | |||
| pH 6 | 303.98 ± 33.93 | 0.99 | 25.7 ± 0.9 | 0.75******** | 0.54–1.06 | 0.98 | |
| Car | pH 4 | 287.73 ± 48.97** | 0.99 | 22.7 ± 2.8** | n.d. | ||
| pH 5 | 410.58 ± 35.29 | 0.99 | 32.0 ± 2.0 | n.d. | |||
| pH 6 | 407.73 ± 44.63 | 0.99 | 31.2 ± 2.2***** | 0.17 | 0.12–0.24 | 0.97 | |
| Oil | – | 328.13 ± 70.30 | 0.99 | 23.9 ± 4.8****** | 1.16 | 0.83–1.64 | 0.98 |
LSM least square means, CI confidence interval, Whey whey protein, Chi whey protein/chitosan, Car whey protein/carrageenan, Oil oil solution, n.d. not determined
*p < 0.05 against Chi pH 4 and 6; **p < 0.05 against Car pH 5 and 6; ***p < 0.05 against whey pH 5 and 6; ****p < 0.05 against Chi pH 5 and 6; *****p < 0.05 against Chi pH 6; ******p < 0.05 against whey pH 5 and 6, Chi pH 5, and Car pH 5 and 6; *******p < 0.05 against whey pH 4 and 6; ********p < 0.05 against whey and Car pH 6
a n = 4
b n = 6
During the first set of experiments, in which the effect of pH (Fig. 3) on the release of salicylic acid from the emulsions was investigated, it was found that for all three emulsion types, the release of salicylic acid was similar at pH 5 and 6, while the emulsions at pH 4 consistently obtained a statistically significantly lower release than those at pH 5 and 6 (p < 0.05). The second set of results, representing the effect of polymer (Fig. 4) on the release of the active, showed no differences between the different emulsion types at pH 4 and 5. However, at pH 6, the polymer affected the release of salicylic acid, i.e., the addition of carrageenan resulted in an increase, whereas the addition of chitosan reduced the release of salicylic acid from the emulsions. The differences between the Chi and Car emulsions at pH 6 were statistically significant (p = 0.019). It was also noted that the cumulative release of salicylic acid from the oil solution (ca. 24% salicylic acid in 8 h) was similar to those from the various emulsions at pH 4 (ca. 23%), but lower in comparison with the emulsions at pH 5 (32–35%) and pH 6 (25–31%).
In Vitro Skin Absorption
The results of the skin absorption experiments are depicted in Figs. 5 and 6 and are expressed as the total amount of active delivered over 24 h of permeation as least square means (formulation effect) ± 95% confidence interval obtained after two-way ANOVA. As with the release data, the results of the skin absorption study were also divided into two groups, i.e., to investigate the effect of pH of whey emulsions (Fig. 5) and to study the effect of polymers at pH 6 (Fig. 6). Furthermore, the steady-state flux was calculated from the linear portion of the permeation plots (cumulative amount of salicylic acid permeated per surface area plotted against time) between t3 h − t24 h and their calculated values, together with the regression coefficients, are summarized in Table IV.
Fig. 5.

In vitro skin absorption data of salicylic acid from whey emulsions through human abdominal skin, expressed as total amount delivered over 24 h as least square means (formulation effect) ± 95% confidence interval (C.I.), obtained after two-way ANOVA (n = 6). The graph represents the effect of pH on skin absorption. The oil solution served as control. *p < 0.05 against pH 4 and oil; **p < 0.05 against pH 4, 5, and 6; ***p < 0.05 against pH 4, 5, and oil; ****p < 0.05 against pH 4 and 6
Fig. 6.
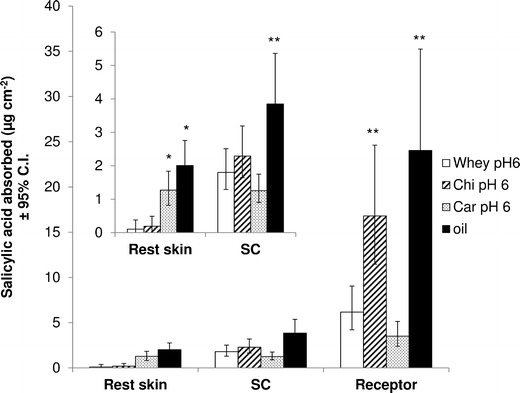
In vitro skin absorption data of salicylic acid from different emulsions at pH 6 through human abdominal skin, expressed as total amount delivered over 24 h as least square means (formulation effect) ± 95% confidence interval (C.I.), obtained after two-way ANOVA (n = 6). The graph represents the effect of polymer on skin absorption. The oil solution served as control. *p < 0.05 against whey and Chi; **p < 0.05 against whey and Car
The first set of results, investigating the effect of pH on topical delivery (Fig. 5), showed that the pH significantly influenced skin absorption of salicylic acid, showing a decline in skin absorption with increasing pH. Statistical analysis revealed that dermal and transdermal delivery was statistically significantly different among all pH values (p < 0.05). When comparing the oil solution with the whey emulsions at various pH, it was ascertained that the dermal and transdermal delivery of the active from the oil solution was similar to those of the emulsion at pH 5, which were much lower than at pH 4, but higher than at pH 6. It was further found that the trend for dermal and transdermal delivery was similar for the various whey emulsions at different pH values.
However, in the second set of results, in which the effect of different polymers on topical delivery of salicylic acid was compared, the trend for dermal and transdermal delivery was different. The Chi emulsion statistically significantly enhanced permeation of the active through the skin (p = 0.009 against whey and p = 0.0002 against Car), whereas the Car emulsion statistically significantly increased the delivery of salicylic acid into the viable epidermis (p = 0.0009 against whey and p = 0.003 against Chi). In addition, the oil solution resulted in the highest dermal and transdermal delivery, compared to the various emulsions. However, there was neither a statistically significant difference in transdermal delivery between the oil solution and the Chi emulsion nor in dermal delivery between the oil solution and the Car emulsion.
DISCUSSION
Characterization of Emulsions
Emulsion preparation was based on the principles of the layer-by-layer technique (19), in which the oil droplets were coated with a layer of whey proteins and then with a layer of polysaccharides, either chitosan or carrageenan. The increase in zeta potential after addition of positively charged chitosan to whey-stabilized emulsions, and similarly the decrease of zeta potential after addition of negatively charged carrageenan to the primary emulsions at the three pH values of 4, 5, and 6 (Table II), was indicative of the successful layering of the polysaccharides onto the whey proteins at the oil–water interface, by means of electrostatic complexation. An increase in zeta potential of a mixed aqueous solution of chitosan and β-lactoglobulin between pH 4 and 7, compared to a pure aqueous β-lactoglobulin solution, was also reported by Guzey and McClements (15) and was related to electrostatic complexation between the two polymers. Furthermore, Cho et al. (8) reported similar results for the adsorption of carrageenan onto β-lactoglobulin coated-lipid droplets, as the addition of carrageenan to the primary emulsion yielded more negative zeta potential values. Although the zeta potential of the whey emulsion was already negative at pH 6, it was evident from the results in Table II that anionic carrageenan was additionally adsorbed onto the whey proteins. It was very likely that positively charged groups were still available at the whey protein surface to interact with the anionic carrageenan (17). The same assumption could be made regarding the adsorption of cationic chitosan onto positively charged whey proteins at pH 4.
The increase in droplet size over time for the whey emulsion at pH 5 and for the Chi emulsions at pH 4 and 5 could either be attributed to coalescence or flocculation of the emulsion droplets. The light microscopy images in Fig. 2, however, revealed no apparent increase in droplet size due to droplet coalescence, but rather due to flocculation. The whey emulsion at pH 5, which showed an increase in droplet size over time, did not show any flocculation in the microscopy images taken on day 0, indicating that flocculation only occurred after 1 day, as was confirmed by the Mastersizer results. The results for the whey emulsions were congruent with findings in previous studies, during which whey protein-stabilized emulsions had been unstable to droplet aggregation at pH values close to the isoelectric point (e.g., pH 5), owing to a low net charge of the droplets and therefore less repulsive interactions between emulsion droplets (8,17). In contrast, the microscopy images of all Chi emulsions, the Car emulsion at pH 4, and the whey emulsion at pH 4 indicated immediate flocculation, which was not always congruent with the droplet size results obtained by laser light scattering, e.g., for whey emulsion at pH 4 and Car emulsion at pH 4. This was most likely due to a breakup of the emulsion droplet aggregates, as a result of dilution of the formulations prior to particle analysis. Li et al. (16) investigated β-lactoglobulin–chitosan-stabilized emulsions and found that the adsorption of chitosan onto β-lactoglobulin increased the stability of the emulsions toward droplet aggregation between pH 3 and 6, which was a function of the chitosan concentration in the emulsions. These findings were in contrast to the results obtained during this study. Different results were also obtained for β-lactoglobulin–carrageenan-stabilized emulsions. In a study by Cho et al. (8), the addition of carrageenan to β-lactoglobulin resulted in extensive droplet aggregation at pH values below 6. Gu et al. (17) also found extensive droplet flocculation between pH values 3 and 5, but not between pH 6 and 8, and it was further demonstrated that the droplet aggregation was dependent on the carrageenan concentration. In this study, however, no extensive droplet aggregation was observed for the Car emulsions between pH 4 and 6. These different outcomes could have been due to differences in polymer concentration, the emulsion preparation technique, and ionic strength of the aqueous phase.
Turbidity
Turbidity can be used as a measurement for insoluble complex formation in the aqueous phase. However, this provides no information regarding complex formation that is soluble in the aqueous phase (15). It also has to be kept in mind that complex formation between the whey proteins and polysaccharides could be different in the emulsion formulations, compared to the aqueous solutions, because the structure of the whey proteins may differ between the two systems, e.g., native versus denatured form (17). The trend in turbidity of the whey and chitosan solutions across the analyzed pH range was similar to data presented by Guzey and McClements (15). The highest turbidity of the aqueous whey solution was found at pH 5, close to the isoelectric point of whey proteins. The reduced net charge of the proteins at this pH minimized electrostatic repulsion between the protein molecules and therefore enhanced aggregation. Similarly, the aqueous chitosan solutions became more turbid with increasing pH, due to the loss of positive charges of amino groups of chitosan when approaching the pKa value (pKa ≈ 6.5) (15).
The increase in insoluble complex formation between whey proteins and positively charged chitosan with an increase in pH of the aqueous phase could be explained by an increased electrostatic interaction between whey and chitosan, due to an increase in negative charge of the whey proteins with increasing pH. In contrast, the insoluble complex formation in the aqueous phase between whey proteins and negatively charged carrageenan decreased with an increase in pH because of a decrease in the positive charge of the whey proteins. This alteration in turbidity with a change in pH could be indicative of a successful layering of the polysaccharides onto the whey proteins.
Release of Active from the Formulations
In a preliminary study (data not presented here), during which the release of salicylic acid from aqueous solutions at pH 4, 5, and 6 had been investigated, the release rate was determined to be in the order: pH 4 > pH 5 > pH 6, hence opposite to the trend observed for the release of salicylic acid from emulsions (Fig. 3). The preliminary release study had been performed similarly to this emulsion study, with the only difference being the donor phase that had consisted of the aqueous phase of the emulsion, containing 1 mg ml−1 salicylic acid, but no emulsifiers. The concentration of 1 mg ml−1 of salicylic acid, which was below the saturation concentration, was assumed as the concentration present in the aqueous phase of the emulsions in equilibration with the oil phase (according to the oil/water phase partition coefficient). The decrease in release of the active with an increase in pH could be explained by a decrease in thermodynamic activity with increasing pH values of the aqueous donor phase, due to the increasing solubility of salicylic acid with increasing pH (20).
The opposite trend in release, being observed for the various emulsions at different pH, must therefore have been related to some effect within the emulsion. No correlation could be found between the release and droplet size, apparent viscosity, and turbidity data. However, the active’s release from the emulsion could be related to the zeta potential of the emulsions. According to the Henderson–Hasselbalch equation, more than 90% of the salicylic acid would be ionized in the aqueous phase of the emulsions between pH 4 and 6. Since the pKa of salicylic acid is ≈3, the salicylic acid was negatively charged at all three pH values of 4, 5, and 6. It is assumed that the negatively charged salicylic acid was electrostatically interacting with the positively charged emulsion droplets at pH 4 for all three emulsions, thus resulting in a lower release. In contrast, the more negatively charged emulsion droplets at pH 5 and 6 could have yielded a reduced electrostatic interaction between emulsion droplets and salicylic acid, which therefore hindered the release to a lesser extent. However, it was noted that the zeta potential of the emulsions containing salicylic acid and of those emulsions without salicylic acid were similar (Table II). It should, however, also be kept in mind that the emulsions were highly diluted prior to zeta potential analysis and therefore the effect of salicylic acid could have been weakened. Furthermore, the proposed electrostatic interaction between the emulsifier of the emulsion droplets and salicylic acid did not always result in insoluble complex formation, as indicated by the consistent turbidity results. No insoluble complex formation was, for example, observed between whey proteins and salicylic acid at all three pH values, since the addition of salicylic acid to the aqueous phase of whey proteins did not result in an increase in turbidity (Table III).
A comparison of the different emulsions, containing different polymers at the same pH, showed no correlation between release and droplet size, apparent viscosity, and turbidity data. Again, the electrostatic interaction between the emulsifiers and active ingredient could have influenced the release. At pH 4, for example, the release of salicylic acid was similar for the different emulsions (Fig. 4a). Similarly, the zeta potential among the various emulsions did not differ significantly (Table II). In contrast, at pH 6, the release of salicylic acid increased (Chi < whey < Car) (Fig. 4c), with a decline in zeta potential (Chi > whey > Car) (Table II), indicating that a lower zeta potential yielded a reduced electrostatic interaction between emulsion droplets and salicylic acid, which therefore improved release.
All of the emulsions during this study performed equally or better in terms of release than the corresponding oil phase. The increase in release of salicylic acid from emulsions could have been due to an increased surface area, owing to the presence of oil droplets. Figures 3 and 4 also showed a longer lag time for release of salicylic acid from the oil solution, which could have been caused by a less favorable partitioning of salicylic acid between the oil and the aqueous receptor phase-saturated membrane, compared to the partitioning between the aqueous phase of the emulsion and the aqueous receptor phase-saturated membrane.
In Vitro Skin Absorption
Due to limited availability of human skin, only five out of the nine emulsions were used for skin absorption studies (whey pH 4, 5, 6; Chi pH 6; and Car pH 6). The whey emulsions at different pH values were selected because they showed better stability over the entire pH range than the Chi and Car emulsions. Furthermore, they included positive and negative zeta potentials (Table II). For the investigation of the effect of the different polymers, the various emulsions at pH 6 were chosen. The reasons for the selection were again the better stability compared to the respective emulsions at pH 4 and 5 as well as the inclusion of emulsions with negative and positive zeta potentials.
The comparison of skin absorption data of the whey-stabilized emulsions at three different pH values (Fig. 5) revealed that dermal and transdermal delivery was significantly increased by the whey-stabilized emulsion at pH 4, although the release was the lowest for this formulation. This could be related to the fact that salicylic acid had the lowest degree of ionization at pH 4. According to the Henderson–Hasselbalch equation, approximately 91% of salicylic acid was ionized at pH 4, whereas more than 99% was ionized at pH 5 and 6. The skin absorption results were congruent with the pH partition hypothesis, which states that the unionized form of actives is the preferred form for permeation, as was also demonstrated by the transdermal permeation of salicylic acid during a study by Smith and Irwin (21). However, the increase in skin permeation of salicylic acid was higher than what was expected solely from the effect of ionization. Another formulation factor may therefore have influenced skin absorption. It was hypothesized that the emulsion droplet charge (as indicated by the zeta potential) could have contributed to the increased delivery of salicylic acid from emulsions with decreasing pH values. As shown in Table II, the zeta potential for the whey emulsion was positive at pH 4, while showing a zero net charge at approximately pH 5, with negative values at pH 6. Since the skin surface is negatively charged (22), it is assumed that electrostatic interactions between the negatively charged skin and positively charged emulsion droplets at pH 4 favored the transport of salicylic acid into and through the skin. Similar results had been obtained during studies by Youenang Piemi et al. (2) and Ghouchi Eskandar et al. (23), during which positively charged emulsion droplets had yielded increased dermal and transdermal delivery in comparison with negatively charged emulsion droplets.
A comparison of the skin absorption data of the three emulsions at pH 6, containing different biopolymers (Fig. 6), revealed an enhanced transdermal delivery for the Chi emulsions, whereas the Car emulsions improved dermal delivery. As with the whey emulsions at various pH values, the transdermal delivery data of the emulsions containing different polymers correlated well with the zeta potential data. It was found that with decreasing zeta potential (Table II) (Chi > whey > Car), the transdermal delivery into the receptor phase was reduced (Fig. 6) (Chi > whey > Car). It was assumed that the positively charged amino groups of chitosan interacted with the negatively charged skin surface, which enhanced transdermal delivery. The enhanced skin permeation could also be related to the fact that chitosan is known to lower the diffusion resistance of the stratum corneum and therefore enhance penetration into the skin (14). The reduced permeation of salicylic acid from the Car emulsion at pH 6 could also have been a result of the insoluble complex formation between whey–carrageenan and salicylic acid, as demonstrated by the increased turbidity data (increase in absorbance from 0.45 cm−1 for whey–Car without salicylic acid to 3.31 cm−1 for whey–Car with salicylic acid) (Table III), resulting in a reduced amount of salicylic acid available for absorption.
CONCLUSION
This study showed that the type of polymer used as emulsifier in the preparation of emulsions, as well as the pH of the formulation, influenced the release, as well as the topical delivery of the active ingredient. More specifically, it was found that electrostatic interactions between the different emulsifiers of the emulsion droplets and salicylic acid influenced the release of the active from the emulsions. Depending on the charge of the emulsion droplets, introduced by alteration of the pH of the formulation, increased electrostatic interactions resulted in a reduced release of the active ingredient. Furthermore, the extent of ionization, together with the charge of the emulsion droplets, played an important role in the dermal and transdermal delivery of salicylic acid from the different emulsion formulations. It was indicated that an increase in emulsion droplet charge could result in an increase in electrostatic interaction between emulsion droplets, containing the active ingredient, and negatively charged skin, resulting in enhanced topical delivery.
ACKNOWLEDGMENTS
The authors would like to thank the North-West University for funding this project.
REFERENCES
- 1.Förster T, Von Rybinski W. Applications of emulsions. In: Binks BP, editor. Modern aspects of emulsion science. Cambridge: Royal Society of Chemistry; 1998. pp. 395–426. [Google Scholar]
- 2.Youenang Piemi MP, Korner D, Benita S, Marty JP. Positively and negatively charged submicron emulsions for enhanced topical delivery of antifungal drugs. J Control Release. 1999;58:177–187. doi: 10.1016/S0168-3659(98)00156-4. [DOI] [PubMed] [Google Scholar]
- 3.Frelichowska J, Bolzinger MA, Valour JP, Mouaziz H, Pelletier J, Chevalier Y. Pickering w/o emulsions: drug release and topical delivery. Int J Pharm. 2009;368:7–15. doi: 10.1016/j.ijpharm.2008.09.057. [DOI] [PubMed] [Google Scholar]
- 4.Förster M, Bolzinger MA, Ach D, Montagnac G, Briancon S. Ingredients tracking of cosmetic formulations in the skin: a confocal Raman microscopy investigation. Pharm Res. 2011;28:858–872. doi: 10.1007/s11095-010-0342-0. [DOI] [PubMed] [Google Scholar]
- 5.Oborska A, Arct J, Mojski M, Jaremko E. Influence of polyalcohols and surfactants on skin penetration of flavonoids from the emulsion. J Appl Cosmetol. 2004;22:35–42. [Google Scholar]
- 6.Dalvi UG, Zatz JL. Effect of nonionic surfactants on penetration of dissolved benzocaine through hairless mouse skin. J Soc Cosmet Chem. 1981;32:87–94. [Google Scholar]
- 7.McClements DJ. Structural design principles for improved food performance: nanolaminated biopolymer structures in foods. In: Huang Q, Given P, Qian M, editors. Micro/nanoencapsulation of active food ingredients. ACS Symposium Series 1007. Washington, DC: American Chemical Society; 2009. p. 3–34.
- 8.Cho YH, Decker EA, McClements DJ. Competitive adsorption of mixed anionic polysaccharides at the surfaces of protein-coated lipid droplets. Langmuir. 2009;25:2654–2660. doi: 10.1021/la8033287. [DOI] [PubMed] [Google Scholar]
- 9.Livney YD. Milk proteins as vehicles for bioactives. Curr Opin Colloid Interface Sci. 2010;15:73–83. doi: 10.1016/j.cocis.2009.11.002. [DOI] [Google Scholar]
- 10.Bouyer E, Mekhloufia G, Rosilio V, Grossiord JL, Agnely F. Proteins, polysaccharides and their complexes used as stabilizers for emulsions: alternatives to synthetic surfactants in the pharmaceutical field? Int J Pharm. 2012;436:359–378. doi: 10.1016/j.ijpharm.2012.06.052. [DOI] [PubMed] [Google Scholar]
- 11.He W, Tan Y, Tian Z, Chen L, Hu F, Wu W. Food protein-stabilized nanoemulsions as potential delivery systems for poorly water-soluble drugs: preparation, in vitro characterization and pharmacokinetics in rats. Int J Nanomedicine. 2011;6:521–533. doi: 10.2147/IJN.S17282. [DOI] [PMC free article] [PubMed] [Google Scholar]
- 12.Ru Q, Cho Y, Huang Q. Biopolymer-stabilized emulsions on the basis of interactions between β-lactoglobulin and ι-carrageenan. Front Chem Eng China. 2009;3:399–406. doi: 10.1007/s11705-009-0253-y. [DOI] [Google Scholar]
- 13.Rodríguez MS, Albertengo LA, Agulló E. Emulsification capacity of chitosan. Carbohydr Polym. 2002;48:271–276. doi: 10.1016/S0144-8617(01)00258-2. [DOI] [Google Scholar]
- 14.Lima EL, Muňoz LC, Harris RE, Caballero AMH. Potential applications of chitosan as a marine cosmeceutical. In: Kim SK, editor. Marine cosmeceuticals: trends and prospects. Boca Raton: CRC; 2012. pp. 319–333. [Google Scholar]
- 15.Guzey D, McClements DJ. Characterization of β-lactoglobulin–chitosan interactions in aqueous solutions: a calorimetry, light scattering, electrophoretic mobility and solubility study. Food Hydrocoll. 2006;20:124–131. doi: 10.1016/j.foodhyd.2005.03.009. [DOI] [Google Scholar]
- 16.Li Y, Hu M, Xiao H, Du Y, Decker EA, McClements DJ. Controlling the functional performance of emulsion-based delivery systems using multi-component biopolymer coatings. Eur J Pharm Biopharm. 2010;76:38–47. doi: 10.1016/j.ejpb.2010.05.004. [DOI] [PubMed] [Google Scholar]
- 17.Gu YS, Decker EA, McClements DJ. Influence of pH and ι-carrageenan concentration on physicochemical properties and stability of β-lactoglobulin-stabilized oil-in-water emulsions. J Agric Food Chem. 2004;52:3626–3632. doi: 10.1021/jf0352834. [DOI] [PubMed] [Google Scholar]
- 18.Fasano WJ, Manning LA, Green JW. Rapid integrity assessment of rat and human epidermal membranes for in vitro dermal regulatory testing: correlation of electrical resistance with tritiated water permeability. Toxicol In Vitro. 2002;16:731–740. doi: 10.1016/S0887-2333(02)00084-X. [DOI] [PubMed] [Google Scholar]
- 19.Shchukina EM, Shchukin DG. Layer-by-layer coated emulsion microparticles as storage and delivery tool. Curr Opin Colloid Interface Sci. 2012;17:281–289. doi: 10.1016/j.cocis.2012.06.003. [DOI] [Google Scholar]
- 20.Serajuddin ATM, Jarowski CI. Effect of diffusion layer pH and solubility on the dissolution rate of pharmaceutical acids and their sodium salts. II: Salicylic acid, theophylline, and benzoic acid. J Pharm Sci. 1985;74:148–154. doi: 10.1002/jps.2600740209. [DOI] [PubMed] [Google Scholar]
- 21.Smith JC, Irwin WJ. Ionization and the effect of absorption enhancers on transport of salicylic acid through silastic rubber and human skin. Int J Pharm. 2000;210:69–82. doi: 10.1016/S0378-5173(00)00561-5. [DOI] [PubMed] [Google Scholar]
- 22.Abdel-Mottaleb MMA, Moulari B, Beduneau A, Pellequer Y, Lamprecht A. Surface-charge-dependent nanoparticles accumulation in inflamed skin. J Pharm Sci. 2012;101:4231–4239. doi: 10.1002/jps.23282. [DOI] [PubMed] [Google Scholar]
- 23.Ghouchi Eskandar N, Simovic S, Prestidge CA. Nanoparticle coated submicron emulsions: sustained in-vitro release and improved dermal delivery of all-trans-retinol. Pharm Res. 2009;26:1764–1775. doi: 10.1007/s11095-009-9888-0. [DOI] [PubMed] [Google Scholar]