

Abstract
Accelerated in vitro release testing methodology has been developed as an indicator of product performance to be used as a discriminatory quality control (QC) technique for the release of clinical and commercial batches of biodegradable microspheres. While product performance of biodegradable microspheres can be verified by in vivo and/or in vitro experiments, such evaluation can be particularly challenging because of slow polymer degradation, resulting in extended study times, labor, and expense. Three batches of Leuprolide poly(lactic-co-glycolic acid) (PLGA) microspheres having varying morphology (process variants having different particle size and specific surface area) were manufactured by the solvent extraction/evaporation technique. Tests involving in vitro release, polymer degradation and hydration of the microspheres were performed on the three batches at 55°C. In vitro peptide release at 55°C was analyzed using a previously derived modification of the Weibull function termed the modified Weibull equation (MWE). Experimental observations and data analysis confirm excellent reproducibility studies within and between batches of the microsphere formulations demonstrating the predictability of the accelerated experiments at 55°C. The accelerated test method was also successfully able to distinguish the in vitro product performance between the three batches having varying morphology (process variants), indicating that it is a suitable QC tool to discriminate product or process variants in clinical or commercial batches of microspheres. Additionally, data analysis utilized the MWE to further quantify the differences obtained from the accelerated in vitro product performance test between process variants, thereby enhancing the discriminatory power of the accelerated methodology at 55°C.
KEY WORDS: accelerated in vitro release, biodegradable microspheres, modified Weibull equation (MWE), QC tool
INTRODUCTION
In the pharmaceutical sciences, there have been many advances in research on polymeric biodegradable microspheres fabricated using polylactide (PLA) and poly(d,l-lactide-co-glycolide), particularly as these dosage forms provide considerable advantages in comparison to conventional delivery systems (1–9). In addition to attributes such as biocompatibility, mechanical strength, and an extensive safety profile, these polymers also offer the possibility of sustained drug release over a large duration interval of time (weeks to months), eliminating the need for multiple dosing via conventional delivery forms and thereby, improving patient compliance. These features make biodegradable microspheres an attractive formulation vehicle to investigate and design suitable delivery platforms for a wide range of therapeutics.
Akin to conventional dosage forms, variation in a formulation or the manufacturing process are known to impact product properties of biodegradable microspheres especially as they are designed to be complex delivery systems (10). Literature cites the effects of controlling product performance by varying the manufacturing processes of these dosage forms (11). Further evidence describing the effects of manufacturing process control and its influence on product properties (surface area, internal morphology and drug distribution inside the microspheres) include the following: (1) method and rate of solvent removal, (2) dispersed phase/continuous phase ratio, (3) polymer concentration, and (4) emulsifier concentration in the inner water phase, which are cited in literature (12–18). Additional literature cites the relationship between product properties of biodegradable microspheres and their impact on product performance (19–24).
For conventional dosage forms like tablets, product performance is routinely evaluated by dissolution testing (25). Similarly, product performance of long acting dosage forms like biodegradable microspheres may be verified by in vivo and/or in vitro experiments. Compared to traditional oral dosage forms, evaluation of product performance for parenteral depot forms is challenging because of slow polymer degradation lending itself to prolonged study times, labor, and expense, especially with in vivo studies (26–30). While not as expensive as in vivo experiments, in vitro tests are primarily used for quality control (QC) release of clinical or commercial batches of microspheres. Among the major drawbacks of traditional in vitro testing include the time and labor required to run these tests, primarily due to the extended duration of action of these dosage forms and the fact that there are no compendial methods for in vitro testing of parenteral microspheres (31,32).
Recognizing the need for a quick, efficient, and effective approach to obtain in vitro test results, significant attention in this area has focused on methodology and implementation of accelerated tests to reduce the time to assess product performance from biodegradable microspheres (33–36). The notion of enhancing release rates has been central to understanding and achieving acceleration of in vitro release in biodegradable microspheres, i.e., by hastening polymer degradation using a variety of parameters such as temperature, buffer and pH, etc. (37–39). These reports confirm that accelerated studies provide information on drug release behavior in a shorter time (few hours to days) in comparison to a traditional in vitro study at 37°C. More recently, accelerated release of peptides and proteins from PLGA microspheres at elevated temperatures has also been shown to be predictive of real-time in vitro release at 37°C (34,36).
The principle of using accelerated testing to hasten drug release has also been successfully applied to the real-time dissolution behavior of oral controlled release tablets, resulting in a substantial reduction of analysis time in a QC setting (40–42). From these studies, it is evident that the effectiveness of an accelerated release methodology as a QC tool can be assessed by determining the robustness and discriminatory power of the procedure with respect to the in vitro release for a given product. Since accelerated release was conclusively established to be a predictor of real-time release at 37°C for biodegradable microsphere formulations (34,36), a correlation at a higher temperature, 55°C, would be very useful from a QC standpoint to expedite batch release of clinical and commercial batches and demonstrate that product performance is met. Once an accelerated test methodology has been optimized and established for a given product, in vitro release of subsequent batches can be compared to the original formulation.
Hence, in the present study, three batches of drug-loaded PLGA microspheres having varying morphology (process variants having different particle size and specific surface area) were prepared by utilizing the solvent extraction/evaporation technique. Leuprolide, a LHRH super-agonist, was selected as the model peptide as it has good aqueous solubility and is also stable at elevated temperatures (43). The microsphere process variants were characterized using several techniques such as particle size and morphology, surface area measurement, polymer hydration, and degradation. The impact of changes in the microsphere process variants was evaluated by assessing product performance via in vitro release study utilizing accelerated conditions. The data obtained from the in vitro study were further quantified using a new equation derived and termed as the modified Weibull equation (MWE). Results and discussions describe: (a) reproducibility and predictability of the accelerated experiments, (b) the discriminatory power of the accelerated release methodology, and (c) accuracy and goodness of fit of the MWE.
MATERIALS AND METHODS
Materials
PLGA of 50:50 (503H, molecular weight = 32 kDa) was obtained from Boehringer Ingelheim, Ingelheim, Germany. Lupron Depot® was purchased from TAP Pharmaceuticals. Polyvinyl alcohol was supplied by Sigma (Aldrich Chemical Company, USA). All solvents and other chemicals were of analytical grade.
Preparation of Microspheres
Three batches (formulations A, B, and C) of Leuprolide PLGA microspheres were used this study. Formulation A was prepared by a solvent extraction-evaporation method, as described previously (34). Briefly, a solution of Leuprolide in methanol was added to a 22% (w/w) solution of polymer in methylene chloride to form a clear solution (dispersed phase). The dispersed phase was injected into an aqueous solution containing 0.35% polyvinyl alcohol (continuous phase) at a 1:100 DP/CP ratio while mixing with a Silverson L4R mixer (Silverson machines, MA, USA) to form the Leuprolide PLGA microspheres. Formulations B and C (process variants) were prepared in a manner similar to formulation A, except at lower mixing speeds (2,000 and 800 rpm, respectively, vs formulation A at 4,000 rpm). After formation of the microspheres, the organic solvents were removed from the aqueous phase by stirring for 2 h at 40°C (12). The resulting Leuprolide PLGA microspheres were recovered by filtration, washed to remove traces of polyvinyl alcohol, separated by sieving, and freeze-dried overnight to ensure low moisture content.
Characterization
Particle Size Measurements
Particle size for formulation A was measured using a laser diffractometer (Malvern 2600c Particle Sizer, Malvern, UK). The average particle size was expressed as the volume mean diameter “Vmd” in micrometers. Particle sizes for formulations B and C were obtained by sieving and using sieve cuts between 106 and 125 μm for formulation B and > 300 μm for formulation C.
Particle Morphology
Surface morphology was measured by scanning electron microscopy (SEM) using a Hitachi Model S800 (Japan) after palladium/gold coating of the microsphere sample on an aluminum stub. Internal structure was studied by freezing the particles in liquid nitrogen and slicing with a razor blade. The resulting fractured specimens were coated with a palladium/gold coating and placed on an aluminum stub.
Surface Area Measurements
Surface area was measured by the Brunauer, Emmett, and Teller (BET) technique employing a Micromeritics Tristar 3000 instrument with nitrogen as the adsorption gas. The sample was degassed overnight under vacuum followed by nitrogen, prior to analysis. These data provided information on the porous network present in the microspheres.
Determination of Peptide Content and In Vitro Release
Peptide content (n = 3 per batch) was determined by weighing approximately 10 mg of drug-loaded microspheres and dissolving in 2 mL dimethylsulfoxide. The peptide was extracted by addition of 0.1 M acetate buffer (pH 4.0) to the organic phase followed by mixing for 1 h using a wrist-shaker. Peptide content in the aqueous phase was determined by a reversed phase gradient high-performance liquid chromatography (HPLC) technique using a Bondclone 10 C-18 column (3.9 × 300 mm, Phenomenex, Torrance, CA, USA), mobile phase consisting of 27% (v/v) acetonitrile, 0.1% trifluoroacetic acid at a flow rate of 1 mL/min, and UV detection at 220 nm.
Prior to assessing in vitro product performance, a few commonly used methods were reviewed from various research publications. Among those described, the “sample and separate” (SS) method is widely utilized in studies involving biodegradable microspheres as it provides a direct and reasonably accurate measurement of drug release. However, the SS method poses certain well-known challenges in regards to sampling and buffer replacement (44). A second method, the “continuous flow” (CF) method, has been cited as a technique to evaluate product performance (45,46). The CF method utilizes USP apparatus 4 or a few modifications to the compendial set-up. Although this technique offers advantages like continuous and convenient sampling, buffer replacement, etc., several drawbacks like variable flow rates due to filter clogging, cumbersome set-up issues, static charge of glass beads, and considerable validation with the instrumental set-up have been reported (46). Hence, the CF method was not used in this study.
A third technique, the novel dialysis method (NDM), has been demonstrated to be suitable for in vitro release assessment (47). Briefly, with the NDM, a suspension of the biodegradable microspheres is introduced into a commercially available dialyzer containing buffer (inner media), which is sealed and placed in a vessel containing buffer (outer media). Peptide is released from the microspheres into the inner media, after which it diffuses through the dialyzer into the outer media, from where it is sampled. The choice of a NDM as an in vitro technique is advantageous as it mimics in vivo conditions of microsphere immobilization, after subcutaneous or intramuscular administration (48). In addition, the use of a commercially available dialyzer reduces concerns with instrument validation, simplifies set-up requirements, and allows for ease of intermittent sampling and partial or total buffer replacement, at real-time and accelerated conditions (31). The minimal set-up requirements for in vitro assessment can be further extended to other tests, i.e. utilization of the NDM for evaluation of polymer hydration and/or degradation (refer to “Hydration of microspheres” and “Polymer degradation”), allowing for a deeper mechanistic understanding of the drug release phenomenon. These features confer distinct advantages to the NDM over other in vitro methods and hence, it was determined to be a suitable technique for this study.
Hence, in vitro release was assessed by suspending about 50 mg of microspheres in the commercially available dialyzer containing 0.1 M phosphate-buffered saline (PBS), pH 7.4, at 55°C (inner media). The dialyzer was transferred to a glass cylinder containing 0.1 M PBS, pH 7.4 (outer media), which was continuously stirred using a magnetic stir bar to prevent formation of an unstirred water layer at the outer dialyzing surface. Sampling occurred from the outer media followed by buffer replacement. Peptide release was assessed by a stability indicating isocratic reverse phase HPLC method with a C-18 column (3.9 × 300 mm, μBondapak, Waters, USA) using an acetonitrile–water mixture containing 0.1% trifluoroacetic acid at a flow rate of 1.1 mL/min and UV detection wavelength at 220 nm.
Modified Weibull Equation
The Weibull equation has been previously recommended as an approach to model and thereby characterize drug release from extended release dosage forms like biodegradable microspheres (49,50). The Weibull equation is utilized when one attempts to model drug release with delivery systems that illustrate:
Zero to low initial burst
Zero to minimal diffusion mediated release rate
Erosion dominated process coupled with minimal diffusive release rates.
Since all three attributes are commonly observed with polymeric systems prepared using PLGA, the Weibull function described in Eq. 1 is used to describe in vitro release data from biodegradable microspheres at real-time and accelerated conditions.
 |
1 |
In Eq. 1,
- X
percentage of drug released at time t
- α
scale factor corresponding to the apparent rate constant, and
- β
shape factor.
The various terms of the Weibull equation also provide an insight into the nature and extent of the in vitro release phenomenon. For example, the term X (percentage of drug released at time t) is complete when Xinf is equal to 100%, α defines the time scale of the process and β characterizes the shape of the curve as exponential (β = 1), sigmoid or S-shaped with upward curvature followed by a turning point (β > 1), or parabolic, with a higher initial slope and after that consistent with exponential (β < 1).
While the Weibull equation satisfactorily describes the drug release profile for most systems, it is unable to capture the characteristics of systems that show slight initial burst (3–5%) or more, i.e., Eq. 1 does not provide a good fit for the in vitro release data. For parenteral controlled delivery systems such as PLGA polymeric microspheres, burst release occurs due to surface-associated and/or unincorporated drug (34). In some cases, a high initial burst is necessary to provide a loading dose of drug in vivo. This is achieved by reducing the particle size (increasing surface area) or by addition of drug to the formulation, post-manufacture. After this initial bolus, drug release is controlled by hydration and erosion of the polymer matrix, for the desired duration of therapy. Hence, initial burst is an important element of the in vitro product performance test.
In a previous publication, attempts at: (1) normalizing the in vitro release data, and/or (2) eliminating the burst release, did not provide a good model fit (34). Hence, the Weibull equation was modified to include the initial burst and was noted to be successful in describing a tri-phasic sigmoidal drug release profile:
 |
2 |
Equation 2 is termed as the modified Weibull equation (MWE), where the variables X, t, α, and βare the same as given in Eq. 1. The parameter Xburst, an additional parameter, represents the percent burst release of peptide. In this paper, the MWE was used to assess the reproducibility and predictability of accelerated in vitro product performance within and between batches, and as a discriminatory tool to quantify differences in behavior of the process variants.
Hydration of Microspheres
The moisture uptake at 55°C in 0.1 M PBS, pH 7.4, was measured by a Brinkmann 684 KF Coulometer Metrohm. Sample preparation was similar to that described for in vitro release (refer to “Determination of Peptide Content and In Vitro Release”). At predetermined intervals, hydrated microsphere samples were vacuum filtered using a 0.65-μm filter and transferred to vials. One milliliter of anhydrous methanol was added, the vials sealed, and then intermittently shaken for 1 h. Samples of 5–10 μL of methanol were withdrawn from the vials using a syringe and injected into the titration vessel. The water content was measured in replicates of three using Eq. 3:
 |
3 |
where Ws is the mass of water in the sample, Wb is the mass of water in methanol, and M0 is the initial mass of the microspheres.
Polymer Degradation
Polymer degradation (n = 3 per time point) at 55°C in 0.1 M PBS, pH 7.4 was assessed by gel permeation chromatography (GPC). Fifty milligrams of peptide-loaded microspheres were transferred to the commercially available dialyzer (refer to “Determination of Peptide Content and In Vitro Release”) in a manner similar to that described in the in vitro release study. At predetermined intervals, the contents of the dialyzer were filtered (0.65 μm PVDF filters, Millipore, USA) and remaining microspheres collected, dried under vacuum at room temperature for at least 3 days and analyzed for molecular weight. The GPC system consisted of two Ultrastyragel columns connected in series (7.8 × 300 mm each, one with 104 Å pores and one with 103 Å pores), pump (Shimadzu LC-6A, Japan), UV detector set at λ = 210 nm (Shimadzu, Japan) and software to compute molecular weight distribution (Waters, Maxima 820, Milford, USA). Sample solutions in tetrahydrofuran (THF) at a concentration of 5 mg/mL were filtered through a 0.45 μm filter (Millipore, USA) before injection into the GPC system and were eluted with THF at 0.4 mL/min. The weight-average molecular weight of each sample was calculated using monodisperse polystyrene standards, Mw 1,000–50,000 Da.
RESULTS AND DISCUSSION
Particle Size Measurements
Table I shows that formulation A had the smallest particle size (mean size = 25 μm) measured using laser light diffraction. Formulations B and C, manufactured at two lower stirring speeds, were sieved to obtain particle sizes between 106 and 125 μm for formulation B, and >300 μm for formulation C. Since the particle size of formulations B and C, manufactured by an alteration in a process variable, differ greatly from formulation A, they were considered as process variants, suitable for evaluating the discriminatory power of the accelerated release methodology.
Table I.
Properties of Leuprolide PLGA Microspheres
| Formulation | A | B | C |
|---|---|---|---|
| Size (μm) | 25 | 106–125 | >300 |
| Peptide loading (%) | 14.32 ± 0.05 | 11.79 ± 0.06 | 12.58 ± 0.10 |
| Specific surface area (m2/g) | 0.2694 ± 0.003 | 0.1264 ± 0.001 | 0.0633 ± 0.001 |
Particle Morphology
It is well known that particle morphology of PLGA microspheres influences in vitro release or product performance at 37°C. As stated in the “Introduction,” a modification in the manufacturing process is known to impact microsphere morphology. For example, preparation temperature influenced the particle size of bovine serum albumin PLGA microspheres, as described by Yang et al. (11). In the same publication, real-time release studies on these microspheres confirmed that a greater initial burst was obtained from smaller particles, presumably due to an increase in the surface area of the microspheres. In addition, post-initial burst, varying drug release rates were observed and attributed to differences in preparation temperature and bulk density (11). Similar findings on the initial burst with paclitaxel PLLA microspheres having two size ranges, i.e., 1–15 μm and 35–105 μm, have been presented by Liggins et al. (24).
The scanning electron micrograph images for formulations A, B, and C are shown in Fig. 1. Microspheres of formulation A were spherical in the range of 10–50 μm, with a mean diameter of approximately 25 μm and relatively smooth surface containing a few small pores of varying size (Fig. 1, a1). Pore distribution on the surface was not uniform. The particles could not be fractured easily suggesting that the interior of the microspheres was not hollow, but could contain small void spaces internally (Fig. 1, a2). For formulation B, microspheres were spherical with a smooth non-porous surface (Fig. 1, b1). The particles fractured easily and appeared hollow internally, with a non-porous outer wall and highly porous internal wall (Fig. 1, b2). In comparison to formulation A, a greater void space in the interior of the microsphere was detected in formulation B. Particle size for formulation C was the largest (Fig. 1, c1). Most of the microspheres were nearly spherical with a smooth nonporous surface. Fractured particles were evident with hollow interiors and a few pores on the interior surface (Fig. 1, c2). SEM images of the fractured microspheres revealed a surface comprised of a single layered nonporous wall of thickness approximately 20 μm.
Fig. 1.
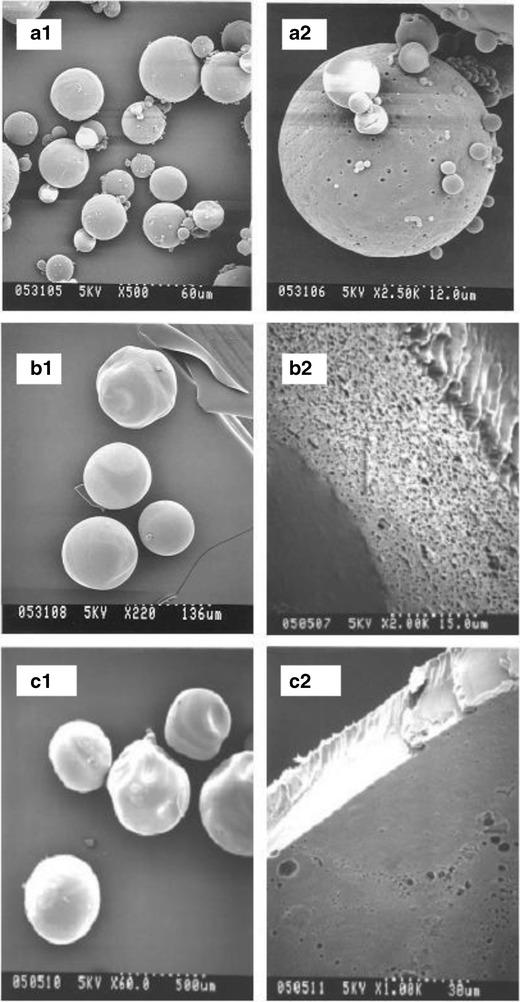
Scanning electron micrographs for formulations a, b, and c at two magnifications
Of the three microsphere batches, the particle size of formulation A was similar to the commercial product having one month duration in vivo and was selected as the reference (standard) batch for the accelerated in vitro release studies. Due to the difference in particle size and morphology, a difference in the in vitro product performance was expected, similar to previous results reported by Yang et al. and Liggins et al. (11,24).
Surface Area Measurements
Specific surface area (SSA) of the microspheres obtained by BET analysis was determined to be 0.2694, 0.1264 and 0.0633 m2/g for formulations A, B, and C, respectively. Data from the SSA measurement was in agreement with the SEM images in confirming that particle size, outer surface, and internal morphology for the three formulations were different.
Further, the surface area (SA) contributed by the internal porous network was calculated from the difference in particle size and internal structure of the formulations as follows:
All the microspheres from formulations B and C were assumed to be hollow spheres while the interior of microspheres from formulation A was considered non-hollow.
Using a mean diameter of 25, 106, and 300 μm (Table I), the outer surface area (4πr2, r = particle radius) for a single microsphere was determined to be 1.962 × 10⁻⁹, 3.528 × 10⁻⁸, and 2.82 × 10⁻⁷ m2, respectively.
The area contributed by the internal porous network was calculated as the difference between the SSA obtained by BET (Table I) and the total outer surface area (n4πr2) where n was the number of microspheres in the sample.
A difference of 0.0074, 0.0177, and 0.0109 m2 in the SA and the total outer surface area was obtained for formulations A, B, and C, respectively, implying that the SA contributed by the internal porous network was 11%, 55% and 68% for formulations A, B, and C, respectively. The presence of a porous network in PLGA microspheres is known to influence polymer hydration, thereby impacting degradation and drug release (51,52). In this study, the SSA results are in agreement with the SEM results where formulation A appeared relatively non-porous, while formulations B and C had a network of pores in the interior of the microspheres. Therefore, the SSA results can be a good predictor of product performance for the process variants.
Peptide Content and In Vitro Release
Peptide loading for all the formulations, as measured by HPLC, ranged from 12 to 14% (Table I). The real-time release profile (37°C) of Leuprolide from formulation A in 0.1 M PBS, pH 7.4, previously published (34), is shown in Fig. 2 (reproduced from (34)). Peptide release had a tri-phasic pattern with an initial burst followed by a diffusional phase (slow drug release) for approximately 7 days and then an increase in drug release rate to achieve completion in approximately 28 days. In addition, elevating the temperature to 55°C during the in vitro experiments shortened the drug release time to 3.5 days (Fig. 2), but showed no change in the drug release profile (initial burst, diffusional phase, and erosional drug release) (34). These results demonstrate that changing the temperature in this in vitro release experiment from 37°C to 55°C shortens the time course of the study from 28 to 3.5 days (i.e., eight-fold reduction in time). Additionally, the drug release profile at 55°C and 37°C are nearly superimposable, suggesting that an accelerated methodology using an elevated temperature of 55°C is predictive of real-time release at 37°C (34). Hence, this temperature was selected for comparing the in vitro product performance of the process variants, formulations B and C, with formulation A.
Fig. 2.
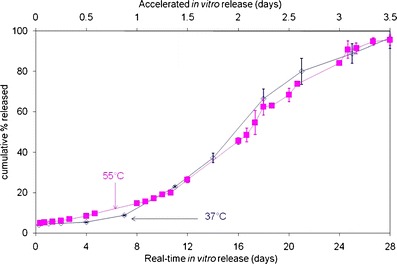
Correlation of accelerated release with real-time release (formulation A) (from (34))
Reproducibility of the Accelerated Release Method
In order to use the accelerated methodology as a quality control (QC) tool, the in vitro release test must establish reproducibility within and between lots of a batch. For a typical batch-to-batch release test, the in vitro release rate and profile are expected to be similar under real-time conditions. Results of the reproducibility study within a lot for formulation A using the accelerated release method (n = 3 per study) are plotted in Fig. 3. A similar burst was seen in all the profiles, followed by a slow diffusional component of in vitro release, and finally, an increase in drug release rate due to polymer erosion. Figure 3 establishes that results from the accelerated release at 55°C within a lot, are reproducible, and that sigmoidal or tri-phasic drug release is observed with all three lots of formulation A.
Fig. 3.
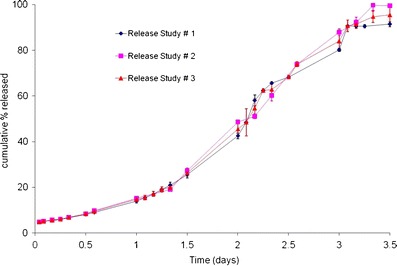
Reproducibility of accelerated release (within a lot) for formulation A
Reproducibility within lots was assessed by comparing the in vitro behavior of formulation A with that of two intended commercial formulations (designated as 1 and 2), at 55°C. Since formulation A is intended as a one month formulation, similar to commercial formulations 1 and 2, the in vitro performance is expected to be close to the marketed formulations. Figure 4 plots the reproducibility between lots where in vitro release from formulation A was compared with that of commercial formulations 1 and 2. From an initial burst that is comparable, the behavior of formulation A during the course of the in vitro release test at 55°C is similar to commercial formulations 1 and 2 and complete drug release is obtained in 3.5 days for all the formulations evaluated. Results from Figs. 3 and 4 validate the predictability and reproducibility of the accelerated in vitro product performance test at 55°C, within and between lots, thereby confirming that it can be successfully used as a QC tool for clinical or commercial microsphere batches.
Fig. 4.
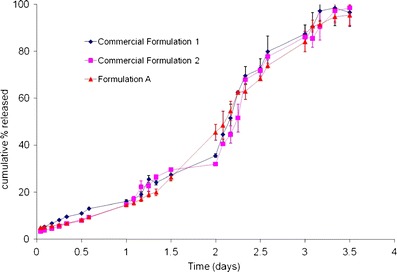
Reproducibility of accelerated release (between lots) for formulation A
Discriminatory Power of the Accelerated In Vitro Release Method
In this study, formulations A, B, and C are process variants and differed in size and morphology, and hence, a difference in the in vitro product performance was expected. Therefore, any change in initial burst, diffusional release and/or erosional phase of drug release is considered as a deviation from the product performance profile, i.e., formulation A, and is not desirable.
The results of the accelerated in vitro release study at 55°C are described in Fig. 5. At first glance, the differences in initial burst, diffusional release and erosion mediated drug release for the three process variants are quite apparent. Unlike formulation A, formulations B and C showed no initial burst at 4 h, which was presumed to be due to the larger particle size and low surface area of the latter formulations. The burst component of an in vitro release profile caused by surface associated peptide is known to be independent of temperature, whether real-time (37°C) or elevated (55°C) (34). Hence, the differences in initial burst between the three process variants at 55°C provide an early indication to the dissimilarities between these batches and could be used as a quality control criterion in itself.
Fig. 5.
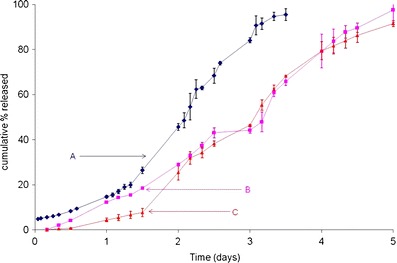
Accelerated release at 55°C in 0.1 M PBS, pH 7.4, for formulations A, B, and C (particle sizes: 25, 106–125 ,and > 300 μm, respectively)
It is well known that burst release provides an in vivo bolus dose and is particularly useful and desirable for some classes of drugs formulated as controlled release dosage forms. Likewise, due to the mechanism of action and pharmacologic effects of a LHRH super-agonist like Leuprolide, quantification of the initial burst is especially important (53). Administration of Leuprolide in vivo causes an initial testosterone spike or flare. This phenomenon has been well documented and is expected for a LHRH super-agonist (27,53). Absence of an initial burst with an LHRH super-agonist such as Leuprolide will significantly impact its pharmacodynamic effects in vivo. Hence, for formulations containing Leuprolide, the presence of initial burst or lack thereof is of noteworthy importance considering Leuprolide's in vivo activity. Therefore, continuing the in vitro release study at 55°C, post-initial burst, would only serve to highlight any additional differences in the process variants, i.e., any changes to the in vitro release rate and profile.
Figure 5 illustrates the continuation of accelerated release (after initial burst) at 55°C in 0.1 M PBS, pH 7.4, for formulations A, B, and C. Once hydrated, formulation B appeared to release the drug in a linear fashion until complete drug release was achieved in 5 days. On the other hand, formulation C showed a slow diffusional phase of drug release for almost 12 h, after which the drug release rate increased slowly through 36 h to around 8%. This was followed by a rapid increase in peptide release rate through 5 days, when drug release was complete. Visually, it is apparent that there are clear differences in the initial burst, diffusional component, and erosional phase of drug release with these process variants. Although complete Leuprolide release was achieved with all three process variants, the rate at which in vitro release occurred and the time taken to achieve 100% drug release was significantly different. Results obtained from Fig. 5 validate the robustness and discriminatory power of the accelerated test at 55°C, and its utility in distinguishing product performance, in process variants.
Modified Weibull Equation
In order to better understand and quantify any similarities or differences in the in vitro or in vivo product performance, it is advantageous to use a mathematical model that can ably discern the dissolution data. Among the two commonly used methodologies, i.e., the “model-dependent” and the “model-independent” approach, the former offers great merits, and is particularly useful for “data rich” scenarios such as in vitro dissolution experiments. The “model-dependent” approach has also been used to describe sigmoidal drug release patterns in a variety of dosage forms (50,54,55). For biodegradable microspheres that show a similar tri-phasic sigmoidal drug release profile, the “model-dependent” approach has been successfully used to illustrate the similarities and differences at real-time and accelerated temperatures (34). In particular, the three aspects that contribute to tri-phasic drug release (i.e., initial burst, diffusional followed by erosional drug release) at real-time and accelerated conditions, were well defined and quantified. The MWE has been derived and shown to successfully capture all aspects of the in vitro release profile, at real-time and accelerated conditions, as it describes the initial burst (Xburst), rate of the reaction (α) and shape of the in vitro release profile (β), for biodegradable microspheres (34).
Using the MWE approach, as reported previously, in vitro release at 55°C was shown to be mathematically and statistically similar to real-time release at 37°C (34). From Fig. 2, it is evident that the accelerated and real-time in vitro release profiles are nearly overlapping. The data in Table III (data for formulation A is reproduced from (34)) confirms that this is indeed the case. The mean value of β under real-time conditions (2.757) was comparable to that obtained under accelerated conditions (2.776), suggesting that the shape of the drug release profiles, albeit at different temperatures (37 and 55°C), were indistinct from the results shown in Fig. 2 with an overall goodness of fit R2 > 0.99, thus confirming a strong statistical correlation.
Table III.
Comparison of Accelerated Release Between Process Variants (Formulations A, B, and C) Using MWE
| Parameter | 37°C, formulation A (size, ∼25 μm) | 55°C | ||
|---|---|---|---|---|
| Formulation A (size, ∼25 μm) | Formulation B (particle size, 106–125 μm) | Formulation C (particle size, >300 μm) | ||
| α (day−1) | 3.121 × 10⁻⁴ | 0.07816 | 0.04378 | 0.04948 |
| Standard error (α) | 1.337 × 10⁻⁵ | 0.005209 | 0.0105 | 0.05960 |
| 95% CI (α) | 3.743 × 10⁻⁶–6.024 × 10⁻⁴ | 0.06736–0.08896 | 0.02236–0.06519 | 0.03691–0.06206 |
| β | 2.757 | 2.776 | 2.441 | 2.483 |
| Standard error (β) | 0.1438 | 0.06379 | 0.1572 | 0.8518 |
| 95% CI (β) | 2.425–3.089 | 2.644–2.908 | 2.109–2.772 | 2.304–2.663 |
| X burst | 3.278 | 5.84 | 5.574 | −0.8027 |
| Standard error (X burst) | 1.121 | 0.5713 | 1.944 | 1.081 |
| 95% CI (X burst) | 0.6932–5.864 | 4.656–7.025 | 1.473–9.676 | −3.083–1.478 |
| R 2 | 0.9965 | 0.9978 | 0.9849 | 0.9955 |
Results of model fit for formulation A with two intended commercial formulations using the MWE are provided in Fig. 6 and Table II. The goodness of fit (R2) for the analyses of formulation A and commercial formulations 1 and 2 was > 0.99 and reconfirmed the excellent statistical correlation obtained with the accelerated methodology. The mean values of α for commercial formulations 1 and 2 (0.06894 and 0.06849 day−1) were comparable to formulation A (0.07816 day−1) and were well within the 95% confidence interval (CI) (0.06736–0.08896 day−1) of the α value for formulation A. Likewise, values of the shape parameter (β) for the commercial formulations 1 and 2 were 2.879 and 2.814, respectively, and were similar to that obtained for formulation A (2.776). The mean values of β lay within the 95% CI for formulation A (2.644 – 2.908), implying that the shape of the accelerated in vitro release profiles for commercial formulations 1 and 2 were akin to that of formulation A. Furthermore, a comparison of Xburst for commercial formulations 1 and 2 (6.418% and 6.243%, respectively) with formulation A (5.840%) revealed that the burst release was virtually indistinguishable for the three batches. This implied that there was no statistical difference in the in vitro release behavior of the three batches. Applying the MWE to the in vitro release data shown in Fig. 3 (within lot) yielded comparable results (data not shown). The results of the model fit confirmed that the reproducibility of the accelerated test method within and between lots and established suitability of using the MWE as a mathematical and statistical tool to evaluate in vitro release data.
Fig. 6.
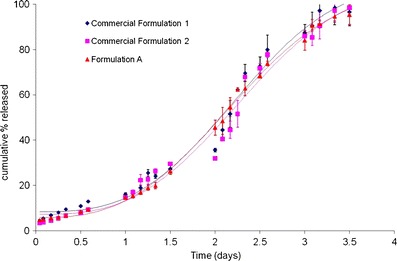
Results of model fit for formulation A with two intended commercial formulations using the modified Weibull equation (MWE)
Table II.
Comparison of Accelerated Release Between Lots (Formulation A, Commercial Formulations 1 and 2) Using MWE
| Parameter | 55°C, 0.1 M PBS pH 7.4 | ||
|---|---|---|---|
| Formulation Aa | Commercial formulation 1 | Commercial formulation 2 | |
| α (day−1) | 0.07816 | 0.06894 | 0.06849 |
| Standard error (α) | 0.005209 | 0.00651 | 0.008923 |
| 95% CI (α) | 0.06736 –0.08896 | 0.03830–0.08757 | 0.03251–0.09246 |
| β | 2.776 | 2.879 | 2.814 |
| Standard error (β) | 0.06379 | 0.08351 | 0.07523 |
| 95% CI (β) | 2.644–2.908 | 2.599–3.359 | 2.460–2.908 |
| X burst | 5.84 | 6.418 | 6.243 |
| Standard error (X burst) | 0.5713 | 0.8752 | 0.6774 |
| 95% CI (X burst) | 4.656–7.025 | 5.375–8.46 | 3.507–8.51 |
| R 2 | 0.9978 | 0.9982 | 0.9964 |
aParticle size: 25 µm
As with formulation A, the MWE was used to model the accelerated in vitro release data from process variants, formulations B and C. Results of this analysis are summarized in Table III. Plots of the MWE model fit for formulations A, B, and C at 55°C in 0.1 M PBS, pH 7.4, are described in Fig. 7. The goodness of fit (R2) for formulation B and C was 0.9849 and 0.9955, respectively. The mean value of 'α' for formulation B (0.04378 day−1) and C (0.04948 day−1) are comparable to each other, but are different from formulation A and were not within the 95% C.I. described by the model fit for formulation A at 55°C (0.06736 – 0.08896 day-1). The larger 'α' values for formulations B and C are not surprising considering that the complete drug release occurred within 5 days for both process variants, thus impacting the drug release rate constant. Similar results were obtained upon comparison of β values for formulations B (2.441) and C (2.483) with the 95% CI for formulation A at 55°C (2.644–2.908). Since the mean values of the rate α and the shape parameter β obtained after MWE model fit for formulations B and C could not be included in the 95% CI for formulation A at 55°C (and thereby 37°C), it was presumed that that the process variants were statistically different from that at 37°C. Results obtained from Fig. 7 and Table III validate the utility of the MWE in quantifying the differences obtained from the in vitro product performance test between process variants, thereby enhancing the discriminatory power of the accelerated methodology at 55°C.
Fig. 7.
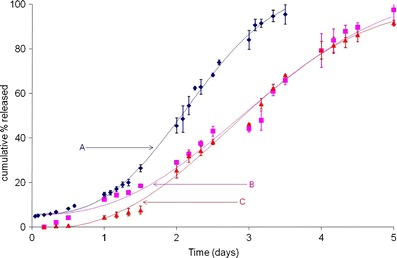
Model fit using the MWE for formulations A, B, and C (process variants) at 55°C in 0.1 M PBS, pH 7.4 (particle sizes: 25, 106–125, and >300 μm, respectively)
Hydration of Microspheres
Differences in accelerated in vitro release profiles for formulations A, B, and C were assumed to be a consequence of the varying SSA for these process variants causing differences in hydration (refer to “Surface Area Measurements”). In order to mimic polymer hydration at in vitro release conditions at 55°C, the study was performed using the NDM set-up, similar to that described for in vitro release (refer to “Peptide Content and In Vitro Release”). At predetermined time-points, water uptake for the process variants was measured using Karl Fischer analysis (Fig. 8). Water uptake for formulation A, which had the smallest particle size, was nearly 47% within 4 h. Surprisingly, hydration values for formulation B were similar to that for formulation A. Given that the pore volume for both batches was similar, the difference can be ascribed to water residing in the pores and trapped in the void spaces of the microspheres for formulation B, while for formulation A, more of the water was associated with the surface. For formulation C, water uptake during this period was around 31%. After the 4 h time-point, hydration rate at days 1, 2, and 3 days for formulation A (∼94%) was much faster than formulations B or C. The latter formulations showed an increase in water uptake at day 1 after which a plateau was observed through day 3.
Fig. 8.
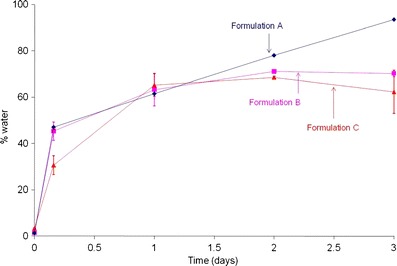
Hydration of formulations A, B, and C at 55°C in 0.1 M PBS, pH 7.4 (particle sizes: 25, 106–125, and >300 μm, respectively)
In contrast to the in vitro release data at day 1 (not more than 15% drug release), the moisture uptake experiments suggest that polymer hydration in all process variants was rapid (∼60% water update in 1 day). After day 1, the rate of water uptake was not as steep, but a sharp increase in the in vitro release was observed. This suggests that the rapid water uptake causes polymer hydration, which in turn leads to polymer degradation.
The results from the hydration study and the in vitro product performance test can be explained and attributed to the plasticizing effects of water. The effects of moisture on neat PLGA polymer have been well established and reported in a previous publication (56), where the manner in which the presence of water initiates polymer degradation has been described. Since initial polymer hydration in the Leuprolide PLGA microspheres was rapid combined with the fact water is a known plasticizer of the neat PLGA polymer, the findings from this hydration study suggest that similar effects are to be expected upon moisture uptake in the Leuprolide microspheres formulated using a PLGA polymer, and also corroborated findings from the previous study. This is particularly important because once hydrated, it should be noted that even a small amount of water retained in the polymer matrix can cause hydrolytic degradation thereby increasing the number of carboxylic end groups in PLGA, causing further acidification of the internal microenviroment leading to polymer autocatalysis over time (57). For formulations A, B, and C, rapid hydration through day 1 led to plasticization of the PLGA polymer, after which polymer autocatalysis and hydrolytic degradation would commence. The results from the hydration experiment using the NDM set-up are consistent with the data obtained from the accelerated in vitro release study (described in Discriminatory Power of the Accelerated In Vitro Release Method).
Polymer Degradation
Change in molecular weight for formulations A, B, and C at 55°C in 0.1 M PBS, pH 7.4, as measured by GPC, is plotted in Fig. 9. Similar to the hydration and in vitro release experiments, polymer degradation studies were performed using the NDM set-up (refer to “Peptide Content and In Vitro Release”). A slight decrease in polymer molecular weight (32 kDa to 29 and 27 kDa for formulations B and C, respectively) was observed, post-manufacture. This small loss of molecular weight was attributed to polymer hydrolysis during manufacturing of the microspheres, and was not unexpected.
Fig. 9.
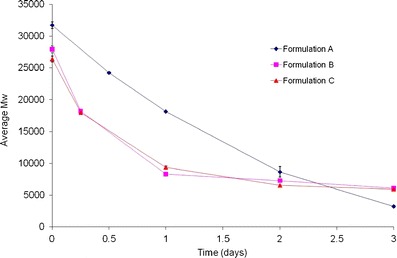
Change in molecular weight for formulations A, B, and C at 55°C in 0.1 M PBS, pH 7.4 (Particle sizes: 25, 106–125, and >300 μm, respectively
From Fig. 9, it was observed that on day 1, formulations B and C showed a rapid decrease in molecular weight (∼70%) unlike formulation A where the drop was less pronounced (∼40%). After day 1, polymer molecular weight loss continued steadily for formulation A, but appeared to plateau with formulations B and C. The drop in polymer molecular weight can be attributed to rapid hydration leading to degradation at 55°C. The data obtained for formulations B and C were not unusual as the internal structure of these microspheres was hollow and porous (refer to “Surface Area Measurements”). Regardless of the extent in molecular weight decrease by day 1, the amount of in vitro release was not more than 15% for any of the formulations. This was attributed to diffusional drug release, i.e., zero to minimal mass loss (data not shown). Since mass loss did not occur by day 1, the amount of peptide release was low. Continued decrease in molecular weight caused loss in polymer mass leading to a sharp increase in peptide release after day 1. As expected, faster mass loss was observed with formulation A (when compared with formulations B and C) and led to complete in vitro release in 3.5 days.
In general, polymer degradation followed first order kinetics for all the formulations. For formulation A, polymer degradation rate was 0.9493 day−1. For formulations B and C, the rates of degradation were similar, 1.0851 and 1.1128 day−1, respectively. The degradation rate constants for the process variants (formulations B and C) were expected and correlated well with the data obtained from the in vitro release test at 55°C implying that a change in the manufacturing process will impact properties of the final formulation, resulting in an alteration in the rate of degradation kinetics of the polymer as well as product performance for process variants. Overall, the results obtained from the polymer degradation study further confirms observations from the accelerated in vitro release test at 55°C and data from the model fit using MWE.
CONCLUSIONS
Accelerated testing on long-acting dosage forms like biodegradable microspheres is an area of study that shows much promise. In this study, the accelerated test methodology was instrumental in characterizing and discriminating the in vitro release profile (initial burst, diffusional, and erosional drug release) observed with the process variants as well as validating robustness and reproducibility between and within lots of a batch, confirming that the devised technique can be utilized as a Quality Control tool to illustrate any variation in clinical and commercial batches. There was excellent agreement between the SEM images and BET results, specifically in that polymer morphology and internal porosity were well described. A “model-dependent” approach (MWE) also aided the QC test by imparting reliable information on the discriminatory nature of the accelerated in vitro test with respect to process variants and also provided a measure of quantifying similarities between and within batches. A strong statistical correlation and an excellent goodness of fit (R2 > 0.99) was obtained for nearly all the analyses. The experimental studies in this publication demonstrate that results obtained from accelerated in vitro tests can be successfully utilized to distinguish process variants and provide crucial information regarding product performance in a significantly short time period of a few hours to a few days. Study findings confirm the usefulness of the accelerated release methodology as a QC tool and as a technique to evaluate product performance from long-acting dosage forms and shows great potential to provide researchers rapid and reliable information towards designing and developing polymeric matrices as drug delivery systems.
ACKNOWLEDGMENTS
The research described in this manuscript was performed while the authors were affiliated with the University of Kentucky, Lexington, KY, USA. The authors wish to thank Oakwood Labs, Oakwood, OH, USA, and the Graduate School, University of Kentucky, Lexington, KY, USA, for their financial support.
REFERENCES
- 1.Han B, Wang H-T, Liu H-Y, Hong H, Lv W, Shang Z-H. Preparation of pingyangmycin PLGA microspheres and related in vitro/in vivo studies. Int J Pharm. 2010;398(1–2):130–136. doi: 10.1016/j.ijpharm.2010.07.045. [DOI] [PubMed] [Google Scholar]
- 2.Sun F, Sui C, Teng L, Liu X, Teng L, Meng Q, et al. Studies on the preparation, characterization and pharmacological evaluation of tolterodine PLGA microspheres. Int J Pharm. 2010;397(1–2):44–49. doi: 10.1016/j.ijpharm.2010.06.042. [DOI] [PubMed] [Google Scholar]
- 3.Kim TH, Jiang HH, Park CW, Youn YS, Lee S, Chen X, et al. PEGylated TNF-related apoptosis-inducing ligand (TRAIL)-loaded sustained release PLGA microspheres for enhanced stability and antitumor activity. J Control Release. 2011;150(1):63–69. doi: 10.1016/j.jconrel.2010.10.037. [DOI] [PubMed] [Google Scholar]
- 4.He J, Feng M, Zhou X, Ma S, Jiang Y, Wang Y, et al. Stabilization and encapsulation of recombinant human erythropoietin into PLGA microspheres using human serum albumin as a stabilizer. Int J Pharm. 2011;416(1):69–76. doi: 10.1016/j.ijpharm.2011.06.008. [DOI] [PubMed] [Google Scholar]
- 5.Ratajczak-Enselme M, Estebe J-P, Dollo G, Chevanne F, Bec D, Malinovsky J-M, et al. Epidural, intrathecal and plasma pharmacokinetic study of epidural ropivacaine in PLGA-microspheres in sheep model. Eur J Pharm Biopharm. 2009;72(1):54–61. doi: 10.1016/j.ejpb.2008.11.003. [DOI] [PubMed] [Google Scholar]
- 6.Umeki N, Sato T, Harada M, Takeda J, Saito S, Iwao Y, et al. Preparation and evaluation of biodegradable microspheres containing a new potent osteogenic compound and new synthetic polymers for sustained release. Int J Pharm. 2010;392(1–2):42–50. doi: 10.1016/j.ijpharm.2010.03.020. [DOI] [PubMed] [Google Scholar]
- 7.Sun L, Zhou S, Wang W, Li X, Wang J, Weng J. Preparation and characterization of porous biodegradable microspheres used for controlled protein delivery. Colloids Surf A Physicochem Eng Asp. 2009;345(1–3):173–181. doi: 10.1016/j.colsurfa.2009.04.053. [DOI] [Google Scholar]
- 8.Jiang W, Gupta RK, Deshpande MC, Schwendeman SP. Biodegradable poly(lactic-co-glycolic acid) microparticles for injectable delivery of vaccine antigens. Adv Drug Deliv Rev. 2005;57(3):391–410. doi: 10.1016/j.addr.2004.09.003. [DOI] [PubMed] [Google Scholar]
- 9.D’Souza S, Faraj JA, Giovagnoli S, DeLuca PP. Preparation, characterization and in vivo evaluation of Olanzapine Poly(D,L-lactide-co-glycolide) (PLGA) microspheres. J Pharm. 2013:article 831381. [DOI] [PMC free article] [PubMed]
- 10.Tice TR, Gilley RM. Preparation of injectable controlled-release microcapsules by a solvent-evaporation process. J Control Release. 1985;2:343–352. doi: 10.1016/0168-3659(85)90056-2. [DOI] [Google Scholar]
- 11.Yang Y-Y, Chung T-S, Bai X-L, Chan W-K. Effect of preparation conditions on morphology and release profiles of biodegradable polymeric microspheres containing protein fabricated by double-emulsion method. Chem Eng Sci. 2000;55(12):2223–2236. doi: 10.1016/S0009-2509(99)00503-5. [DOI] [Google Scholar]
- 12.Jeyanthi R, Thanoo BC, Mehta RC, DeLuca PP. Effect of solvent removal technique on the matrix characteristics of polylactide/glycolide microspheres for peptide delivery. J Control Release. 1996;38(2–3):235–244. doi: 10.1016/0168-3659(95)00125-5. [DOI] [Google Scholar]
- 13.Li W-I, Anderson KW, Mehta RC, Deluca PP. Prediction of solvent removal profile and effect on properties for peptide-loaded PLGA microspheres prepared by solvent extraction/ evaporation method. J Control Release. 1995;37(3):199–214. doi: 10.1016/0168-3659(95)00076-3. [DOI] [Google Scholar]
- 14.Li W-I, Anderson KW, Deluca PP. Kinetic and thermodynamic modeling of the formation of polymeric microspheres using solvent extraction/evaporation method. J Control Release. 1995;37(3):187–198. doi: 10.1016/0168-3659(95)00077-1. [DOI] [Google Scholar]
- 15.Chung T-W, Huang Y-Y, Tsai Y-L, Liu Y-Z. Effects of solvent evaporation rate on the properties of protein-loaded PLLA and PDLLA microspheres fabricated by emulsion-solvent evaporation process. J Microencapsul. 2002;19(4):463–471. doi: 10.1080/02652040210140706. [DOI] [PubMed] [Google Scholar]
- 16.Crotts G, Park TG. Preparation of porous and nonporous biodegradable polymeric hollow microspheres. J Control Release. 1995;35(2–3):91–105. doi: 10.1016/0168-3659(95)00010-6. [DOI] [Google Scholar]
- 17.Mehta RC, Jeyanthi R, Calis S, Thanoo BC, Burton KW, DeLuca PP. Biodegradable microspheres as depot system for parenteral delivery of peptide drugs. J Control Release. 1994;29(3):375–384. doi: 10.1016/0168-3659(94)90082-5. [DOI] [Google Scholar]
- 18.Ehtezazi T, Washington C. Controlled release of macromolecules from PLA microspheres: using porous structure topology. J Control Release. 2000;68(3):361–372. doi: 10.1016/S0168-3659(00)00270-4. [DOI] [PubMed] [Google Scholar]
- 19.O’Donnell PB, McGinity JW. Preparation of microspheres by the solvent evaporation technique. Adv Drug Deliv Rev. 1997;28(1):25–42. doi: 10.1016/S0169-409X(97)00049-5. [DOI] [PubMed] [Google Scholar]
- 20.Bodmeier R, McGinity JW. The preparation and evaluation of drug-containing poly(dl-lactide) microspheres formed by the solvent evaporation method. Pharm Res. 1987;4(6):465–471. doi: 10.1023/A:1016419303727. [DOI] [PubMed] [Google Scholar]
- 21.Berkland C, Kipper MJ, Narasimhan B, Kim KK, Pack DW. Microsphere size, precipitation kinetics and drug distribution control drug release from biodegradable polyanhydride microspheres. J Control Release. 2004;94(1):129–141. doi: 10.1016/j.jconrel.2003.09.011. [DOI] [PubMed] [Google Scholar]
- 22.Berkland C, Kim KK, Pack DW. PLG microsphere size controls drug release rate through several competing factors. Pharm Res. 2003;20(7):1055–1062. doi: 10.1023/A:1024466407849. [DOI] [PubMed] [Google Scholar]
- 23.Berkland C, King M, Cox A, Kim KK, Pack DW. Precise control of PLG microsphere size provides enhanced control of drug release rate. J Control Release. 2002;82(1):137–147. doi: 10.1016/S0168-3659(02)00136-0. [DOI] [PMC free article] [PubMed] [Google Scholar]
- 24.Liggins RT, Burt HM. Paclitaxel loaded poly(l-lactic acid) (PLLA) microspheres: II. The effect of processing parameters on microsphere morphology and drug release kinetics. Int J Pharm. 2004;281(1–2):103–106. doi: 10.1016/j.ijpharm.2004.05.027. [DOI] [PubMed] [Google Scholar]
- 25.Uppoor VRS. Regulatory perspectives on in vitro (dissolution)/in vivo (bioavailability) correlations. J Control Release. 2001;72(1–3):127–132. doi: 10.1016/S0168-3659(01)00268-1. [DOI] [PubMed] [Google Scholar]
- 26.Ramstack M, Grandolfi G, Mannaert E. Long-acting Risperidone: prolonged release injectable delivery of Risperidone using Medisorb microsphere technology. Biol Psychiatry. 2003;53(8 Suppl 1):Abstract 547.
- 27.Woo BH, Na K-H, Dani BA, Jiang G, Thanoo BC, DeLuca PP. In vitro characterization and in vivo testosterone suppression of 6-month release poly(D, L-Lactide) leuprolide microspheres. Pharm Res. 2002;19(4):546–550. doi: 10.1023/A:1015168301339. [DOI] [PubMed] [Google Scholar]
- 28.D’Souza SS, Selmin F, Murty SB, Qiu W, Thanoo BC, DeLuca PP. Assessment of fertility in male rats after extended chemical castration with a GnRH antagonist. AAPS PharmSci. 2004;6(1):94–9. [DOI] [PMC free article] [PubMed]
- 29.Burgess DJ, Hussain AS, Ingallinera TS, Chen ML. Assuring quality and performance of sustained and controlled release parenterals: workshop report. AAPS PharmSci. 2002;4(2):E7. doi: 10.1208/ps040205. [DOI] [PMC free article] [PubMed] [Google Scholar]
- 30.Okada H. One- and three-month release injectable microspheres of the LH-RH superagonist leuprorelin acetate. Adv Drug Deliv Rev. 1997;28(1):43–70. doi: 10.1016/S0169-409X(97)00050-1. [DOI] [PubMed] [Google Scholar]
- 31.D’Souza SS, DeLuca PP. Methods to assess in vitro drug release from injectable polymeric particulate systems. Pharm Res. 2006;23(3):460–474. doi: 10.1007/s11095-005-9397-8. [DOI] [PubMed] [Google Scholar]
- 32.Burgess DJ, Crommelin DJA, Hussain AS, Chen M-L. Assuring quality and performance of sustained and controlled release parenterals. Eur J Pharm Sci. 2004;21(5):679–690. doi: 10.1016/j.ejps.2004.03.001. [DOI] [PubMed] [Google Scholar]
- 33.Shameem M, Lee H, DeLuca PP. A short term (accelerated release) approach to evaluate peptide release from PLGA depot-formulations. AAPS PharmSci. 1999;1(3):E7. [DOI] [PMC free article] [PubMed]
- 34.D’Souza SS, Faraj JA, DeLuca PP. A model-dependent approach to correlate accelerated with real-time release from biodegradable microspheres. AAPS PharmSciTech. 2005;6(4):E553–64. [DOI] [PMC free article] [PubMed]
- 35.Makino K, Arakawa M, Kondo T. Preparation and in vitro degradation properties of polylactide microcapsules. Chem Pharm Bull. 1985;33(3):1195–1201. doi: 10.1248/cpb.33.1195. [DOI] [PubMed] [Google Scholar]
- 36.Park EJ, Na DH, Lee KC. In vitro release study of mono-PEGylated growth hormone-releasing peptide-6 from PLGA microspheres. Int J Pharm. 2007;343(1–2):281–283. doi: 10.1016/j.ijpharm.2007.06.005. [DOI] [PubMed] [Google Scholar]
- 37.Aso Y, Yoshioka S, Li Wan Po A, Terao T. Effect of temperature on mechanisms of drug release and matrix degradation of poly(D, L-lactide) microspheres. J Control Release. 1994;31(1):33–39. doi: 10.1016/0168-3659(94)90248-8. [DOI] [Google Scholar]
- 38.Bergsma JE, Rozema FR, Bos RRM, Boering G, de Bruijn WC, Pennings AJ. In vivo degradation and biocompatibility study of in vitro pre-degraded as-polymerized polylactide particles. Biomaterials. 1995;16(4):267–274. doi: 10.1016/0142-9612(95)93253-A. [DOI] [PubMed] [Google Scholar]
- 39.Buchholz B. Accelerated degradation test on resorbable polymers. Degradation phenomena of polymeric biomaterials. New York: Springer; 1992. p. 67. [Google Scholar]
- 40.Zackrisson G, Ostling G, Skagerberg B, Anfalt T. Accelerated dissolution rate analysis (ACDRA) for controlled release drugs. Application to Roxiam(R) J Pharm Biomed Anal. 1995;13(4–5):377–383. doi: 10.1016/0731-7085(95)01293-T. [DOI] [PubMed] [Google Scholar]
- 41.Quist P-O, Ostling G. Accelerated dissolution testing for improved quality assurance. J Pharm Biomed Anal. 2002;28(6):1081–1089. doi: 10.1016/S0731-7085(02)00048-1. [DOI] [PubMed] [Google Scholar]
- 42.Ertan G, Karasulu E, Özgüney I, Karasulu Y, Apaydın Ş, Kantarcı G, et al. Acceleration of in vitro dissolution studies of sustained release dosage form of theophylline and in vitro–in vivo evaluations in terms of correlations. Eur J Drug Metab Pharmacokinet. 2011;36(4):243–248. doi: 10.1007/s13318-011-0049-6. [DOI] [PubMed] [Google Scholar]
- 43.Hall SC, Tan MM, Leonard JJ, Stevenson CL. Characterization and comparison of leuprolide degradation profiles in water and dimethyl sulfoxide. J Pept Res. 1999;53(4):432–441. doi: 10.1034/j.1399-3011.1999.00069.x. [DOI] [PubMed] [Google Scholar]
- 44.D’Aurizio E, van Nostrum CF, van Steenbergen MJ, Sozio P, Siepmann F, Siepmann J, et al. Preparation and characterization of poly(lactic-co-glycolic acid) microspheres loaded with a labile antiparkinson prodrug. Int J Pharm. 2011;409(1–2):289–296. doi: 10.1016/j.ijpharm.2011.02.036. [DOI] [PubMed] [Google Scholar]
- 45.Aubert-Pouessel A, Bibby DC, Venier-Julienne M-C, Hindre F, Benoit J-P. A novel in vitro delivery system for assessing the biological integrity of protein upon release from PLGA microspheres. Pharm Res. 2002;19(7):1046–1051. doi: 10.1023/A:1016482809810. [DOI] [PubMed] [Google Scholar]
- 46.Rawat A, Stippler E, Shah VP, Burgess DJ. Validation of USP apparatus 4 method for microsphere in vitro release testing using Risperdal® Consta®. Int J Pharm. 2011;420(2):198–205. doi: 10.1016/j.ijpharm.2011.08.035. [DOI] [PubMed] [Google Scholar]
- 47.D’Souza SS, DeLuca PP. Development of a dialysis in vitro release method for biodegradable microspheres. AAPS PharmSciTech. 2005;6(2):E323–8. [DOI] [PMC free article] [PubMed]
- 48.Gray V. An interview with Professor Patrick DeLuca and Dr. Susan D’Souza on a novel in vitro technique. Dissolution Technol. 2006;13:21–23. [Google Scholar]
- 49.Siewert M, Dressman J, Brown CK, Shah VP. FIP/AAPS guidelines to dissolution/in vitro release testing of novel/special dosage forms. AAPS PharmSciTech. 2003;4(1):E7. [DOI] [PMC free article] [PubMed]
- 50.Sathe PM, Tsong Y, Shah VP. In vitro dissolution profile comparison: statistics and analysis, model dependent approach. Pharm Res. 1996;13(12):1799–1803. doi: 10.1023/A:1016020822093. [DOI] [PubMed] [Google Scholar]
- 51.Braunecker J, Baba M, Milroy GE, Cameron RE. The effects of molecular weight and porosity on the degradation and drug release from polyglycolide. Int J Pharm. 2004;282(1–2):19–34. doi: 10.1016/j.ijpharm.2003.08.020. [DOI] [PubMed] [Google Scholar]
- 52.Klose D, Siepmann F, Elkharraz K, Krenzlin S, Siepmann J. How porosity and size affect the drug release mechanisms from PLGA-based microparticles. Int J Pharm. 2006;314(2):198–206. doi: 10.1016/j.ijpharm.2005.07.031. [DOI] [PubMed] [Google Scholar]
- 53.Woo BH, Kostanski JW, Gebrekidan S, Dani BA, Thanoo BC, DeLuca PP. Preparation, characterization and in vivo evaluation of 120-day poly(D, L-lactide) leuprolide microspheres. J Control Release. 2001;75(3):307–315. doi: 10.1016/S0168-3659(01)00403-5. [DOI] [PubMed] [Google Scholar]
- 54.Costa P, Sousa Lobo JM. Modeling and comparison of dissolution profiles. Eur J Pharm Sci. 2001;13(2):123–133. doi: 10.1016/S0928-0987(01)00095-1. [DOI] [PubMed] [Google Scholar]
- 55.Polli JE, Rekhi GS, Augsburger LL, Shah VP. Methods to compare dissolution profiles and a rational for wide dissolution specifications for metoprolol tartrate tablets. J Pharm Sci. 1997;86(6):690–700. doi: 10.1021/js960473x. [DOI] [PubMed] [Google Scholar]
- 56.Blasi P, D’Souza SS, Selmin F, DeLuca PP. Plasticizing effect of water on poly(lactide-co-glycolide) J Control Release. 2005;108(1):1–9. doi: 10.1016/j.jconrel.2005.07.009. [DOI] [PubMed] [Google Scholar]
- 57.Fu K, Pack DW, Klibanov AM, Langer R. Visual evidence of acidic environment within degrading poly(lactic-co-glycolic acid) (PLGA) microspheres. Pharm Res. 2000;17(1):100–106. doi: 10.1023/A:1007582911958. [DOI] [PubMed] [Google Scholar]