

Abstract
Identification of transcription factor binding sites within regulatory segments of genomic DNA is an important step toward understanding of the regulatory circuits that control expression of genes. Here, we describe a novel bioinformatics method that bases classification of potential binding sites explicitly on the estimate of sequence-specific binding energy of a given transcription factor. The method also estimates the chemical potential of the factor that defines the threshold of binding. In contrast with the widely used information-theoretic weight matrix method, the new approach correctly describes saturation in the transcription factor/DNA binding probability. This results in a significant improvement in the number of expected false positives, particularly in the ubiquitous case of low-specificity factors. In the strong binding limit, the algorithm is related to the “support vector machine” approach to pattern recognition. The new method is used to identify likely genomic binding sites for the E. coli transcription factors collected in the DPInteract database. In addition, for CRP (a global regulatory factor), the likely regulatory modality (i.e., repressor or activator) of predicted binding sites is determined.
Molecular biology has been revolutionized by the availability of complete DNA sequences as well as of genome-wide expression data for many different organisms. Methods for prediction of genes from sequence data are now quite well developed. However, the equally important problem of identifying the regulatory elements of DNA remains a challenge (Fickett and Wasserman 2000). The regulatory elements are short (6-20 bp) segments of DNA that, through binding of particular transcription factor (TF) proteins, control the expression of nearby genes (Lewin 2000). Extracting biological function from sequence information poses a nontrivial pattern-recognition problem. In this paper, we translate the biophysical view of specific TF-DNA interaction into a novel algorithm for identifying the binding sites for known transcription factors. We compare the new algorithm (Quadratic Programming Method of Energy Matrix Estimation, or QPMEME) with the widely used information-theory-based weight matrix method (Stormo et al. 1982,1986; Staden 1984; Berg and von Hippel 1987; Stormo and Hartzell III 1989; Stormo and Fields 1998). We argue that the new algorithm is more appropriate for the analysis of TFs with highly variable known binding sites, that is, TFs that bind with low specificity under physiological conditions. We also apply the QPMEME algorithm to the identification of the potential regulatory binding sites in Escherichia coli (Blattner et al. 1997) for the set of transcription factors collected in the DPInteract database (http://arep.med.harvard.edu/dpinteract/). The QPMEME algorithm allows identification of the likely RNA polymerase (RNAP) binding sites (promoters) including the RNAP-σ70 sites. Identification of these sites is highly nontrivial because of their strong variability in E. coli (Robison et al. 1998; Wagner 2000). This, in turn, makes it possible—by examining the location of TF-binding sites relative to promoters and to other TF-binding sites (Gralla and Collado-Vides 1996)—to predict the functional modality (repressor vs. activator) for at least some of the candidate regulatory sites. In particular, we provide predictions for the location and modality of numerous cAMP-receptor protein (CRP) binding sites (Wagner 2000). The predictions are calibrated on the binding site data collected in the RegulonDB database (http://www.cifn.unam.mx/Computational_Genomics/regulonDB/) and can be tested in the next generation of experiments. We also use the algorithm to examine the distribution of likely binding sites and the possible function of two poorly understood global regulatory proteins: the histone-like nucleoid-associated protein (H-NS) and the leucine-responsive regulatory protein (LRP; Wagner 2000). Finally, we suggest experiments that could test the biophysical foundations of the QPMEME algorithm. The results of our TF-binding site search have been used to examine the relation of TF specificity and degree of pleiotropy (the number of regulatory targets) as reported in Sengupta et al. (2002).
We introduce the new algorithm in the Methods section and present its application to E. coli genome analysis in the Results section. Comparison with the information-theoretic weight matrix and other issues are addressed in the Discussion section.
METHODS
Biophysical View of Transcription Factor-DNA Binding
Consider a reversible reaction of binding of the transcription factor (TF) to a short piece of DNA schematically represented by
 |
1 |
The rates depend on the DNA sequence S. Let Kbind(S), Kdiss(S) be the sequence-dependent rate constants for transcription factor binding and for transcription factor dissociation. If the binding (free) energy4 of a transcription factor (TF) to a short stretch of DNA with sequence S is E(S), then
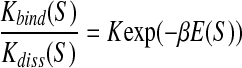 |
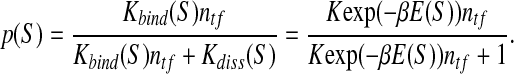
with β = 1/kBT. When such a sequence is in a solution containing a transcription factor with the concentration ntf, the equilibrium probability of it being bound to a TF molecule is
 |
2 |
which can be rewritten in the form:
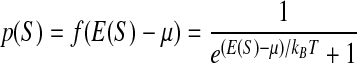 |
3 |
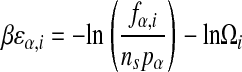
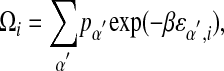
recognized as the Fermi-Dirac distribution (Ma 1985), where µ is the chemical potential set by the factor concentration: µ = kBT ln(Kntf).
The Fermi-Dirac form of binding probability tells us that a sequence with binding energy well below the chemical potential (which depends on the factor concentration) is almost always bound to a factor. On the other hand, if the binding energy is well above the chemical potential, the sequence is rarely bound, with the binding probability approximated by exp(-(E(S) - µ)/kBT). Note that the “information score” defined by the information-based weight matrix procedure (Stormo and Fields 1998) is often interpreted as (the negative) of the binding energy. This interpretation (Stormo and Fields 1998) assumes Boltzmann distribution of binding probability and therefore corresponds to the rare binding limit (see Appendix I). Our present goal will be to devise an algorithm for binding motif analysis that is appropriate for the case in which sites with saturated occupancy are present.
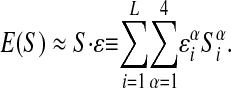
To proceed any further, we need an expression for E(S). Quite generally, the sequence-specific interaction can be parameterized by
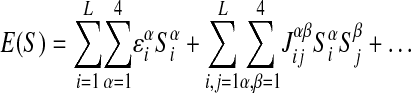 |
4 |
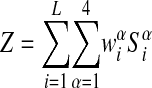
where Siα characterizes the sequence Siα = 1 if the i-th base is α and Siα = 0 otherwise. εiα is the interaction energy with the nucleotide α at position i = 1,..., L of the DNA string (Stormo and Fields 1998) and Jijαβ is the pair-dependent (α at position i and β at j) correction. The simplest model of protein-DNA binding assumes that the interaction of a given base with the factor does not depend on the neighboring bases and hence corresponds to just the first term of the expression in equation 4:
 |
5 |
This simple parameterization provides a reasonable approximation in many cases (Stormo and Fields 1998), although there are examples where binding shows clear dependence on nucleotide pairs (e.g.,Bulyk et al. 2002). The latter effect can be parametrized by inclusion of Jijαβ ≠ 0 (Stormo et al. 1986; Zhang and Marr 1993). For the rest of this paper, we shall work with the independent nucleotide approximation to E(S) and show how the interaction parameters ε and the chemical potential µ can be estimated from the data. The method presented below can be readily extended to the more general form of E(S).
Maximum Likelihood Inference of Binding Energies
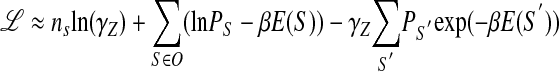
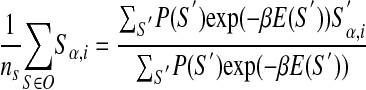
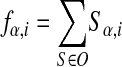
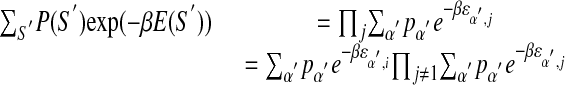
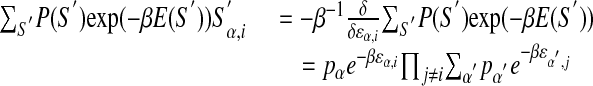
Let us consider an ideal experiment in which a large number of randomly generated sequences of length L are mixed into a solution with a known concentration of a given transcription factor. Let the probability of generating sequence S be PS. Upon equilibration, some of the DNA sequences bound to a factor are extracted out of the solution and sequenced. This gives us a set O containing nS sequences of length L.
The probability of observing the sequences comprising set O, but no other sequences, is given by
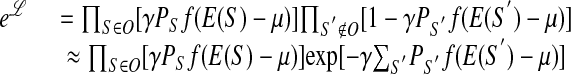 |
6 |
where γ is the (yet unknown) probability of a factor-bound sequence to be extracted. The likelihood function ℒ depends on ε through E(S) = ε · S. The sum over the unobserved sequences S′ can be approximated in terms of the binding energy distribution ρε(E) (see Fig. 1 and Supplemental Appendix A), whose subscript reminds us of its dependence on ε. Thus
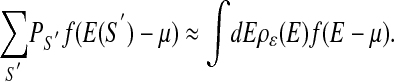 |
We want to choose all the parameters in such a way as to maximize ℒ. Variation of ℒ with respect to ε,µ, and γ gives equations that together determine these parameters (see Supplemental Appendix B). In Appendix I, we show how the above analysis, when applied to the case in which the chemical potential µ is so low that the probability of any sequence being bound is small, reduces to the familiar information-theoretic weight matrix construction (Stormo and Fields 1998). In the next section, we discuss another limit, β→∞, where the analysis simplifies.
Figure 1.

Distribution of binding energies (red curve) in the ensemble of random sequences is approximately Gaussian (although limited to the Emin, Emax interval set by the best and the worst binding sequences, respectively). The blue line represents the binding probability of TF present at a concentration corresponding to the chemical potential µ. The red crosses illustrate possible binding energies of example sequences.
Deterministic Limit and the Quadratic Programming Method of Energy Matrix Estimation
It is useful to consider the limit when all of the “observed” sequences (i.e., S ∈ O) are bound with probability close to 1, which occurs if µ - E(S) ≫ kBT (for all S∈O). Maximizing likelihood then reduces to minimizing
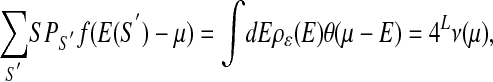 |
where ν(µ) is defined as the probability that a randomly chosen sequence has energy below µ, while satisfying at the same time the constraint E(S) ≤ µ, for all S ∈ O. This is a problem of minimization subject to linear inequality constraints (see Fig. 2 for schematic illustration).
Figure 2.

Schematic representation of the quadratic programming problem. Sequences are represented as points in multidimensional space. The red circles represent example binding sites, and blue crosses represent random sequences. The hyperplane H is specified by the energy matrix ε (here considered as a vector) and µ. All example points must be on or to the “left” of the hyperplane. Optimization moves the plane left until it gets “hung up” on the example points (S(1), S(2), S(3) on the figure) so as to minimize the number of random sequences below the binding threshold (i.e., lying to the left of H).
The problem simplifies even further if we assume that the chemical potential is in an energy range where the distribution of binding energies of random strings could be approximated by a Gaussian distribution. Then, minimizing ν(µ) is equivalent to minimizing the variance of energies from the distribution, with µ held fixed. We will shift energies so that the average binding energy over all sequences is zero. Then, we minimize
 |
7 |
subject to
 |
8 |
for every S ∈ O. The overall energy scale is arbitrary, and we are free to set the fixed value of|μ| to 1: hence we are determining ε in units of µ. (More precisely,µ here is the difference between the chemical potential and the average energy.)
Minimizing a nonnegative definite quadratic form subject to linear inequalities is a well-developed technique known as quadratic programming (Fletcher 1987). Because it involves finding the minimum of a convex function over a convex domain, finding a solution satisfying the Kuhn-Tucker condition (Fletcher 1987), namely, the condition for being a local minimum, is enough to find a global solution.
In practice, we solve the dual version (Fletcher 1987) of this quadratic programming problem. That problem is constructed as follows. Let O = {S(1), S(2),..., S(nS)}. Construct the matrix M with
 |
9 |
where  and
and  . Minimize
 |
10 |
subject to
 |
11 |
for each a = 1, 2,..., nS.
The relation between the primal and the dual solution is given by
 |
12 |
For any γa > 0, one could show that at the optimal point ε · S(a) = 1. If we think of sequences S as vectors in a vector space V and H= {x ∈ V|ε·x =1} being a hyperplane separating the binding sequences from the nonbinding ones, then H is “supported” by those observed sequences S(a) that had nontrivial γa (see Fig. 2). At this point we see that this method is very similar to Support Vector Machines (Cristianini and Shawe-Taylor 2001). The main difference is that in the case of Support Vector Machines, one is trying to separate between positive examples and negative examples with a separator surface of largest margin. In our case, we do not have particular non-binding sequences. Instead, we are trying to minimize the probability that any random sequence is identified as a binding sequence, while still correctly classifying all of the examples.
RESULTS
Application of QPMEME to Binding Site Identification in E. coli
We have used the Quadratic Programming Method of Energy Matrix Estimation (QPMEME) to construct ε matrices for the DNA-binding proteins (ε(tf)) from the known binding sites (Robison et al. 1998) collected in the DPInteract database. We then searched both strands of the 3121 non-ORF regions (with length >10 bp) of the E. coli genome (Blattner et al. 1997) to identify the candidate transcription factor binding sites, as defined by the E(tf)(S) = ε(tf) · S ≤ µ = -1 condition. The overall results are summarized in Table 1, which lists the number of candidate binding sites for each factor along with the number of examples (from DPIinteract) used by the QPMEME algorithm. The complete lists of binding sites found are available at http://www.biomaps.rutgers.edu/Public/QPMEME.htm.
Table 1.
Statistical Summary of E. coli Search Results
| Namea | Lengthb | Number of examplesc | Information score “hits”d | QPMEME “hits”e | Significancef |
|---|---|---|---|---|---|
| ArcA | 15 | 14 | 391 | 52 | 6.3 |
| ArgR | 18 | 17 | 320 | 79 | 8.9 |
| CRP | 22 | 49 | 3093 | 796 | 27.2 |
| CytR | 18 | 5 | 745 | 42 | 4.3 |
| DnaA | 15 | 8 | 98,748 | 461 | 0.5 |
| FadR | 17 | 7 | 28 | 10 | 9.0 |
| FarR | 10 | 4 | 1893 | 241 | 3.7 |
| FIS | 35 | 19 | 7687 | 255 | 4.1 |
| Fnr | 22 | 14 | 174 | 36 | 13.9 |
| FruR | 16 | 12 | 31 | 23 | 14.8 |
| GalR | 16 | 7 | 10 | 9 | 8 × 10³ |
| GevA | 20 | 4 | 15 | 5 | 5 × 10³ |
| GlpR | 20 | 13 | 9132 | 192 | 1.6 |
| H-NS | 11 | 15 | 14,619 | 2340 | 2.7 |
| IHF | 48 | 26 | 82,494 | 359 | 13.6 |
| LexA | 20 | 19 | 39 | 39 | 104 |
| LRP | 25 | 12 | 90,676 | 4087 | 32.9 |
| MalR | 10 | 10 | 96 | 61 | 8.7 |
| MetJ | 16 | 15 | 404 | 42 | 1.6 |
| MetR | 15 | 8 | 344 | 26 | 3.2 |
| NagC | 23 | 6 | 72 | 8 | 7.0 |
| NarL | 16 | 11 | 2090 | 19 | 7.5 |
| OmpR | 20 | 9 | 4890 | 93 | 2.6 |
| PhoB | 22 | 15 | 258 | 23 | 14.8 |
| PurR | 26 | 22 | 47 | 28 | 27.0 |
| σ70 (15) | 27 | 27 | 11,517 | 635 | 2.2 |
| σ70 (16) | 28 | 48 | 15,867 | 912 | 2.6 |
| σ70 (17) | 29 | 116 | 41,488 | 3923 | 0.6 |
| σ70 (18) | 30 | 34 | 10,133 | 381 | 0.6 |
| σ70 (19) | 31 | 25 | 15,086 | 301 | 0.4 |
| σ54 | 16 | 6 | 16 | 7 | 6.0 |
| σs | 29 | 15 | 10,669 | 245 | 2.0 |
| SoxS | 35 | 14 | 3963 | 49 | 2.2 |
| TyrR | 22 | 17 | 3843 | 73 | 6.2 |
See Web site http://www.biomaps.rutgers.edu/bioinformatics/QPMEME.htm. for details.
TF name. Note σ70 (15), etc., refers to σ70 sites with 15 bp spacer between −10 and −35 boxes.
length of the binding site in bp.
number of known binding sites used to determine ε, μ parameters.
number of candidate sites found using information theoretic weight matrix with threshold set to include most of the example sites (the 2σ cut-off; Robison et al. 1998).
number of candidate sites found using QPMEME approach.
“Significance” defined here as a difference between actual and expected number of sites normalized to the square root of the expected number.
To evaluate the statistical significance of the search results, we compare the “empirical distribution” of interaction energies, ε(tf) · S, found over all non-ORF sequences in E. coli with the background distribution defined by a random ε matrix (with the same variance ε2 = ε2(tf)) in the model genomic background (MGB). The statistics of MGB must be defined so that the empirical genomic distribution and the MGB distributions agree for any random ε. We find that random sequences biased to reproduce the nucleotide and dinucleotide statistics of non-ORF E. coli DNA provide an adequate MGB. This is illustrated in Figure 3, which compares the empirical energy distribution for a random ε with that in MGB consisting of random sequence with (a) a correct single nucleotide and (b) correct dinucleotide statistics. The MGB distributions are computed by the method described in Supplemental Appendix A.
Figure 3.

This figure illustrates the importance of the correlation effects in genomic background statistics. The histograms of binding energies are obtained for a randomly chosen ε vector (blue) and its scrambled, that is, position-permuted, version  (red). The magenta curve is the theoretical estimate of the binding energy distribution based on a random nucleotide model without correlations, but with the correct one-point statistics of bases. That estimate is the same for ε and
  . The theoretical energy distribution for model background statistics, which includes correct one- and two- (nearest-neighbor) base statistics, is different for ε and
  (green curves) is in a much better agreement with the empirical histograms.
If for ε(tf), found for a particular transcription factor, the empirical distribution departs significantly from the background distribution, it is very likely to be indicative of biological relevance. For many factors like CRP or FNR shown in Figure 4, there is a pronounced deviation of the empirical distribution from MGB in the region of strong binding that clearly indicates statistical significance. Note that, in the case of FNR, the binding threshold µ, which we have estimated on the basis of examples (from DPInteract), lies below the point where the empirical distribution deviates from MGB. It is likely, that, in this case, the estimated threshold is too low, and additional statistically significant sites can be found. Statistical significance in the number of candidate binding sites found in the present search—defined by the number of candidate sites minus the expected number of bound sites for the background distribution over the standard deviation in the number of background bound sites—is listed in Table 1 for some of the transcription factors tested. The complete list for all of the tested transcription factors may be found at http://www.biomaps.rutgers.edu/bioinformatics/QPMEME.htm.
Figure 4.

Comparison of the empirical and the model genomic background (MGB) binding energy distributions. The empirical distributions obtained by computing E = ε · S for all S in the non-ORF segments of the E. coli K12 genome with ε estimated for CRP and FNR. The MGB includes nearest-neighbor correlations, and the corresponding theoretical distribution is computed as described in Supplemental Appendix A. Both cases exhibit clear overrepresentation of the strongly bound sites. Vertical blue lines indicate the binding threshold estimated on the basis of the known binding sites.
Note, however, that lack of difference between the empirical and the background distributions does not mean that ε(tf) estimated on the basis of the examples is spurious, only that one needs other means to verify its validity. For example, in the case of RNAP-σ70, we find no significant difference between empirical and background distributions. However, plotting a histogram of distance between putative RNAP-σ70 promoters and the start of the nearest gene reveals a significant difference between the case in which the promoter is on the same strand as the downstream gene (i.e., is correctly oriented to transcribe it) and the case in which the promoter and the gene are on opposite strands. Furthermore, we observe a peak in the histogram corresponding to promoters positioned 33 bases upstream of the closest gene (see Fig. 5). This indicates that even if we do not see much in the absolute count of hits, we may be retrieving some biologically significant sites. Reliable identification of the RNAP-σ70 sites in E. coli solely by the means of bioinformatics is a notoriously difficult task. Hence, the present findings are rather encouraging.
Figure 5.

Histograms of positions of candidate σ70 binding sites relative to the nearest downstream ORF. Distance is measured from the 3′ end of the binding site. (A) Histogram corresponding to putative promoter and gene located on the same strand; (B) on opposite strands. The positional distribution of candidate σ70 promoters peaks at 33 bp upstream of the ORF only in the functionally relevant, same strand, configuration.
To further assess the quality of the search algorithm and its predictions, we focus on the binding site search results for the two “low-specificity” factors5: CRP and RNAP-σ70. To estimate the false-negative rate, we compare our predicted sites for CRP and RNAP-σ70 with the known sites collected in Regulon DB (http://www.cifn.unam.mx/Computational_Genomics/regulonDB). CRP and RNAP-σ70 represent, respectively, the best and the worst cases, judged on the basis of the candidate site number excess over background. We find a 24% false-negative rate for CRP (in classifying 54 RegulonDB sites not included among the 48 “example” sites from DPInteract that we used for parameter estimation). The false-negative rate for our RNAP-σ70 site prediction is about 50%, as deduced from classifying RegulonDB sites. Note that in the E. coli search, we found the total of 1609 RNAP-σ70 candidate sites correctly oriented and within 100 bp upstream of an ORF. This number should be compared with the 2593 estimated number of operons (Blattner et al. 1997). It is likely that many of the functional σ70 promoters are missed by the present search because they are intrinsically weak binding sites and require the presence nearby of activating transcription factors. A particularly well-known example is provided by Class II CRP binding sites (Kolb et al. 1993; Busby and Ebright 1999; Wagner 2000), where CRP positioned at -42 (relative to the transcription start) occludes the -35 binding element (Lewin 2000; Wagner 2000) of σ70. Searching for a σ70 -10 element appropriately positioned relative to the candidate CRP binding sites, we find 133 Class II sites, of which only 17 are in RegulonDB, which reduces the RNAP-σ70 false-negative rate to 40%.
To corroborate the likely functional significance of the candidate binding sites, we consider the abundance of CRP binding sites upstream of genes involved in carbon metabolism (as classified in the EcoCyc database; http://www.ecocyc.org). Of the total of 559 candidate CRP binding sites, 118 are upstream of carbon metabolic genes, so that the fraction of the latter genes with a CRP site is 21% compared with 6% genome-wide. Hence, as expected, we observe clear evidence of CRP involvement in carbon utilization (Saier et al. 1996).
One of the main benefits of the proposed search algorithm is that it makes plausible predictions for RNAP-σ70-binding sites. This information can be used to infer the regulatory modality of the nearby TF-binding sites. In most cases, TF-binding sites that overlap or sit directly downstream of the promoter act as repressors (Gralla and Collado-Vides 1996; with the exception of known activators, such as CRP Class II, AraC, etc.; Wagner 2000). As an example, we again consider CRP, which is known to act as an activator or repressor on different promoters (Wagner 2000). Figure 6A shows the histogram of known (RegulonDB) CRP binding site positions (relative to the transcription start) corresponding to activation (blue) and repression (red). The activator sites clump at -42 (Class II site) and -62, -72, -93 series of Class I sites (Busby and Ebright 1999; Wagner 2000), which are consistent with the period of the DNA helix. Figure 6B presents the histogram of positions of candidate CRP binding sites relative to transcription starts identified on the basis of the nearest candidate RNAP-σ70 site. (Only the candidate RpoD sites within 100 bp upstream of the ORF are included.) Note the identifiable Class I peaks and the conspicuous absence of Class II sites in the histogram based on the results of the σ70 search. Class II sites reappear in Figure 6C, which includes candidate promoters identified by the joint CRP/σ70 -10 search. In addition to the identifiable Class I and Class II sites, we observe significant peaks at positions -47 and -29 in the histogram. The former position lies one half-helix turn upstream of the Class II site so that the TF at that position would interfere with the α-CTD domain of the RNAP (Wagner 2000), and hence we expect these sites to act as repressors. The peak at -29 may be explained statistically by the similarity of the CRP and σ70 energy matrices (with appropriate positional offset); however, this does not preclude functional significance of these sites, which we expect to function in repressor modality. In addition, we shall tentatively classify as repressors all sites downstream of position -37. The result of this analysis is a hypothetical classification of the candidate CRP sites as activators or repressors. Of the total of 399 candidate CRP sites (which have a candidate promoter nearby), we classify 202 as activators and 118 as repressors. The complete list of classified sites is available at http://www.biomaps.rutgers.edu/bioinformatics/QPMEME. In Table 2, we list the strongest (of the newly predicted) binding sites and their predicted functional modality.
Figure 6.


Positional distribution of CRP site centers relative to the (predicted) transcription start. (A) Known CRP sites (from RegulonDB):(blue) activator sites, (red) repressor sites, (black) unknown. (B) Candidate CRP sites found in the present search with position relative to transcription start inferred from the closest σ70 candidate binding site. Note the significant peaks of the distribution at -62, -72, -82, -93, and -103, that is, Class I positions. Note also the significant peaks at -48 and -29 positions, which we interpret as repressor sites. The proposed functional classification is (blue) activator sites, (red) repressor sites, (black) unknown. (C) Same as B with the addition of putative Class II CRP sites found in the composite CRP-σ70 site search. The green line represents the estimated background distribution.
Table 2.
Predicted Functional Modality of Some Candidate CRP Sites
| Target gene and its function | 5′-end position | |E/μ| | Center position | Function |
|---|---|---|---|---|
| caiT (probable carnitine transporter) | 42,068 | 1.2885 | −81 | Activator |
| gcd (glucose dehydrogenase) | 141,284 | 1.2981 | −33 | Repressor |
| ybiS (ORF, hypothetical protein) | 855,062 | 1.2974 | −49 | Repressor |
| b0822 (hypothetical protein) | 859,296 | 1.2939 | −42 | Activator |
| infA (protein chain initiation factor IF-1) | 925,739 | 1.2538 | −49 | Repressor |
| ycfR (ORF, hypothetical protein) | 1,168,209 | 1.4563 | 12 | Repressor |
| ychH (ORF, hypothetical protein) | 1,257,909 | 1.2855 | −22 | Repressor |
| ydaK (putative transcriptional regulator LYSR-type) | 1,402,612 | 1.3117 | −42 | Activator |
| b1729 (ORF a kinase) | 1,808,868 | 1.3186 | −70 | Activator |
| yeaA (ORF, hypothetical protein) | 1,860,569 | 1.3720 | −90 | Activator |
| sbmC (sbmC protein) | 2,079,356 | 1.2815 | −19 | Repressor |
| cdd (cytidine/deoxycytidine deaminase) | 2,229,786 | 1.3090 | −42 | Activator |
| dsdC (D-serine dehydratase transcriptional activator) | 2,475,713 | 1.3129 | −61 | Activator |
| glk (glucokinase) | 2,507,541 | 1.2551 | −93 | Activator |
| b2448 (hypothetical protein) | 2,561,441 | 1.2958 | −42 | Activator |
| b2736 (dehydrogenase) | 2,859,363 | 1.3783 | −42 | Activator |
| ygcW (putative oxidoreductase) | 2,898,417 | 1.3203 | −42 | Activator |
| agaR (putative transcriptional regulator of aga operon) | 3,276,436 | 1.3410 | −82 | Activator |
| yhcR (ORF, hypothetical protein) | 3,387,118 | 1.3304 | −19 | Repressor |
| yhhZ (ORF, hypothetical protein) | 3,579,344 | 1.2537 | −42 | Activator |
| dctA (uptake of C4-dicarboxylic acids) | 3,681,199 | 1.2778 | −46 | Repressor |
| xylA (D-xylose isomerase) | 3,728,507 | 1.2835 | −28 | Repressor |
| tnaL (tryptophanase leader peptide) | 3,885,970 | 1.3238 | −6 | Repressor |
| kdgT (2-keto-3-deoxy-D-gluconate transport system) | 4,099,091 | 1.3754 | −42 | Activator |
| yjcB (ORF, hypothetical protein) | 4,272,748 | 1.5685 | −13 | Repressor |
| yjfA (ORF, hypothetical protein) | 4,445,847 | 1.2498 | 7 | Repressor |
| idnK (gluconate kinase, thermosensitive glucokinase) | 4,492,034 | 1.3262 | −42 | Activator |
| yjhl (putative regulator) | 4,523,465 | 1.2595 | −22 | Repressor |
Finally, we use the position of the predicted TF-binding sites relative to predicted promoters to gain insight into the action of two poorly understood highly pleiotropic regulatory factors: the histone-like nucleoid structuring protein H-NS (Wagner 2000) and the leucine-responsive regulatory protein LRP (Wagner 2000). Figures 7A and 8 present positional histograms for candidate H-NS and LRP sites, respectively. Positions are measured relative to the closest candidate promoter, and we restrict to cases in which the sites are within 100 bp of a downstream ORF. For both H-NS and LRP, we find significant peaks overlapping (and just downstream in case of H-NS) of the σ70-binding site. This observation is consistent with the known examples of regulatory H-NS sites: in Figure 7A, we show regions found in several foot-printing studies of H-NS/DNA interaction (Lucht et al. 1994; Falconi et al. 1998; Soutourina et al. 1999). In addition, we observe that if we condition the distribution by restricting to only strong σ70 promoters, the peak near zero offset disappears, as shown in Figure 7B. This strongly implies that H-NS binding sites overlapping with the promoter act as activators. The regulatory role of the predicted H-NS and LRP sites needs to be further explored experimentally.
Figure 7.


Positional distribution of candidate H-NS sites (centers) relative to putative RNAP-σ70 sites (centers). (A) All candidate H-NS sites within the represented range of distances. Note the significant peaks at relative positions near -4 and 8, which correspond to direct overlap, and at positions 25, 35, and 52, where H-NS is downstream of the promoter. Horizontal bars correspond to footprinted H-NS sites from Falconi et al. (1998), Lucht et al. (1994), and Soutourina et al. (1999). (B) Same as A but excluding weak candidate RNAP-σ70 promoters (i.e., sites with high E/µ “score”). The disappearance of the -4, 8 peaks indicates that they may function as activators. (*) Estimated background distribution.
Figure 8.

Positional distribution of candidate LRP sites (centers) relative to putative RNAP-σ70 sites (centers). (*) Estimated background distribution.
It is expected that the regulatory activity of LRP and H-NS is not limited to direct interactions with RNAP-σ70 but also involves indirect action mediated by the DNA bending that these TFs are known to induce (Wagner 2000). Our analysis can be extended to identifying likely instances of such interactions.
DISCUSSION
Comparison Between the QPMEME and the Information-Theoretic Weight Matrix Method
As we explicitly demonstrate in Appendix I, our maximum likelihood approach reduces to the information-theoretic weight matrix method in the limit when TF concentration is so low that binding occurs with low probability. In that case,“occupancy” of site S given by the Fermi function f(E(S) - µ) is approximated by the Boltzmann factor, ∼e-βE(S), and the maximal likelihood estimation expresses the weight matrix in terms of a logarithm of base frequencies at different positions (Stormo and Fields 1998). It is expected that under physiological conditions corresponding to TF binding to its regulatory site(s), the site is occupied with probability close to 1. Hence, the low concentration limit is not appropriate. Yet in applying QPMEME to the analysis of regulatory binding sites, one may be concerned that concentration of active TFs in the cell may not just take two—low and high—values. The assumption implicit in our analysis is that known regulatory binding sites in the physiological state when they are occupied by corresponding TFs are occupied with probability close to 1. Thus, the chemical potential (or binding threshold) that we estimate for each TF corresponds to the highest concentration of this TF observed in the cell.6 This “all-or-none” occupancy assumption may not be appropriate in specific cases where continuous variation of binding probability may be playing a physiological role. The latter is likely to be the case for RNAP-σ70, which is not switched “on” or “off” by changing concentration. The reduced probability of σ70 occupancy, programmed by the binding site sequence, is likely to be of physiological use as a weak promoter. We therefore expect that σ70 example sites found in databases may contain many sequences with binding energy lying above the chemical potential. Thus the analysis may be improved by returning to the finite temperature model discussed above (and in Supplemental Appendix B), rather than the zero temperature limit (QPMEME), the results of which we are presently reporting. However, the latter still has a practical advantage over the use of the information-theoretic weight matrix, which we discuss next.
In the practical, bioinformatics context, the principal difference between the QPMEME and the standard information-based weight matrix method is that the latter does not produce a natural threshold for the “information score” used to classify sequence segments (Robison et al. 1998). Hence, search results are often quoted for the high and the low settings of threshold determined, respectively, by the average information score in the example set and the average minus two standard deviations (Robison et al. 1998). The latter setting of the threshold correctly classifies most of the examples, but in the case of low-specificity factors leads to an unreasonably large number of predicted binding sites (Robison et al. 1998; see Table 1). The QPMEME method, on the other hand, instantly produces a natural threshold. For the most complete comparison between the two methods, let us for a moment forget about the QPMEME estimate of binding threshold (µ) and examine the classifications of sites produced by ε · S < µ inequality for two different estimates of ε—one obtained by the standard weight matrix method, another by QPMEME—as a function of variable µ. The performance of pattern recognition algorithms is often quantified by comparing their so-called Detection Error Trade-off (DET) curves (Egan 1975; Martin et al. 1997). The DET curve plots the probability of rejecting a genuine candidate (false negative) against the probability of accepting an incorrect example (false positive). In our case, the estimate of the false-negative probability can be obtained by using the two algorithms to classify the binding sites assembled in the RegulonDB database, which includes more sites than the DPInteract database used as a “training set” to determine εs. The probability of false positives may only be determined by direct experimental tests of predicted sites, which are not yet available. Hence, instead of the probability of false positives, we shall use the total number of predicted binding sites, on the assumption that the former increases monotonically with the latter. Figure 9 shows, for the case of CRP, the fraction of false negatives (in the classification of the test data, i.e., RegulonDB) versus the total number of predicted binding sites as a function of the variable threshold µ. We observe that for the same false-negative probability, the information-score-based search gets a much longer list of candidate sites. Figure 9 also indicates points corresponding to the QPMEME estimate (diamond) of the binding threshold µ as well as the common low (+) and high (*) settings of the information score threshold used in the information theoretic weight matrix approach. It must be emphasized that the rational setting of the threshold without recourse to the proposed QPMEME approach would require constructing the DET curve as presented here. This, however, is labor intensive and is seldom performed in practice. Hence, the estimate of µ provided by QPMEME is of great utility.
Figure 9.

Comparison of the false-negative fraction versus the number of candidate sites found within the non-ORF fraction of the E. coli K12 genome for the information-based weight matrix (blue) and QPMEME (red) methods. Both CRP site searches are based on the same set of example sites (Robison et al. 1998) and tested against entries in RegulonDB. (⋄) The point corresponding to the QPMEME-derived threshold. The (+) low and (*) high thresholds used in Robison et al. (1998).
Physical Versus Bioinformatics Parameters
When formulating the method of binding energy estimation above, we described an ideal experiment addressing sequence-specific protein-DNA interactions. The maximum likelihood method would then determine µ corresponding to the protein concentration used in the experiment and ε (and J) providing an approximation to physical E(S). In practice, we proceed to apply the maximum likelihood method to examples of binding sites collected under diverse and not well-characterized conditions. Resulting ε and µ should be regarded as the “bioinformatics parameters,” which are useful for bioinformatics purposes as discussed above, but are not guaranteed to be close to the physical parameters. It would be very interesting to carry out a controlled (biophysical) study of sequence-specific interactions for selected TFs (especially the high pleiotropy factors like CRP, H-NS, LRP, etc.) and to compare the physical parameters with those inferred from bioinformatics data. This would allow us to establish the physical model underlying our analysis and to address the issue of E(S) parameterization in terms of single nucleotide interactions (ε) and the role of higher-order terms. This would also allow us to relax the “all-or-nothing” approximation and to estimate the absolute magnitude of the physical binding energy (by carrying out the full finite temperature maximum likelihood parameter estimation described in Supplemental Appendix B).
Conclusion
In this paper, we have proposed a novel algorithm for identification of candidate transcription factor binding sites and applied it to the analysis of the E. coli genome. In contrast with the widely used weight matrix method that originated with information-theoretic considerations, the present algorithm was motivated by the energetics and thermodynamics of protein/DNA interaction. The key difference between the two approaches is in the correct description of sites with saturated occupancy. This leads to the explicit appearance—and determination—of a binding threshold, physically governed by transcription factor concentration. We have also demonstrated that the standard weight matrix algorithm corresponds to the physical limit of low transcription factor concentration and low probability of binding. In the limit of strong binding, our algorithm reduces to a quadratic programming problem and is related to the support vector machine approach to pattern recognition. For relatively nonspecific proteins with binding sites of different strength, our method generates much shorter and more plausible lists of candidate binding sites, than the standard, information-based, weight matrix method. In particular, we have obtained a plausible list of σ70 binding sites that we expect to constitute close to 50% of all transcription initiation sites. We hypothesize that the remaining sites are intrinsically weak, so as to enable the function of additional transcriptional activators. Identification of such sites requires joint search for the σ70 and the activating factor motifs. The effectiveness of this method is exemplified by the search for the Class II CRP-activated promoters. The newly obtained knowledge of the likely RNAP-σ70 promoter locations opens the possibility of addressing the question of regulatory modality of transcription factors (e.g., dual—activator or repressor—modality factors like CRP) on the basis of the position of their binding sites relative to the promoter. We have demonstrated this for the case of CRP, H-NS, and LRP factors. In the present paper, we make numerous predictions for TF-binding sites. These predictions will be tested by the future in vivo experiments.
Acknowledgments
This work was initiated when two of the authors (A.M.S. and B.I.S.) were at Bell Labs, Lucent Technologies. This work was supported in part by NIH grants R01-GM67794-01 and GM64375.
The publication costs of this article were defrayed in part by payment of page charges. This article must therefore be hereby marked “advertisement” in accordance with 18 USC section 1734 solely to indicate this fact.
APPENDIX I: The Low Concentration Limit and the Information-Based Weight Matrix
Let us consider a limit when the concentration of the factor is so low that all sites have very low probability of being bound. In other words,(E(S) - µ)/kBT ≫ 1 for all sequences S. Thus, the Fermi function f(E) could be replaced by the Maxwell-Boltzmann expression f(E) = 1/{e(E-µ)/kBT + 1} ≈ z exp(-βE), where β = 1/kBT and the fugacity z = exp(βµ). The likelihood function then becomes
 |
13 |
Using the likelihood function from equation 13, after variation with respect to ε and γz, one gets:
 |
14 |
Note that
 |
counts the frequency of base α appearing at position i. Using the expression of E(S) from equation 5 in the right-hand side, one gets
 |
15 |
 |
16 |
From equations 14, 15, and 16, one gets:
 |
17 |
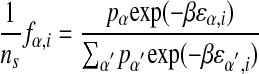
Hence,
 |
with
 |
which provides an estimate of βεα,i up to a base-independent shift for each position.
The weight matrix
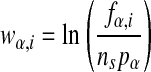 |
is used to define the “information score” (Stormo and Fields 1998)
 |
of any sequence S. A higher score corresponds to lower binding energy. To use the information-theoretic weight matrix method for finding putative binding sites in a genome, one calculates the score of each plausible sequence in the genome and sets a threshold score, so that sequences with higher scores than the threshold are associated with candidate regulatory sites. One weakness of the method is that there is no natural threshold, leaving that choice somewhat arbitrary. This is because the information-theoretic weight matrix approach is appropriate in the limit where there are no strong binding sites and the division between binding sites and nonbinding sites is artificial.
Footnotes
[Supplemental material is available online at www.genome.org. The complete list of predicted sites may be found at http://www.biomaps.rutgers.edu/bioinformatics/QPMEME.htm.]
Article and publication are at http://www.genome.org/cgi/doi/10.1101/gr.1271603.
For brevity, from now on we refer to the free energy of binding simply as “binding energy.” In biophysical literature, the commonly used notation for this quantity would be ΔG(S) rather than E(S).
Although it is convenient to refer to TFs with variable binding sites as “low-specificity” factors, it must be remembered that the variability of binding sites is likely to be the result of these TFs being present at higher concentration than “high-specificity” factors—as opposed to having intrinsically weaker sequence dependence of TF/DNA interaction.
This provides a possible explanation for the case of FNR (see Fig. 4), where we remarked that the chemical potential we deduced from the search may be too low. This could happen if the experiments that generated the collection of FNR binding sites did not include the physiological condition of maximal FNR activation.
References
- Berg, O.G. and von Hippel, P.H. 1987. Selection of DNA binding sites by regulatory proteins: Statistical-mechanical theory and application to operators and promoters. J. Mol. Biol. 193: 723-750. [DOI] [PubMed] [Google Scholar]
- Blattner, F.R., Plunkett III, G., Bloch, C.A., Perna, N.T., Burland, V., Riley, M., Collado-Vides, J., Glasner, J.D., Rode, C.K., Mayhew, G.F., et al. 1997. The complete genome sequence of E. coli K-12. Science 277: 1453-1462. [DOI] [PubMed] [Google Scholar]
- Bulyk, M.L., Johnson, P.L., and Church, G.M. 2002. Nucleotides of transcription factor binding sites exert interdependent effects on the binding affinities of transcription factors. Nucleic Acids Res. 30: 1255-1261. [DOI] [PMC free article] [PubMed] [Google Scholar]
- Busby, S. and Ebright, R. 1999. Transcription activation by catabolite activator protein (CAP). J. Mol. Biol. 293: 199-213. [DOI] [PubMed] [Google Scholar]
- Cristianini, N. and Shawe-Taylor, J. 2001. An introduction to support vector machines. Cambridge University Press, Cambridge, UK.
- Egan, J.P. 1975. Signal detection theory and ROC analysis. Academic Press, New York.
- Falconi, M., Colonna, B., Prosseda, G., Micheli, G., and Gualerzi, C.O. 1998. Thermoregulation of Shigella and Escherichia coli EIEC pathogenicity. A temperature-dependent structural transition of DNA modulates accessibility of virF promoter to transcriptional repressor H-NS. EMBO J. 17: 7033-7043. [DOI] [PMC free article] [PubMed] [Google Scholar]
- Fickett, J.W. and Wasserman, W.W. 2000. Discovery and modeling of transcriptional regulatory regions. Curr. Opin. Biotechnol. 1: 19-24. [DOI] [PubMed] [Google Scholar]
- Fletcher, R. 1987. Practical methods of optimization. Wiley, New York.
- Gralla, J. and Collado-Vides, J. 1996. Organization and function of transcription regulatory elements. In Escherichia coli and Samonella typhimurium: Cellular and molecular biology (eds. F.C. Neidhart and F. Ingraham), pp. 1232-1245. ASM Press, Washington, DC.
- Kolb, A., Busby, S., Buc, H., Garges, S., and Adhya, S. 1993. Transcriptional regulation of cAMP and its receptor protein. Annu. Rev. Biochem. 62: 749-795. [DOI] [PubMed] [Google Scholar]
- Lewin, B. 2000. Genes VII. Oxford University Press, Oxford, UK.
- Lucht, J.M., Dersch, P., Kempf, B., and Bremer, E. 1994. Interactions of the nucleoid-associated DNA-binding protein H-NS with the regulatory region of the osmotically controlled proU operon of Escherichia coli. J. Biol. Chem. 269: 6578-6586. [PubMed] [Google Scholar]
- Ma, S.-K. 1985. Statistical mechanics. World Scientific, Singapore.
- Martin, A., Doddington, G., Kamm, T., Ordowski, M., and Przybocki, M. 1997. The DET curve in assessment of detection task performance. EuroSpeech 4: 1895-1898. [Google Scholar]
- Robison, K., McGuire, A.M, and Church, G.M. 1998. A comprehensive library of DNA-binding site matrices for 55 proteins applied to the complete Escherichia coli K-12 genome. J. Mol. Biol. 284: 241-254. [DOI] [PubMed] [Google Scholar]
- Saier, M., Ramseier, T., and Reizer, J. 1996. Carbon utilization. In Escherichia coli and Salmonella typhimurium: Cellular and molecular biology (eds. J. Neidhardt and F. Ingraham). ASM Press, Washington, DC.
- Sengupta, A.M., Djordjevic, M., and Shraiman, B.I. 2002. Specificity and robustness of transcription control networks. Proc. Natl. Acad. Sci. 99: 2072-2077. [DOI] [PMC free article] [PubMed] [Google Scholar]
- Soutourina, O., Kolb, A., Krin, E., Laurent-Winter, C., Rimsky, S., Danchin, A., and Bertin, P. 1999. Multiple control of flagellum biosynthesis in Escherichia coli: Role of H-NS protein and cyclic AMP-catabolite activator protein complex in transcription of the flhDC master operon. J. Bacteriol. 181: 7500-7508. [DOI] [PMC free article] [PubMed] [Google Scholar]
- Staden, R. 1984. Computer methods to locate signals in nucleic acid sequences. Nucleic Acids Res. 12: 505-519. [DOI] [PMC free article] [PubMed] [Google Scholar]
- Stormo, G.D. and Fields, D.S. 1998. Specificity, free energy and information content in protein-DNA interactions. Trends Biochem. Sci. 3: 109-113. [DOI] [PubMed] [Google Scholar]
- Stormo, G.D. and Hartzell III, G.W. 1989. Identifying protein-binding sites from unaligned DNA fragments. Proc. Natl. Acad. Sci. 86: 1183-1197. [DOI] [PMC free article] [PubMed] [Google Scholar]
- Stormo, G.D, Schneider, T.D., Gold, L., and Ehrenfeucht, A. 1982. Use of the `Perceptron' algorithm to distinguish translational initiation sites in E. coli. Nucleic Acids Res. 10: 2997-3011. [DOI] [PMC free article] [PubMed] [Google Scholar]
- Stormo, G.D, Schneider, T.D., and Gold, L. 1986. Quantitative analysis of the relationship between nucleotide sequence and functional activity. Nucleic Acids Res. 14: 6661-6679. [DOI] [PMC free article] [PubMed] [Google Scholar]
- Wagner, R. 2000. Transcription regulation in prokaryotes. Oxford University Press, Oxford, UK.
- Zhang, M.Q. and Marr, T.G. 1993. A weight array method for splicing signal analysis. Comput. Appl. Biosci. 9: 499-509. [DOI] [PubMed] [Google Scholar]
WEB SITE REFERENCES
- http://arep.med.harvard.edu/dpinteract/; DPInteract.
- http://www.biomaps.rutgers.edu/bioinformatics/QPMEME.htm; QPMEME.
- http://www.cifn.unam.mx/Computational_Genomics/regulonDB; RegulonDB.
- http://www.ecocyc.org; EcoCyc database.