

Abstract
T cell antigen receptor (TCR)-mediated T cell activation requires the interaction of dozens of proteins. We used quantitative mass spectrometry and activated primary CD4+ T cells from mice in which a tag for affinity purification was knocked into several genes to determine the composition and dynamics of multiprotein complexes forming around the kinase Zap70 and the adaptors Lat and SLP-76. Most of the 112 high confidence time-resolved protein interactions we observed were novel. The CD6 surface receptor was found capable of initiating its own signaling pathway by recruiting SLP-76 and Vav1, irrespective of the presence of Lat. Our findings provide a more complete model of TCR signaling in which CD6 constitutes a signaling hub contributing to TCR signal diversification.
INTRODUCTION
When the T cell antigen receptor (TCR) binds an antigen, the immunoreceptor tyrosine-based activation motifs (ITAM) found in the associated CD3 chains are phosphorylated by the protein tyrosine kinase Lck. This allows the recruitment and activation of the protein tyrosine kinase Zap70 that in turn phosphorylates the transmembrane adaptor Lat. After its many tyrosine residues are phosphorylated, Lat provides docking sites for downstream effectors and nucleates the assembly of a multiprotein complex that is known as the Lat “signalosome”1,2. One protein that is recruited by Lat is the cytosolic adaptor SLP-76 (also known as LCP2). By recruiting enzymes and other adaptors into multiprotein complexes that amplify and diversify TCR signals, both Lat and SLP-76 are essential for T cell activation.
Based on the above model, the ablation of Lat was expected to prevent the propagation of all TCR signals by blocking the recruitment of SLP-76 at the plasma membrane. However, phosphorylation of a large number of proteins (including SLP-76 and protein kinase C-θ (PKC-θ)) and activation of the Akt signaling pathway remained unaffected after engagement of the TCR expressed on CD4+ T cells deprived of Lat molecules3–5. Likewise, some cytotoxic activity still occurred in Lat-deficient CD8+ T cells6. These results raise the issue of the nature of the cell-surface receptor that is capable of recruiting SLP-76 in the absence of Lat and of permitting its TCR-inducible phosphorylation. Together with other results, they clearly indicate that our understanding of the molecular networks underlying membrane-proximal signal processing following TCR engagement is incomplete. Most proteins, and signaling proteins in particular, act in the context of complexes with other proteins. Thus, knowledge of the composition and dynamics of signaling complexes is key to understand the mechanisms of cellular information processing7.
Affinity purification coupled with mass-spectrometry (AP-MS) allows highly sensitive and robust systematic analysis of protein complexes and protein interaction networks under physiological conditions8,9. Previous attempts to dissect the complexity of TCR-mediated T cell activation through mass-spectrometry relied on the analysis of transformed T cell lines10,11. These cell lines lack key signaling proteins12, a feature that precludes generalizing the conclusion of those studies to normal T cells. In the present study we combined mouse genetics and quantitative proteomics to obtain unbiased and comprehensive information on the signaling networks engaged in membrane-proximal TCR signaling in normal T cells. Specifically, we developed a series of gene-targeted mice bearing a genetic tag permitting AP-MS analysis of endogenous Zap70-, Lat- and SLP-76-containing signaling complexes isolated from primary CD4+ T cells. These efforts resulted in the identification of a membrane-proximal TCR signaling network that consists of 90 signaling proteins linked via 112 high-confidence interactions. The majority of these interactions have not yet been described in the literature. We also provide quantitative insights into the temporal reorganization of complexes that associate with Zap70, Lat and SLP-76 following CD4+ T cell activation. Importantly, by combining this protein interaction network with biochemical and genetic analysis, we demonstrated that, upon TCR engagement and phosphorylation by Zap70, the CD6 molecule that is expressed at the surface of CD4+ T cells constitutes the “missing” scaffold permitting recruitment of SLP-76 and Vav1 and the initiation of a Lat-independent signaling pathway.
RESULTS
Gene-targeted mice suitable for primary T cell proteomics
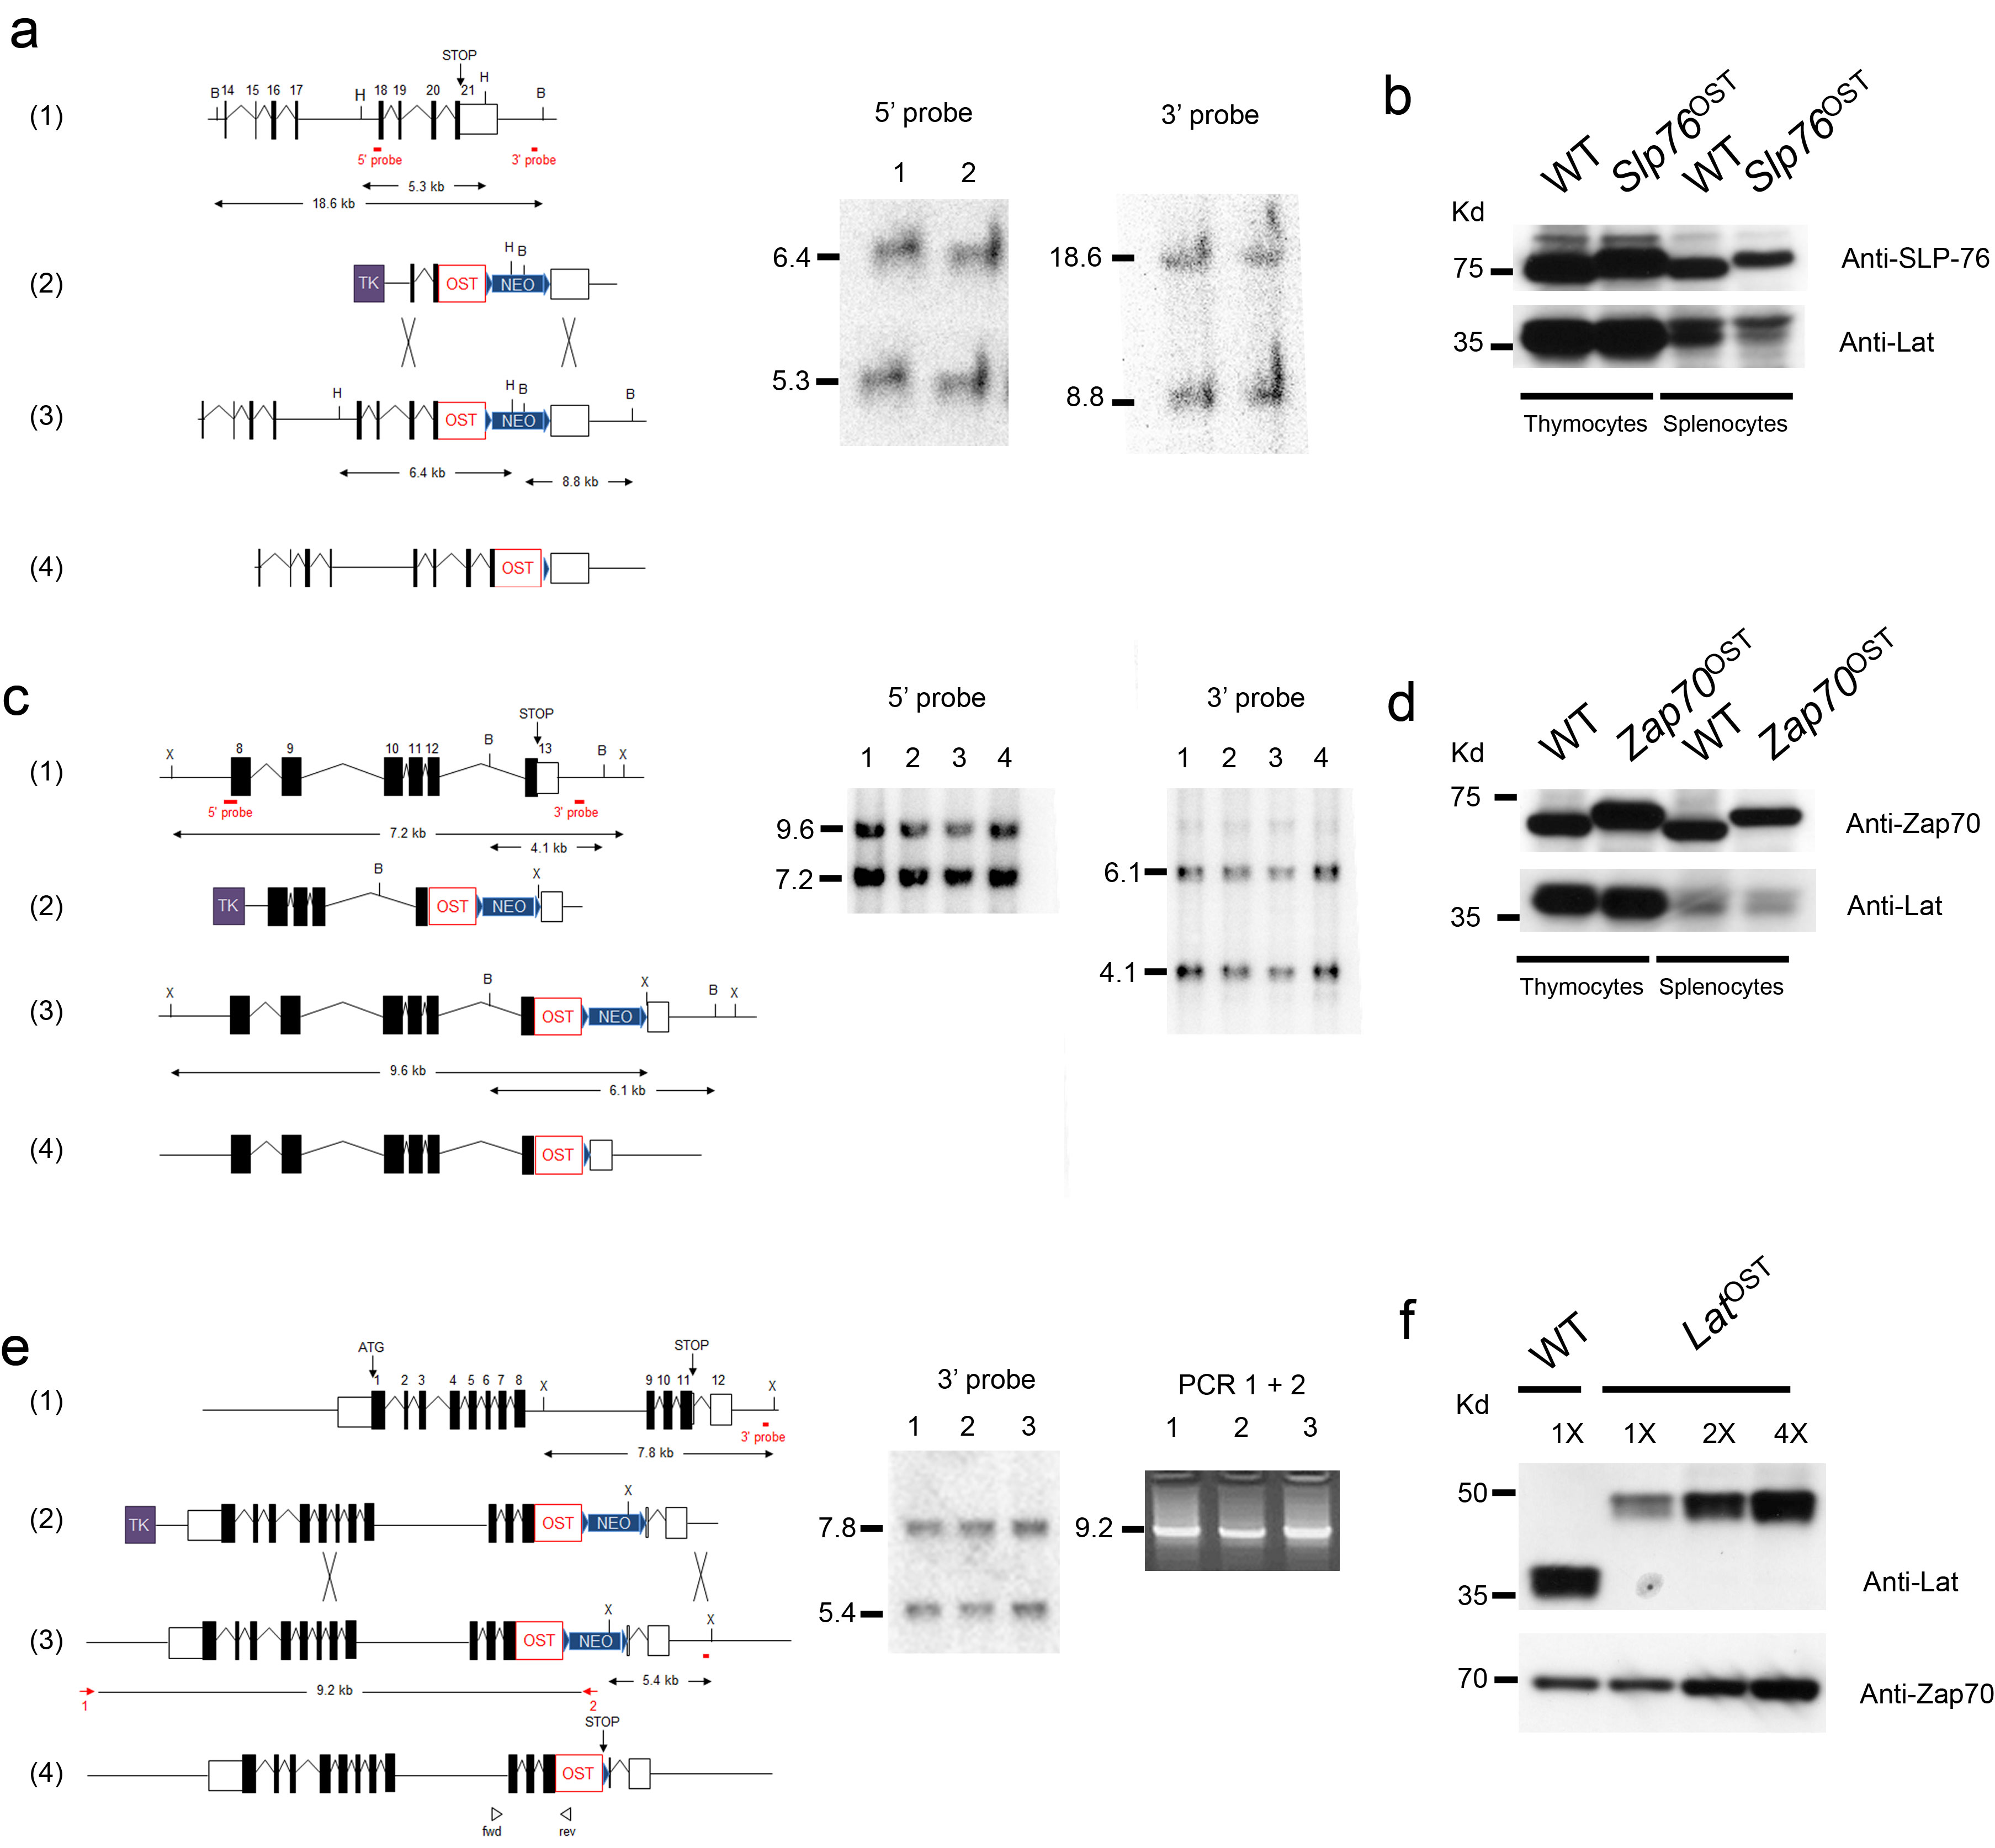
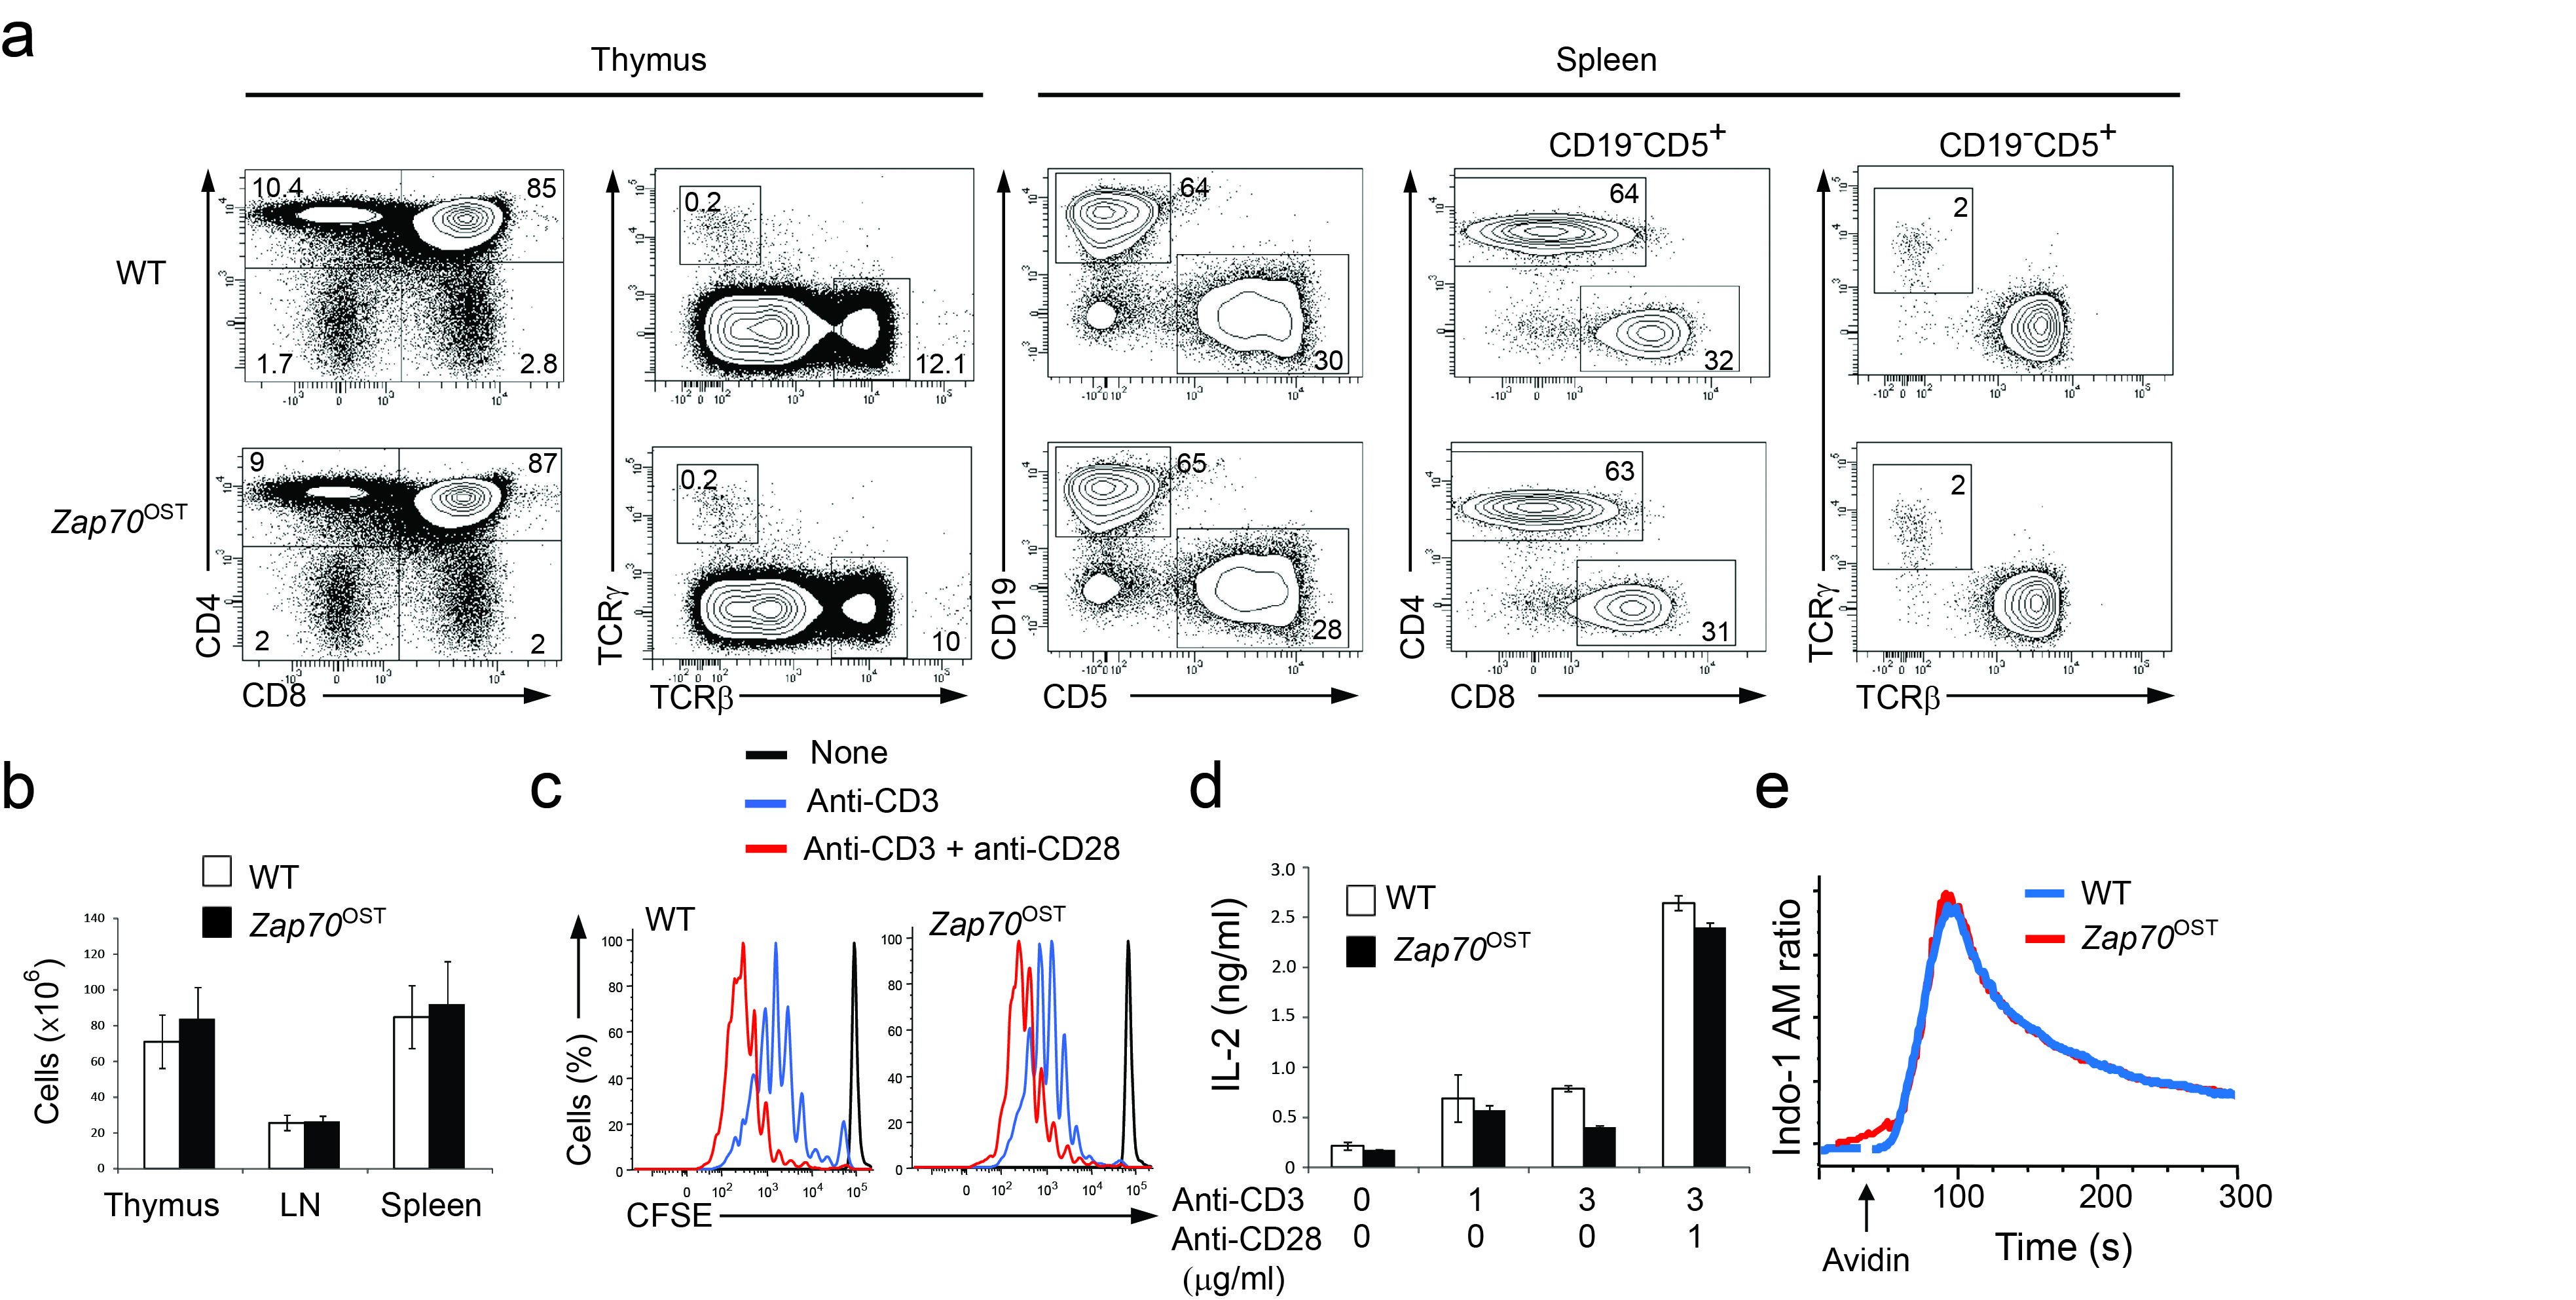
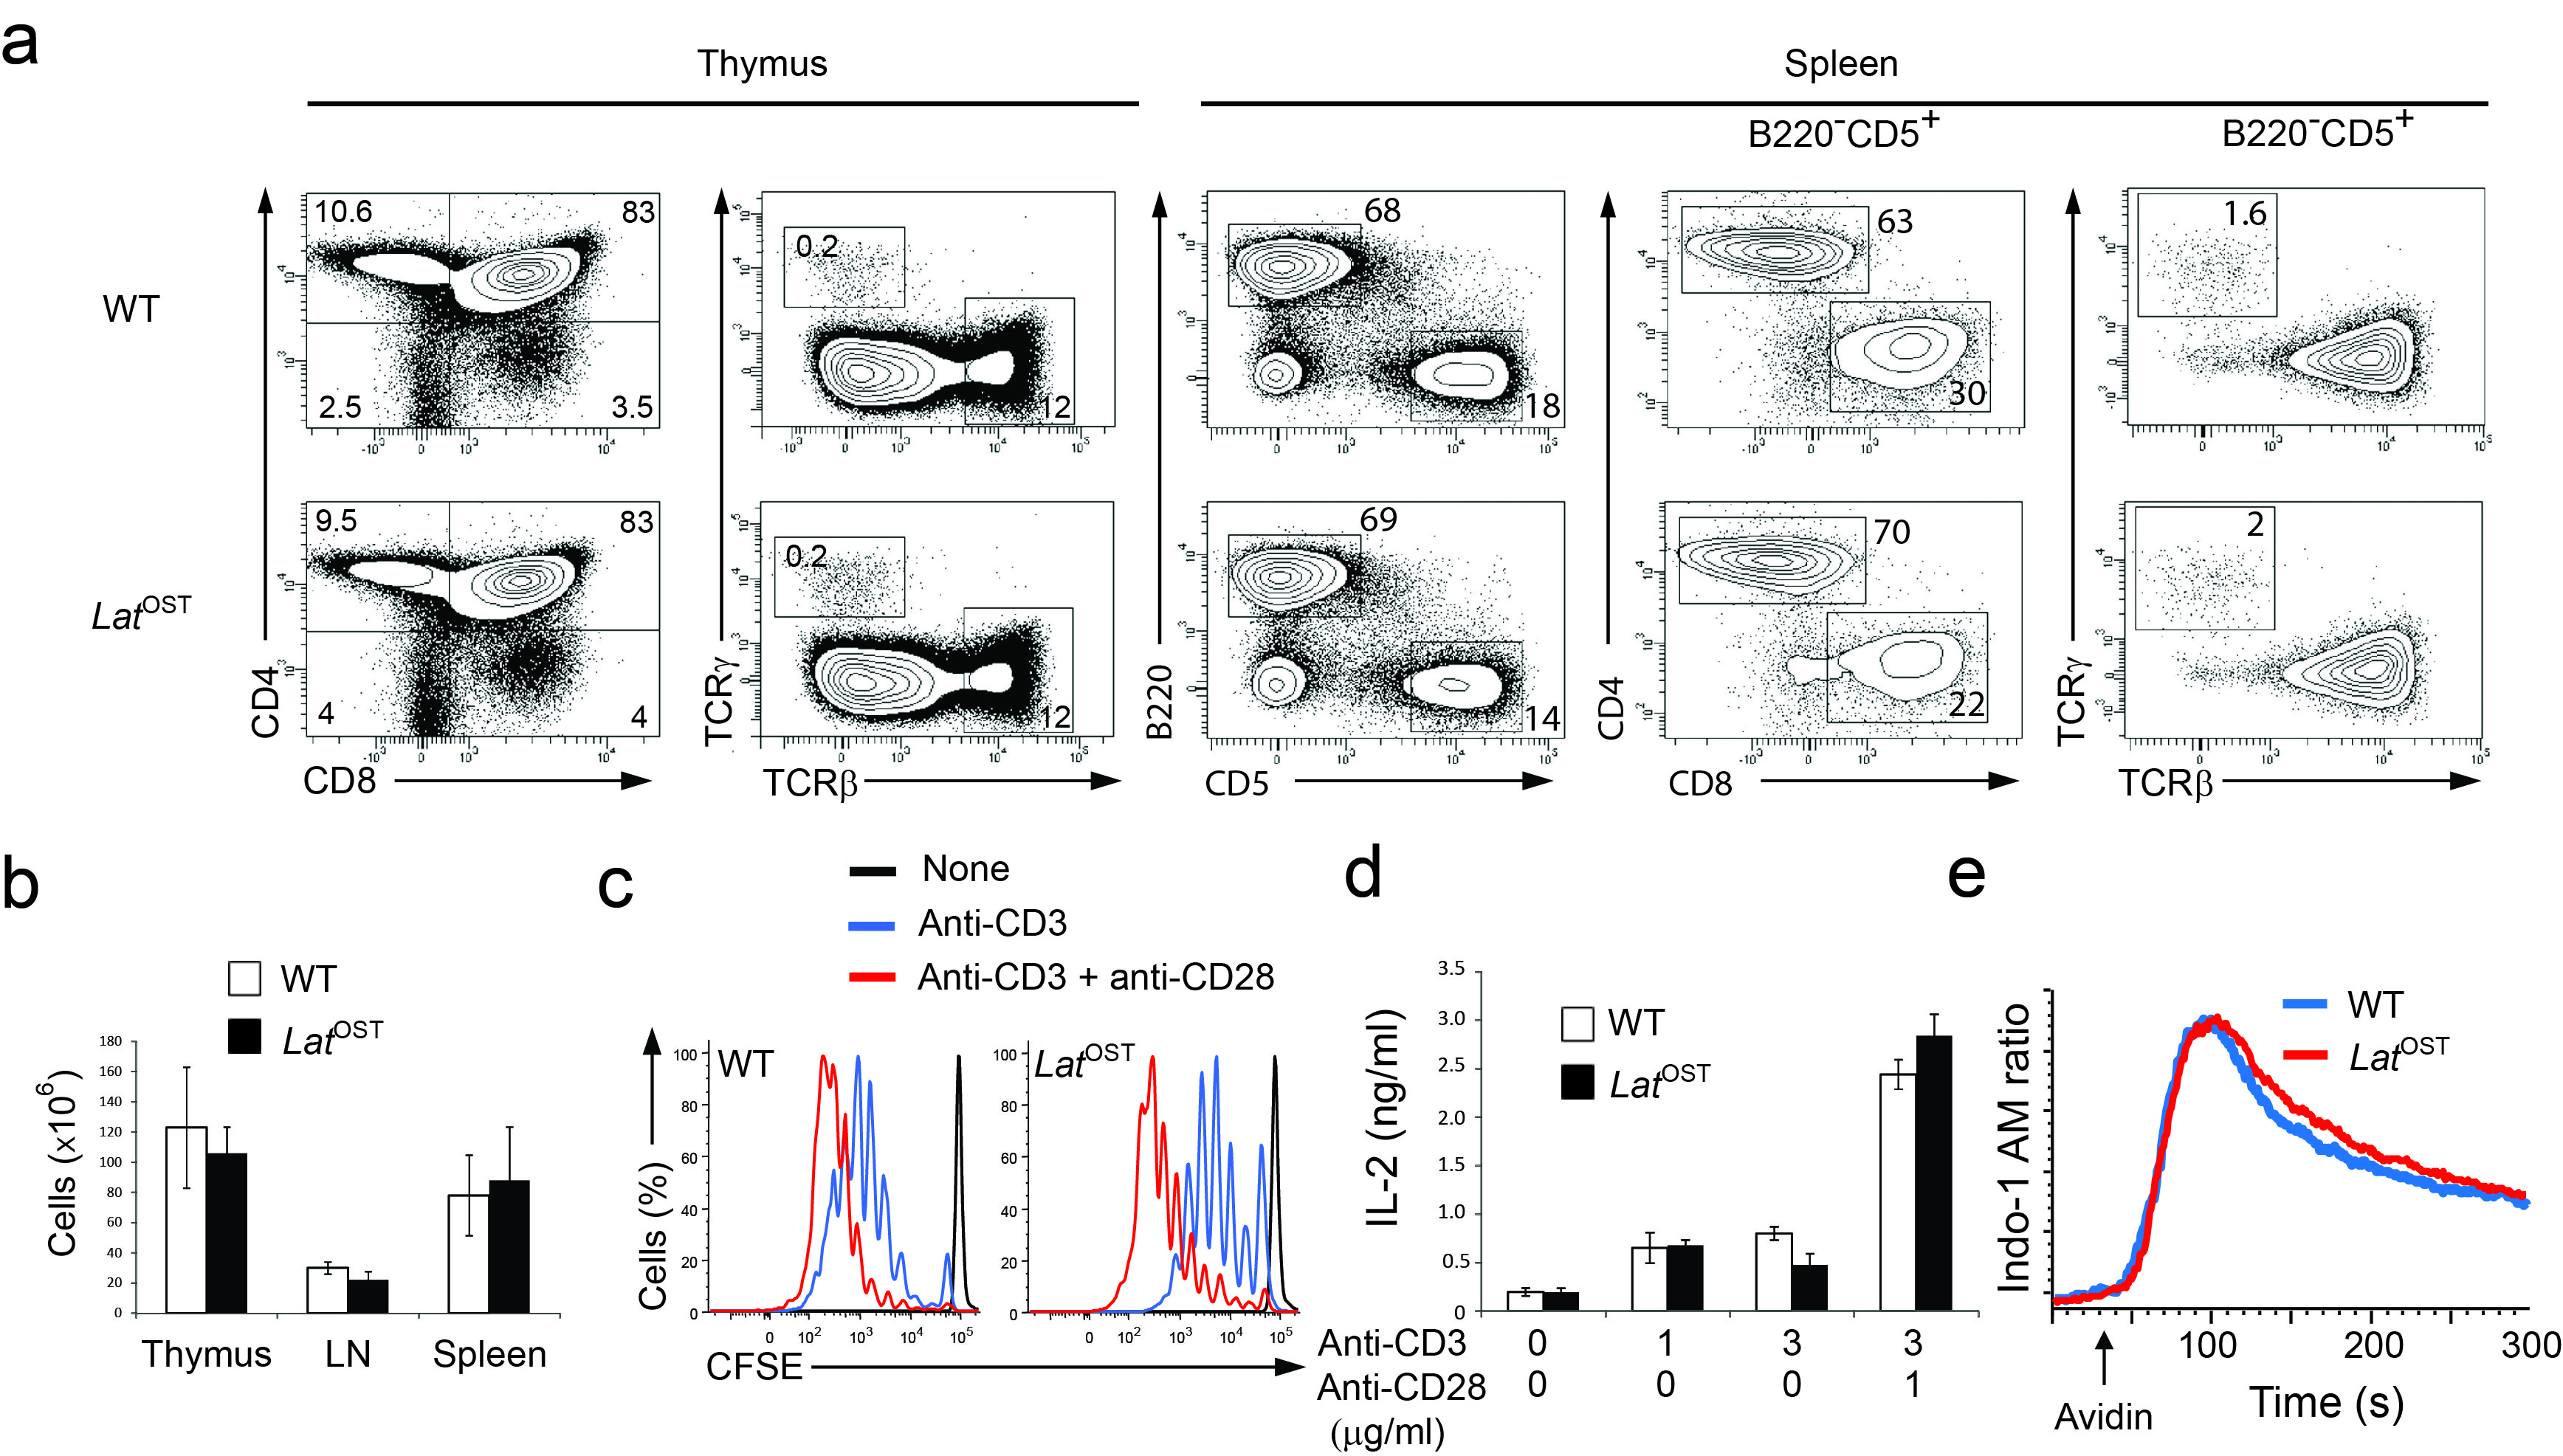
To understand how information is generated and propagated through the membrane proximal TCR signaling pathway of primary mouse T cells and identify novel actors of this pathway, we generated three lines of gene-targeted mice expressing a One-STrEP-tag (OST13) at the C-terminus of endogenous Zap70, Lat and SLP-76 proteins (Supplementary Fig. 1 a-f). As will be extensively described in the case of SLP-76 and outlined for Zap70 and Lat, these gene-targeted mice offered the possibility of performing AP-MS measurements in primary T cells. Immunoblots of thymocytes and splenocytes from mice homozygous for the Slp76OST allele (called “Slp76OST” mice here) and from wild-type mice showed that the addition of the 29-amino acid-long OST sequence resulted in SLP-76-OST molecules with a higher molecular weight than that of wild-type SLP-76 molecules and had no effect on SLP-76 expression (Supplementary Fig. 1b). Analysis of the thymus of Slp76OST mice showed a normal sequence of T cell development and Slp76OST spleen contained normal numbers of γδ cells and of CD4+ and CD8+ T cells with a normal phenotype (Fig. 1a,b). Comparison of CD4+ and CD8+ T cells purified from wild-type and Slp76OST mice that were stimulated with antibody to CD3 in the presence or absence of anti-CD28 showed that SLP-76-OST molecules had no detrimental effect on their proliferation (Fig. 1c) or production of interleukin 2 (IL-2) (Fig. 1d). Wild-type and Slp76OST T cells also showed a similar pattern of intracellular calcium mobilization after engagement of the TCR (Fig. 1e). In contrast to SLP-76-OST and Zap70-OST molecules, a lower expression, corresponding to 25% of wild-type Lat molecules, was observed for Lat-OST molecules, (Supplementary Fig. 1d,f). Analysis of developing and mature T cells from mice homozygous for the Zap70OST or LatOST alleles (called “Zap70OST” and “LatOST” mice, respectively) showed that both Zap70-OST and Lat-OST molecules functioned properly (Supplementary Fig. 2 and 3). Therefore CD4+ T cells of Zap70OST, LatOST and Slp76OST knock-in mice are normal.
Figure 1.

Normal development and function of T cells isolated from knock-in mice homozygous for the Slp76OST allele. (a) Flow cytometry analysis of thymus and spleen.Thymocytes from wild-type (WT) and Slp76OST (also known as B6-Lcp2tm2Mal) mice were analyzed for expression of CD4 and CD8 (left) and TCRαβ and TCRγδ (right). Numbers adjacent to outlined areas indicate percent double-positive cells (top right), CD4+ single-positive cells (top left), CD8+ single-positive cells (bottom right) and double-negative CD4− CD8− cells (bottom left). Wild-type and Slp76OST splenocytes were analyzed for expression of CD5 (a marker specific of T cells) and CD19 (a marker specific of B cells). Numbers adjacent to outlined areas indicate percent B cells (upper left) and T cells (bottom right). The expression of CD4 and CD8 and of TCRαβ and TCRγδ by T cells (identified as CD19−CD5+ cells). Numbers adjacent to outlined areas indicate percent CD4+ and CD8+ cells (middle) and TCRαβ and TCRγδ cells (right). Data are representative of at least three experiments with two mice per genotype. (b) Cellularity of thymus, pooled axillary, brachial, inguinal and mesenteric lymph nodes (LN) and spleen from wild-type and Slp76OST mice. Data are expressed as mean value ± SEM (n = 6). (c) CFSE dilution by wild-type, and Slp76OST CD4+ T cells activated for 72 h with plate-bound anti-CD3 (3 μg/ml) in the presence or absence (key) of soluble anti-CD28 (1 μg/ml). Dotted lines, CFSE dilution at initiation of culture. (d) IL-2 in supernatants of wild-type, and Slp76OST CD4+ T cells activated for 72 h as in (c). (e) Changes in intracellular calcium in wild-type, and Slp76OST CD4+ T cells stimulated with biotinylated anti-CD3 and avidin. Arrow corresponds to the time of addition of avidin. Data are representative of at least two experiments. Corresponding results for Zap70OST and LatOST T cells are shown in Supplementary Figures 2,3.
Primary T cells are amenable to proteomic analysis
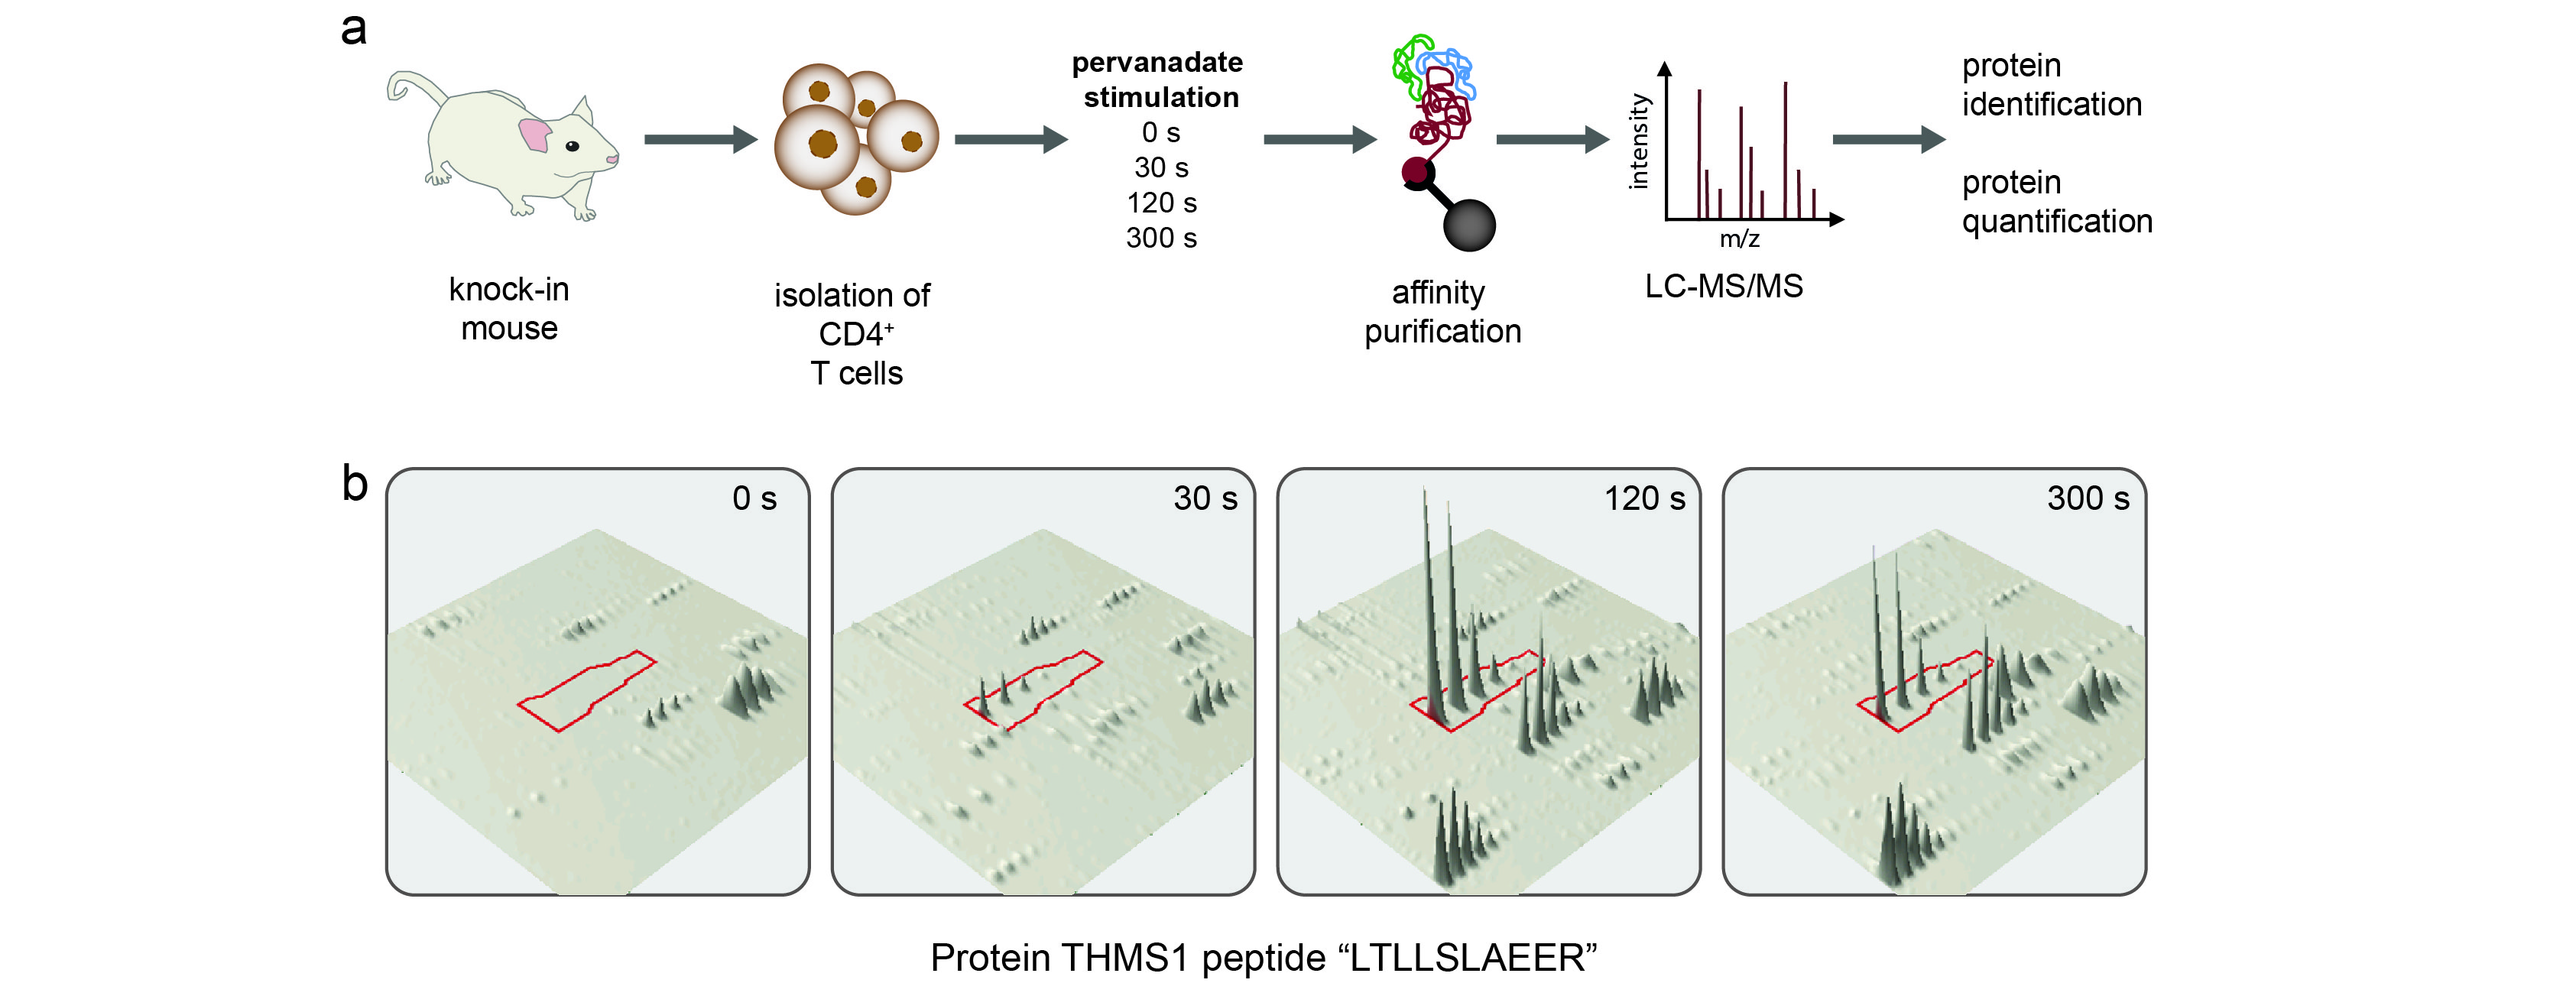
Comparison of wild-type and Slp76OST CD4+ T cells after stimulation with anti-CD3 alone or in combination with anti-CD4 demonstrated that the OST sequence had no measurable effect on the global pattern of TCR-induced tyrosine-phosphorylated species (Fig. 2a). Immunoblot analysis of tyrosine-phosphorylated species showed that protein complexes were efficiently affinity purified from Slp76OST CD4+ T cells prior to and after activation using Sepharose beads coupled to Strep-Tactin, a streptavidin derivative that binds with a high affinity to the OST sequence (Fig. 2b). As expected, no material was recovered from wild-type CD4+ T cells (Fig. 2b). To reach maximal T cell responses, the protein tyrosine phosphatase inhibitor pervanadate was also used as a surrogate for anti-CD3 plus anti-CD4 stimulation14. Akin to anti-CD3 and anti-CD4 stimulation, pervanadate treatment of Slp76OST CD4+ T cells for 30, 120 and 300 s induced a robust association of several tyrosine-phosphorylated species to SLP-76-OST whereas these associations were not detected in samples from wild-type CD4+ T cells (Fig. 2c). Similar results were obtained with CD4+ T cells isolated from LatOST and Zap70OST mice (data not shown). Therefore, primary CD4+ T cells from Slp76OST, LatOST and Zap70OST mice are amenable to AP-MS analysis.
Figure 2.

Purification of SLP-76–associated protein complexes from CD4+ T cells from Slp76OST mice. (a,b) CD4+ T cells from wild-type (WT) or Slp76OST mice were left unstimulated or stimulated for 2 min with anti-CD3 in the presence or absence (key) of anti-CD4. (a) Equal amounts of proteins from total lysates were directly analyzed by immunoblot with anti-phosphotyrosine (Anti-P-Tyr) or anti-SLP-76. (b) Equal amounts of cell lysates were subjected to affinity purification on Strep-Tactin-Sepharose beads and proteins eluted from Strep-Tactin-Sepharose beads with D-biotin were analyzed by immunoblot as in (a). (c) CD4+ T cells from wild-type (WT) or Slp76OST mice were left unstimulated (0) or stimulated with pervanadate for 30, 120 and 300 s and analyzed as in (a). Immunoblot analysis also includes GADS. Data in a-c are representative of at least three independent experiments. (d) Venn diagrams showing the extent of overlap existing between the SLP-76 interacting proteins identified in CD4+ T cells from Slp76OST mice following stimulation with pervanadate or anti-CD3 plus anti-CD4. For more details on the identified high confidence interacting proteins see Supplementary Table 1.
Characterization of Zap70, Lat and SLP-76 complexes
To identify the interacting partners of Zap70, Lat and SLP-76 (denoted as the Zap70, Lat and SLP-76 interactomes here), CD4+ T cells isolated from the corresponding gene-targeted mice were lysed in n-dodecyl-β-maltoside prior to or at different time points after pervanadate activation and the protein complexes containing Zap70-OST, Lat-OST or SLP-76-OST were isolated using Strep-Tactin-Sepharose beads. After elution with D-Biotin, a ligand that binds to Strep-Tactin with a higher affinity than the OST sequence, protein complexes were subjected to liquid chromatography coupled tandem mass spectrometry (LC-MS/MS) analysis (Supplementary Fig. 4 and Online Methods). Proteins were identified with a false discovery rate of <1%. To differentiate true interacting proteins from non-specific contaminants, we compared our data to control purification experiments using wild-type CD4+ T cells, based on normalized spectral count values15. Furthermore, true interacting proteins had to be observed in at least two out of three biological replicates (Supplementary Table 1).
Combining the high-confidence interaction data obtained for the Zap70, Lat and SLP-76 complexes purified prior to and after different times of CD4+ T cell activation resulted in a network of 90 unique proteins (including the 3 baits) that were connected via 112 interactions (Fig. 3 and Supplementary Table 1). A fraction of the identified proteins associated with more than one bait (“shared interactome”; Fig. 3). A large spectrum of functional activities was found among the 90 identified proteins, including protein and lipid kinases, protein and lipid phosphatases, regulators of small protein G activity, ubiquitin ligases and phospholipases (Fig. 3). The Zap70-Lat-SLP-76 protein network showed a significant enrichment for proteins containing Src-homology 2 (SH2) and 3 (SH3) and Pleckstrin Homology (PH) domains (Supplementary Fig. 5a), suggesting a multitude of protein-protein and protein-phospholipid interactions. When T cells were activated by anti-CD3 and anti-CD4, the resulting SLP-76 interactome largely overlapped that observed after pervanadate stimulation (Fig. 2d and Supplementary Table 1).
Figure 3.

Protein-protein interactions within the Zap70–Lat–SLP-76 interaction network of mouse CD4+ T cells. Bait proteins corresponded to the Zap70, Lat and SLP-76 proteins. Protein-protein interactions were identified by affinity purification and mass-spectrometry prior to and at 30, 120 and 300 s after stimulation and visualized using Cystoscape v.2.8.3. Several proteins were found associated with more than one bait (“shared interactome”). Zap-70 was the only tested bait capable of capturing the subunits of the TCR-CD3 complex (blue box). Node functions were assigned according to the legend shown in the top left corner and encompass transmembrane receptor, tyrosine or serine/threonine protein kinase (Kinase), phospholipid or tyrosine protein phosphatase (Phosphatase), guanine exchange factor (GEF), GTP-ase activating protein (GAP), ion channel, transporter, ubiquitin ligase (E3 ligase). The depicted interactions have been observed in at least two out of three independent experiments involving three biological replicates each. Each of the proteins is denoted by its Uniprot symbol (see Supplementary Table 1) except LCP2 that is called SLP-76. For more details on identified high confidence network components and protein interaction see also Supplementary Tables 1,2.
Dynamics of the Zap70, Lat and SLP-76 interactomes
Among the 90 proteins constituting the Zap70-Lat-SLP-76 network, 73% qualified for label-free quantitative analysis (Online Methods), allowing us to quantify their kinetics of assembly with and disassembly from the baits after T cell stimulation. Over the first 300 s of stimulation, protein assemblages of increasing complexity formed around Zap70, Lat and SLP-76 (Fig. 4). The GRAP2 adaptor (also known as GADS) was the sole protein found to associate constitutively with SLP-76 (Fig. 4), a finding consistent with its reported ability to bind to SLP-76 with high affinity and in a constitutive manner16. A similar trend was observed for several Lat-interacting partners including DOCK2, the transferrin receptor TFR1 and the GTPase GVIN1 (cluster C2; Fig. 4). A subset of proteins showed a maximal association with Lat or Zap70 only 30 s after stimulation (cluster C1; Fig. 4). Among those “early binders” VAV and DOCK10 had a transient pattern of binding that peaked 30 to 120 s after stimulation. The binding of several proteins (e.g. PLC-γ1, GRB2, THEMIS, PI3KR1, SOS) to Lat and SLP-76 reached a plateau 120 s after stimulation (cluster C3; Fig. 4). The THEMIS protein belongs to cluster C3, confirming that it acts during early TCR signalling. Phosphorylation of SLP-76 and GADS by the serine-threonine kinase MAP4K1 (also known as HPK1) induces their interaction with members of the 14-3-3 protein family and results in their uncoupling of SLP-76 and GADS from Lat17,18. As expected for such a negative feedback loop, SLP-76 started interacting with MAP4K1 and with the ε, γ, τ and ξ isoforms of the 14-3-3 protein family only after 120 s of stimulation (Fig. 4). Taken together, these quantitative data represent the first systematic view of the temporal reorganization that occurred in the Zap70–Lat–SLP-76 protein network following stimulation of primary CD4+ T cell and thus represents a rich resource for directing future functional experiments on the mechanism of membrane proximal events linked to T cell activation.
Figure 4.

Kinetics of protein binding to the Zap70, Lat and SLP-76 baits. The kinetics of binding to a given protein bait after stimulation were determined by label-free quantitative analysis and interacting proteins were clustered based on their similarities. Four distinct clusters (C1 to C4; see margin of each heat map) were identified using Euclidean distance correlation. The names of the proteins are indicated in the margin of each heat map (see description in Supplementary Table 1). Time is shown in seconds above each heat map; time 0 corresponds to unstimulated CD4+ T cells. Relative levels of association are shown in rainbow-like, false-color scale increasing from black to red. Blue dots represent molecules belonging to TCR-CD3 complex. Data are representative of three independent experiments involving three biological replicates each.
Cell-surface receptors in the Zap70–Lat–SLP-76 network
Many cell-surface receptors associate with intracellular effectors and scaffold proteins. In addition to the TCR, the Zap70–Lat–SLP-76 protein network contained several transmembrane receptors that are expressed at the surface of CD4+ T cells. Congruent with its capacity to bind to the phosphorylated ITAM present in CD3 subunits, Zap70 was the sole bait found complexed to the six subunits of the TCR-CD3 complex following activation (Fig. 3). Moreover, the Zap70 interactome (Fig. 3) comprised the integrin αL chain ITGAL that together with ITGB2 forms the integrin lymphocyte function-associated antigen-1 (LFA-1) molecule, a finding consistent with a recent report19. As previously documented for the Jurkat T cell line20, the transferrin receptor TFR1 (also known as CD71) interacted with Zap70 and we also demonstrated that it could form complexes with Lat (Fig. 3). Likewise, LY9 (also known as CD229 or SLAMF3) was also found associated with both Zap70 and Lat (Fig. 3). It remains, however, to be demonstrated whether the CD71 and CD229 receptors expressed at the surface of primary CD4+ T cells contribute signals via Zap70 and Lat in concert or independent of the TCR.
CD6 associates with SLP-76 in primary T cells
As discussed above, engagement of the TCR results in SLP-76 phosphorylation in T cells deprived of Lat3–5, suggesting that transmembrane adaptors or receptors distinct from Lat are also capable of recruiting SLP-76 following T cell activation. Analysis of the SLP-76 interactome showed that CD6 - a 100- to 130-kDa type 1 transmembrane glycoprotein expressed at the surface of T cells and possessing a long intracytoplasmic extension - was capable of associating to SLP-76 within tens of seconds after T cell stimulation (Fig. 3,4 and Supplementary Tables 1,2). Moreover, we found that CD6 rapidly associated with the Zap70 bait after T cell stimulation (Fig. 3,4).
To confirm by immunoblot the capacity of CD6 to associate with SLP-76 after activation of primary T cells, CD4+ T cells isolated from Slp76OST mice were left unstimulated or stimulated with pervanadate for up to 300 s. Affinity purification of the corresponding lysates using Strep-Tactin-Sepharose beads followed by immunoblot analysis confirmed that the SLP-76 bait was capable of rapidly binding to CD6 in an activation-dependent manner (Fig. 5a). Consistent with the constitutive SLP-76–GADS association observed in our quantitative mass spectrometry experiments, the SLP-76 bait associated equally with GADS prior to and after stimulation (Fig. 5a). Importantly, stimulation of CD4+ T cells with anti-CD3 and anti-CD4 also resulted in the rapid docking of the SLP-76 bait to CD6 (Fig. 5b). Moreover, reciprocal immunoprecipitation experiments performed with CD6 antibodies independently confirmed the association of CD6 with SLP-76 after anti-CD3 and anti-CD4 stimulation (Fig 5c). Consistent with previous studies21, 22, we showed that CD6 undergoes tyrosine phosphorylation after anti-CD3 and anti-CD4 stimulation (Fig. 5d). The guanine nucleotide exchange factor Vav1 also associated with CD6 after anti-CD3 and anti-CD4 stimulation (Fig. 5e). Therefore, engagement of the TCR expressed in primary CD4+ T cells resulted in the phosphorylation of CD6 and in its association with SLP-76 and Vav1. As suggested by surface plasmon resonance, the CD6–SLP-76 association involves the direct recognition of a phosphorylated peptide encompassing a tyrosine residue found at position 662 of the CD6 cytoplasmic segment by the SH2 domain of SLP-76 (ref. 23).
Figure 5.

CD6 associates to SLP-76 after TCR engagement. (a) CD4+ T cells from wild-type (WT) or Slp76OST mice were left unstimulated (0) or stimulated for 30, 120 and 300 s with pervanadate. Cell lysates were directly processed for immunoblot (Total lysates: TL) or subjected to affinity purification on Strep-Tactin-Sepharose beads (Affinity purification: AP). Equal amount of lysates and eluates were analyzed by immunoblot with anti-CD6, anti-SLP-76 and anti-GADS. (b) CD4+ T cells from wild-type (WT) or Slp76OST mice were left unstimulated or stimulated for 30 and 120 s with anti-CD3 and anti-CD4. Cell lysates were directly processed for immunoblot (Total lysates) or subjected to affinity purification (AP) as described in (a). Equal amount of lysates or eluates were analyzed by immunoblot with anti-CD6 or anti-SLP-76. (c) CD4+ T cells from wild-type mice were left untreated (-) or stimulated for 2 min with anti-CD3 and anti-CD4 (+). Total lysates (TL) were directly analyzed by immunoblot (IB) or subjected to immunoprecipitation (IP) with an anti-CD6 (Anti-CD6 IP). Total lysates and anti-CD6 immunoprecipitates were analyzed by immunoblot (IB) with anti-CD6 or anti-SLP-76. (d) CD4+ T cells from wild-type mice were treated as in c. Total lysates were immunoprecipitated (IP) with an anti-CD6 (CD6) or an isotype control antibody (iso). Total lysates and anti-CD6 immunoprecipitates were analyzed by immunoblot with anti-phosphotyrosine (Anti-p-Tyr) or anti-CD6. (e). CD4+ T cells from wild-type mice were treated as in (c). Total lysates were immunoprecipitated with anti-Vav1. Total lysates(TL) and anti-Vav1 immunoprecipitates (IP) were analyzed by immunoblot (IB) with anti-Vav1 or anti-CD6. Data in (a) to (e) are representative of at least two independent experiments.
CD6–SLP-76 association requires Zap70
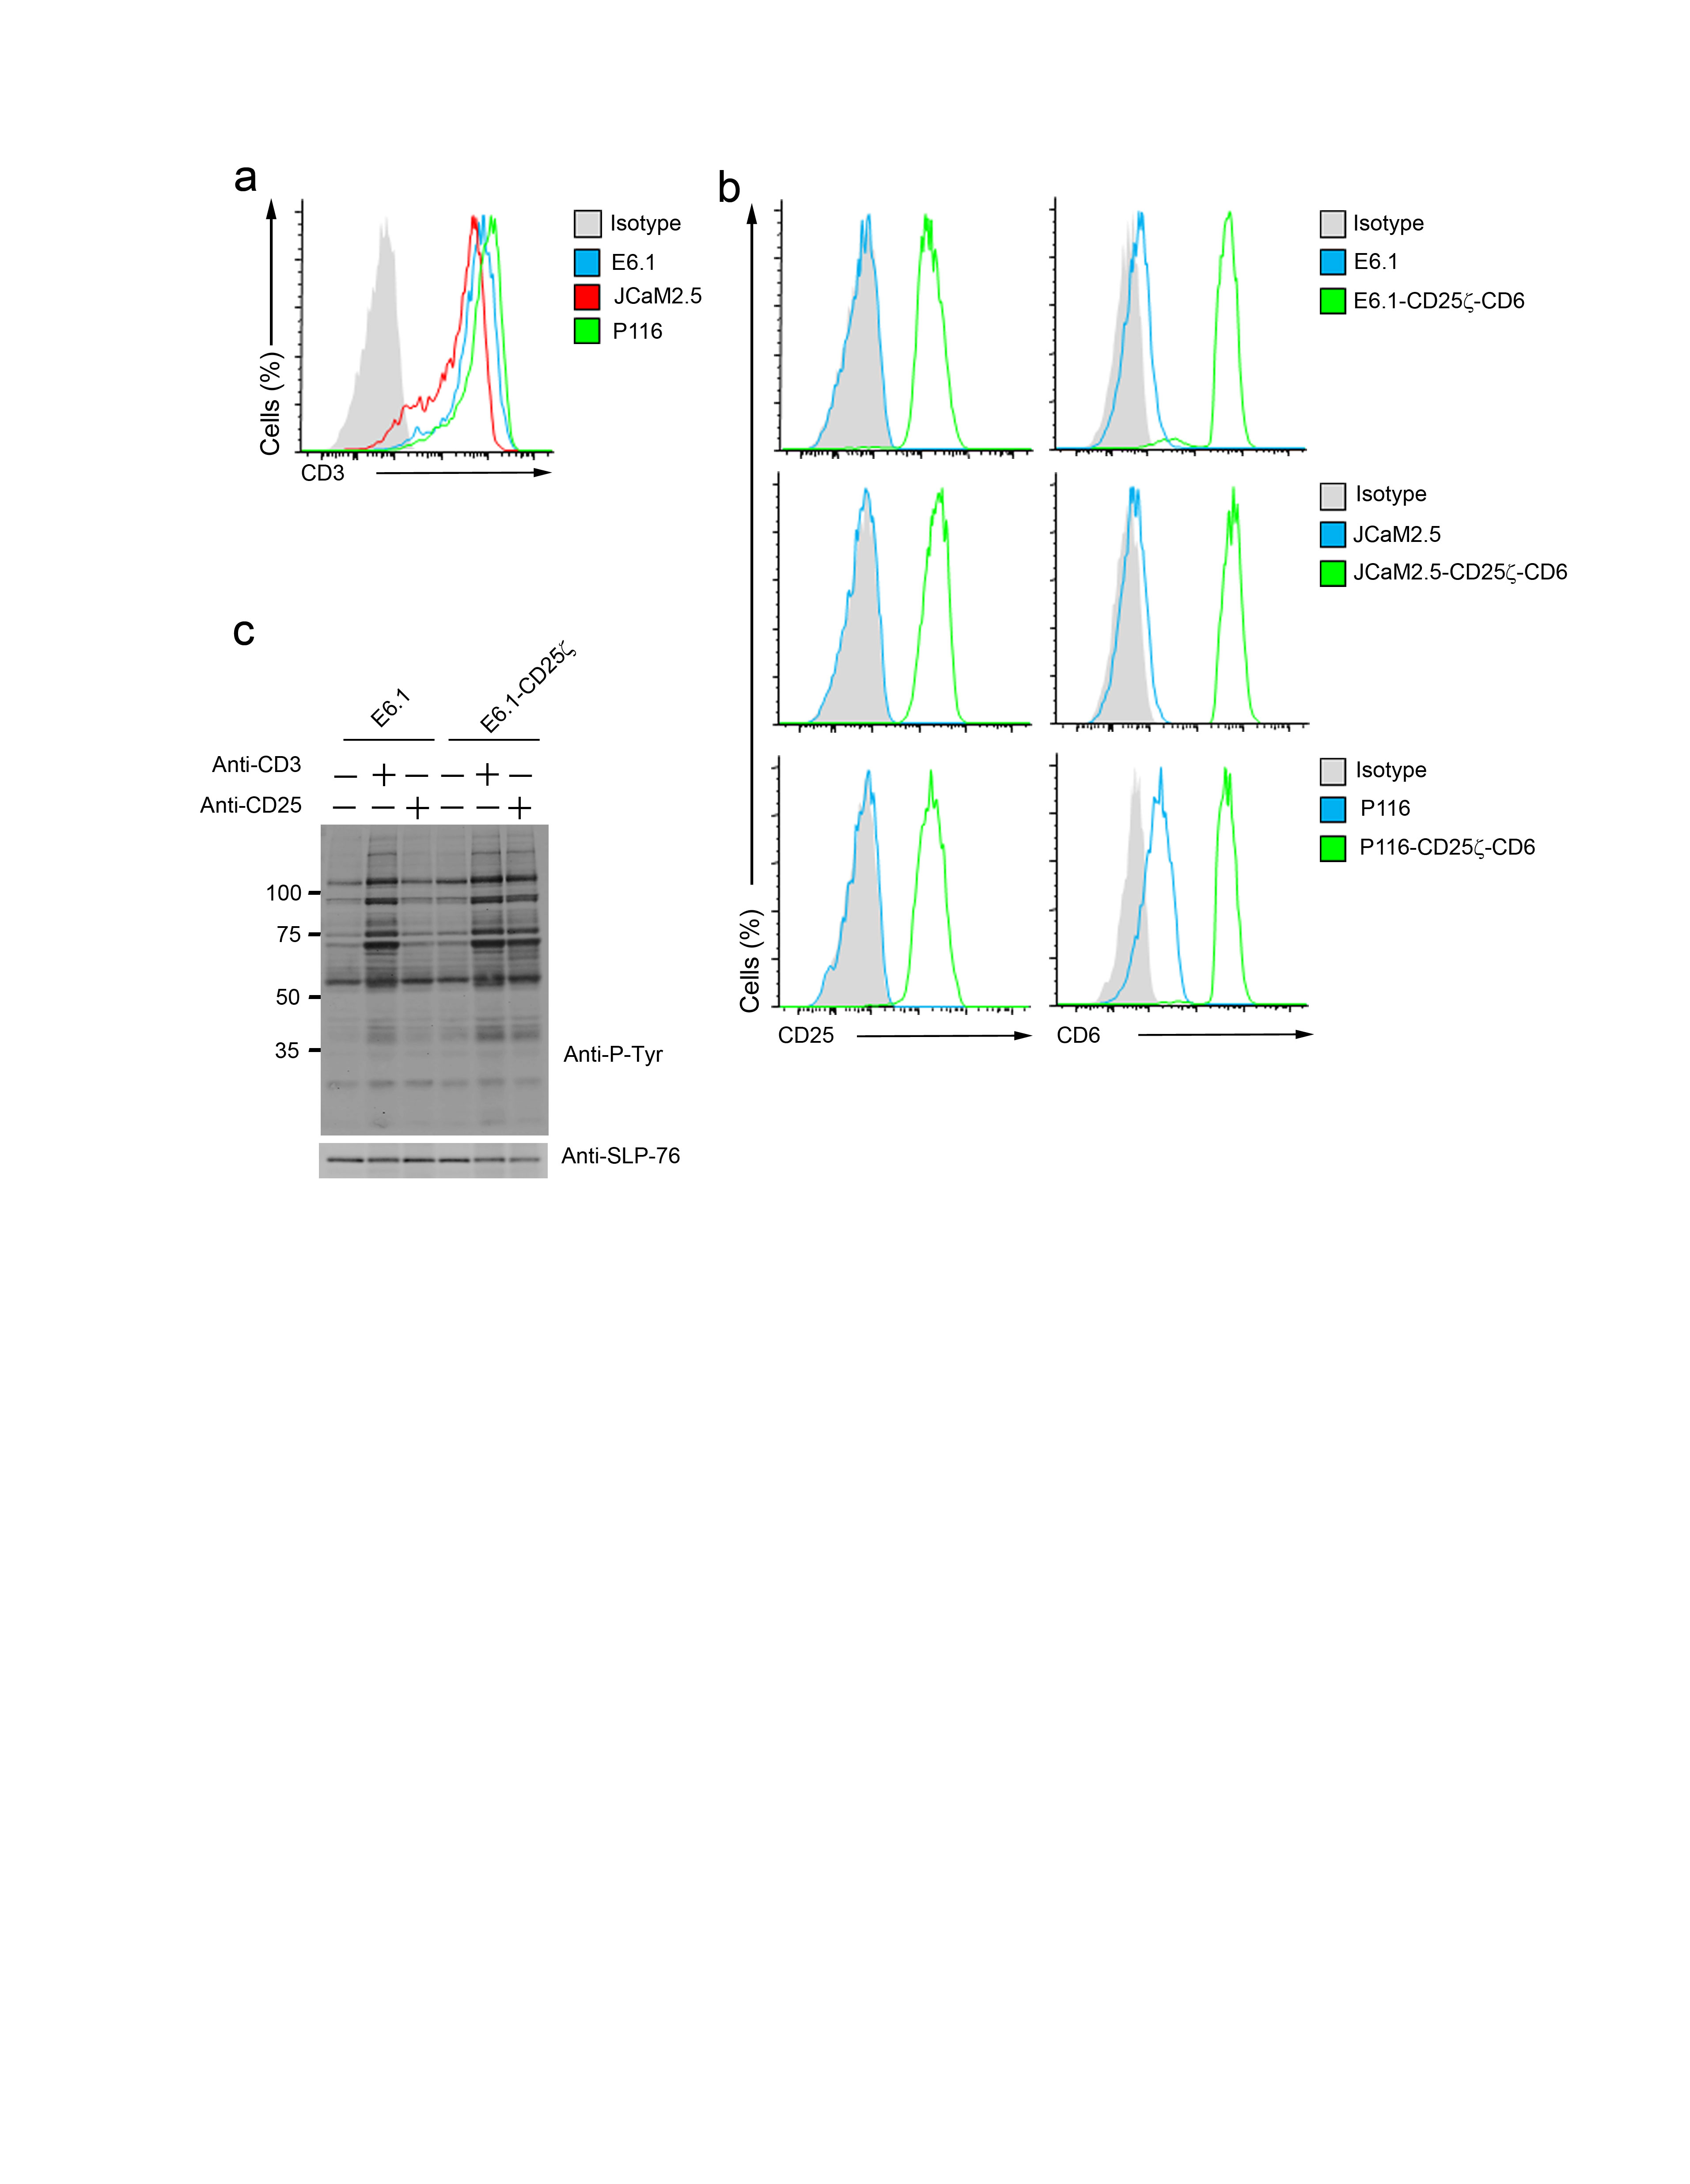
Using Jurkat T cells (E6.1 clone) deficient for Zap70 (P116)24 or Lat (JCaM2.5)24,25, we analyzed the respective contributions of Zap70 and Lat to the TCR-inducible CD6–SLP-76 association. Since Jurkat cells and their variants expressed different amounts of TCR at their surface (Supplementary Fig. 6a), we transfected them with surrogate TCR-CD3 complexes consisting of chimeric constructs coding for the extracellular and transmembrane regions of human CD25 fused to the cytoplasmic region of mouse CD3ξ26-28. The resulting E6.1-CD25ξ, P116-CD25ξ and JCaM2.5-CD25ξ transfectants expressed identical amounts of CD25ξ (Supplementary Fig. 6b), permitting delivery of equivalent levels of ITAM-mediated signals upon anti-CD25 cross-linking (Supplementary Fig. 6c). Due to the expression of variableamounts of CD6, the E6.1-CD25ξ, P116-CD25ξ and JCaM2.5-CD25ξ cells were further transfected with a human CD6 cDNA and transfectants were selected for matched surface expression of CD6 (Supplementary Fig. 6b). After stimulation with anti-CD25, E6.1-CD25ξ–CD6 transfectants showed the expected pattern of induced phosphorylated species (Fig. 6a and ref. 26). Immunoprecipitation experiments with anti-CD6 and immunoblot analysis with antibody to phosphorylated tyrosine showed that CD25ξ signaling strongly increased the basal content of CD6 phosphorylation observed in E6.1-CD25ξ–CD6 cells (Fig. 6b). Comparison of E6.1-CD25ξ–CD6 cells and of Zap70-deficient P116-CD25ξ–CD6 cells demonstrated that both the basal and the CD25ξ-inducible tyrosine phosphorylation of CD6 strongly depended on the expression of Zap70 (Fig. 6b). Moreover, in the absence of Zap70, no CD25ξ-inducible association occurred between CD6 and SLP-76 (Fig. 6b). Therefore, the CD6-Zap70 interaction documented in AP-MS experiments (Fig. 3 and 4) was functionally relevant in that the expression of Zap70 was mandatory to trigger maximal tyrosine phosphorylation of CD6 upon cross-linkage of CD25ξ, thereby permitting CD6 to recruit SLP-76.
Figure 6.

SLP-76 associates with CD6 in a Lat-independent manner. (a,b) Jurkat cells (clone E6.1) and their Zap70-deficient (P116) and Lat-deficient (JCam2.5) variants were transfected to co express CD25ξ and human CD6. The resulting E6.1-CD25ξ-CD6 and P116-CD25ξ–CD6 cells were left unstimulated (-) or were stimulated (+) for 2 min with anti-CD25. Total lysates (a) or anti-CD6 immunoprecipitates (b) were analyzed by immunoblot with anti-phosphotyrosine (Anti-p-Tyr), anti-Zap70 and anti-CD6. (c) E6.1-CD25ξ-CD6 and JCam2.5-CD25ξ-CD6 were stimulated as in (a). Total lysates were analyzed by immunoblots with anti-CD6, anti-phosphotyrosine (Anti-p-Tyr), anti-SLP-76 and anti-LAT. (d) E6.1-CD25ξ-CD6 and JCam2.5-CD25ξ-CD6 cells were stimulated as in (a) and total lysates were subjected to immunoprecipitation with an anti-SLP-76. Immunoprecipitates (IP) were analyzed by immunoblots with anti-CD6, anti-phosphotyrosine (Anti-p-Tyr), anti-SLP-76 and anti-LAT. (e) CD4+ T cells made defective in Lat (LatΔ/Δ; see Online Methods) and wild-type CD4+ T cells (Lat+/+) were stimulated with anti-CD3 and anti-CD4 for 2 min at 37 °C. Total lysates(TL) and anti-SLP-76 immunoprecipitates (IP: anti-SLP-76) were analyzed by immunoblots (IB) with anti-CD6, anti-SLP-76 and anti-LAT. (f) Lat-deficient, JCam2.5-CD25ξ cells lacking CD6 (CD6−) or expressing CD6 (CD6+) were left unstimulated (-) or were stimulated (+) for 2 min with anti-CD25. Total lysates were analyzed by immunoblot with anti-phosphotyrosine (Anti-p-Tyr), anti-SLP-76 and anti-CD6. Data are representative of at least two independent experiments.
Lat is dispensable for the CD6-SLP-76 association
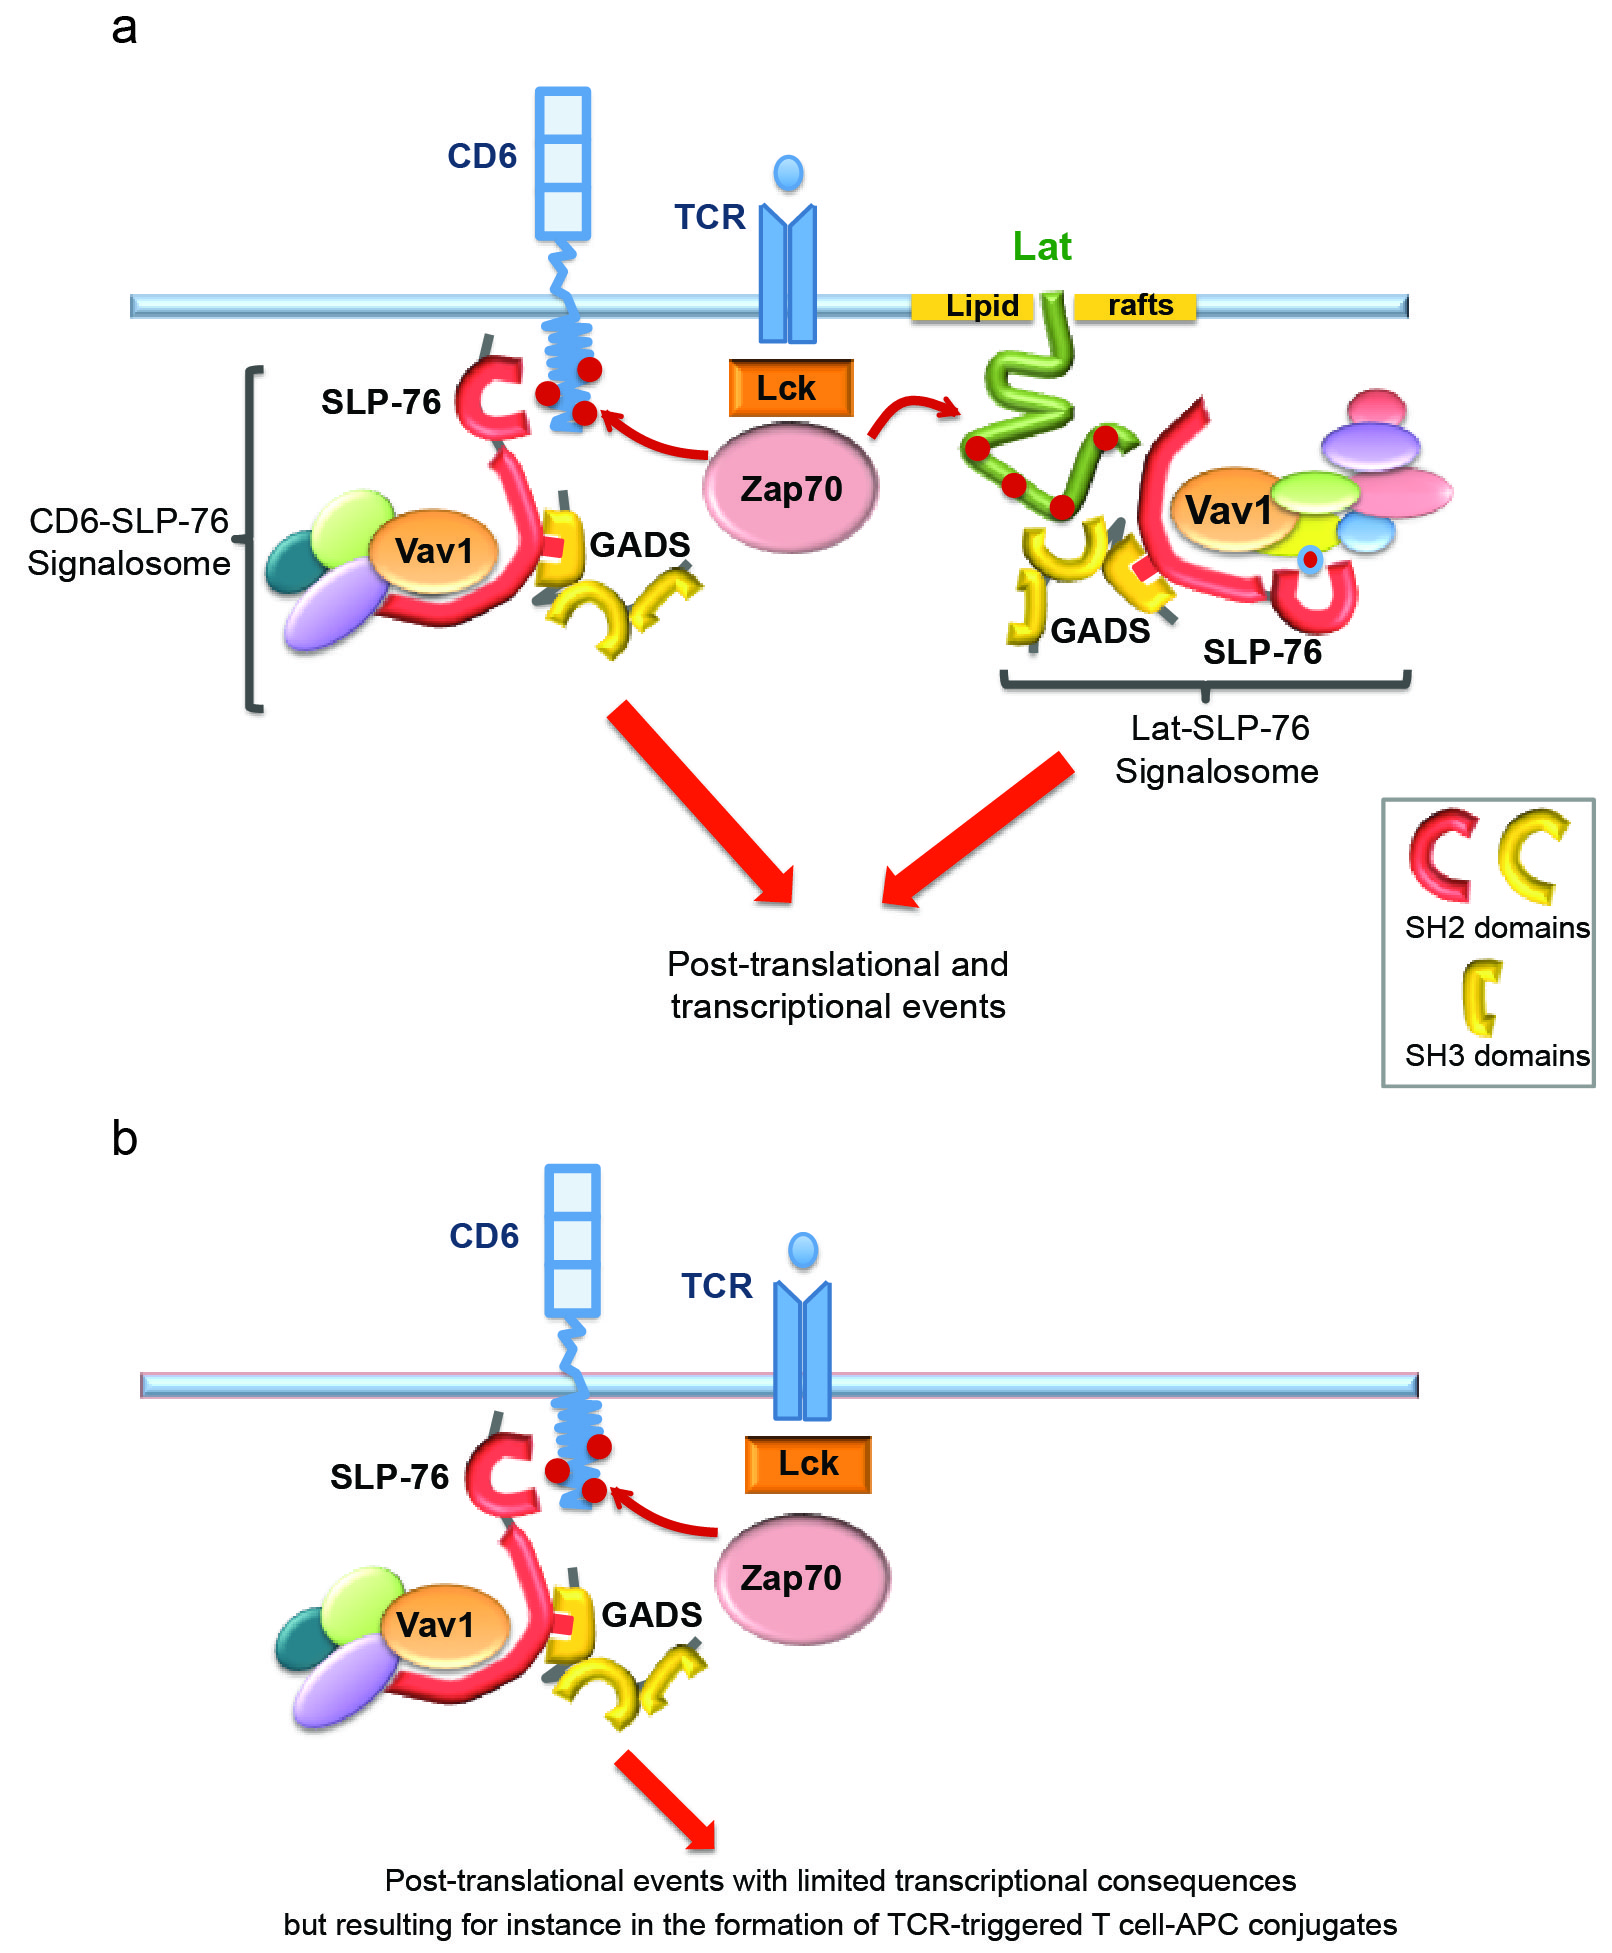
We next investigated whether the TCR-inducible association between CD6 and SLP-76 occurred in the absence of Lat. Comparison of the pattern of CD25ξ-inducible tyrosine-phosphorylated proteins present in E6.1-CD25ξ-CD6 and JCaM2.5-CD25ξ-CD6 cells showed that only a few phosphospecies (including Lat) were absent in Lat-deficient JCaM2.5-CD25ξ–CD6 cells (Fig. 6c), a result reminiscent of data obtained in primary T cells deprived of Lat4,5. Importantly, upon CD25ξ cross-linking, CD6 was still capable of associating with SLP-76 in the absence of Lat (Fig. 6d). To confirm this result in primary CD4+ T cells, we took advantage of a genetic system that permits inducible ablation of Lat in mature CD4+ T cells4. CD4+ T cells were thus made deficient in Lat and stimulated with CD3 and CD4 antibodies. Co-immunoprecipitation experiments performed on cell lysates revealed that, upon TCR stimulation, the CD6 molecules expressed on primary CD4+ T cells had the capacity to recruit SLP-76 in a Lat-independent manner (Fig. 6e). Consistent with that observation, CD6 was absent from the Lat interactome (Fig. 3), and CD6 and Lat did not precipitate together in lysates of wild-type T cells after TCR stimulation (data not shown). Therefore by combining our results and previous studies4,5,23,29,30, it is possible to propose a more complete model of TCR-proximal signaling in which TCR signals proceed via two independent signal nucleation platforms involving the transmembrane Lat adaptor and the CD6 receptor (Supplementary Fig. 7a). To determine whether CD6 is the only pathway for SLP-76 phosphorylation in the absence of Lat, we took advantage of the fact that CD6 was not detectable at the surface of Lat-deficient JCaM2.5-CD25ξ Jurkat T cells (Supplementary Figure 6b). Upon CD25ξ cross-linking, no tyrosine phosphorylated band was found in JCaM2.5-CD25ξ Jurkat T cells at the position expected for SLP-76 (Fig. 6f). In contrast, upon reconstitution of those cells with CD6, a CD25ξ-inducible tyrosine-phosphorylated protein of 76 kDa that likely corresponded to SLP-76 was readily detectable. Therefore, Lat is dispensable for the CD6– SLP-76 association and, in Jurkat T cells, CD6 is likely the only molecule responsible for SLP-76 recruitment and phosphorylation in the absence of Lat.
Limited transcription occurs in the absence of Lat
CD6 is thus at the initiation of an alternate, Lat-independent signaling pathway that involves SLP-76 and Vav1 and that likely contributes to the large numbers of post-translational events that still occur after engagement of the TCR expressed on Lat-deficient CD4+ T cells4–6. The function of CD6 remains controversial and it has been endowed with both stimulatory23,29,30 and inhibitory31 functions. To determine whether some of the transcriptional events that follow TCR engagement32,33 can also be triggered via the CD6–SLP-76 signaling platform in the absence of Lat, we exploited a transgenic mouse model (denoted “maT-Cre” here) in which the pattern of expression of a Cre recombinase permitted us to delete loxP-flanked (“floxed”) genes in post-thymic, mature CD4+ T cells (Online Methods). The maT-Cre transgene was introduced onto mice homozygous for a floxed, wild-type allele of Lat that also contains a human diphtheria toxin receptor (hDTR) cassette placed under the control of an internal ribosome entry site (this allele is called “Latfl-dtr”; ref. 4). Due to the variegated expression of the maT-Cre transgene, only 50% of the peripheral CD4+ T cells deleted their floxed Lat alleles. In non-deleted CD4+ T cells, it is possible to detect hDTR at the cell surface using specific antibodies. Accordingly, Lat+hDTR+ and Lat−hDTR− CD4+ T cells can be distinguished in maT-Cre x Latfl-dtr mice (Fig. 7a), sorted and subjected to transcriptomic analysis prior to or after stimulation for 4 h with anti-CD3 and anti-CD28. Resting Lat+hDTR+ and Lat−hDTR− CD4+ T cells expressed identical amounts of TCR at their surface and underwent the same extent of TCR down-regulation after anti-CD3 and anti-CD28 stimulation, demonstrating that they have been both properly stimulated (Fig. 7b). Gene expression profiles were then generated in 3 independent experiments and the differentially expressed genes were defined using a multiple testing adjusted P-value <0.05 and a log-fold change >1 or <-1. Engaging the TCR and CD28 at the surface of wild-type (Lat+hDTR+) CD4+ T cells resulted in substantial changes in gene expression, in that 1545 and 1381 genes were more than twofold induced or repressed, respectively (Fig. 7c and Supplementary Table 3). In marked contrast, in the absence of Lat, the transcriptional response of Lat−hDTR− CD4+ T cells to anti-CD3 and anti-CD28 was severely blunted and only 35 genes were upregulated. After four days of stimulation through the TCR and CD28, CFSE-labeled, Lat+hDTR+ CD4+ T cells showed extensive divisions whereas CFSE-labeled, Lat−hDTR− CD4+ T cells failed to proliferate, suggesting that the kinetics of T cell activation and proliferation is not protracted in the absence of Lat (data not shown). Therefore, in the absence of Lat, the TCR signals conveyed via the CD6–SLP-76 platform results in limited transcriptional events (Supplementary Fig. 7b).
Figure 7.

Limited transcriptional changes occur when the TCR is engaged in the absence of Lat. (a) Expression of hDTR at the surface of CD4+ T cells of 4 week-old mice of maT-Cre x Latfl-dtr genotype. Percentages of Lat−hDTR− and Lat+hDTR+ CD4+ T cells are shown. (b) Expression of TCRβ on sorted Lat+hDTR+ and Lat−hDTR− CD4+ T cells that were stimulated for 4 h with anti-CD3 and anti-CD28 (anti-CD3 + anti-CD28) or left untreated (NS). Numbers indicate the geometric mean fluorescence. (c) Numbers of genes that were significantly induced (UP) or repressed (DOWN) in Lat+ and Lat− CD4+ T cells after 4 h of stimulation with anti-CD3 and anti-CD28. For more details on the genes that were differentially regulated see also Supplementary Table 3. (d) Jurkat T cells coexpressing CD25ξ and CD6 in the presence (E6.1) or absence (JCaM2.5) of Lat were left unstimulated (-) or stimulated for 2 min with anti-CD6 (+). Total lysates were analyzed by immunoblots with phospho-specific antibodies directed against Erk1/2 pTY202/204. Blotting with anti-Erk1/2 served as a loading control. (e) CD4+ T cells made defective in Lat (LatΔ/Δ) and wild-type CD4+ T cells (Lat+/+) were labeled with PKH26 and incubated with equal number of CTV-labeled B cells for 1 h at 37 °C in the absence (-) or presence of anti-CD3. The percentage of conjugate formed between T and B cells in the presence or absence of anti-ALCAM was determined by flow cytometry analysis. Data in (a), (b), (d) and (e) are representative of at least two independent experiments.
Post-translational modifications induced by CD6 signaling
We next determined the functions that can be elicited by CD6 through post-translational modifications and in the absence of Lat. Cross-linking of CD6 molecules expressed on Jurkat T cells has been shown to trigger the phosphorylation of the Erk serine-threonine kinase34. Comparison of Jurkat T cells expressing CD6 in the presence or absence of Lat showed that CD6-mediated Erk activation occurred irrespective of the presence of Lat (Fig. 7d). Therefore, the CD6 signaling pathway operating in Jurkat cells is capable of inducing Erk phosphorylation in a Lat-independent manner. CD6 also participates in the assembly of the immunological synapse that forms at the interface between T cells and antigen-presenting cells (APCs). Blocking the interaction between CD6 and its ligand, known as activated leukocyte cell adhesion molecule (ALCAM) or CD166, partially blocks the formation of TCR-induced T cell-APC conjugates30. To determine whether CD6 is essential for the formation of TCR-induced T cell-APC conjugates in the absence of Lat, wild-type CD4+ T cells and CD4+ T cells made defective in Lat were incubated with ALCAM+ activated B cells in the absence or presence of anti-CD3. TCR activation increased the numbers of T cell–B cell conjugates irrespective of the presence of Lat (Fig. 7e). In the case of wild-type CD4+ T cells, blocking the CD6-ALCAM interaction with an ALCAM-specific antibody only slightly diminished the number of T cell–B cell conjugates, an observation consistent with a previous report30, and likely due to the predominant role played by the TCR-Lat axis in the attachment of T cells to B cells via integrin activation35. In contrast, in the case of Lat-deficient CD4+ T cells, the increase in T cell–B cell conjugate numbers triggered by TCR engagement was totally blocked by the ALCAM antibody, suggesting that under these conditions CD6 was essential for the TCR-triggered formation of T cell–B cell conjugates and capable of integrating TCR-mediated signals regardless of the absence of Lat. Therefore, despite its limited transcriptional role, the TCR-CD6 signaling axis is capable of playing important role in the formation of T cell–B cell contacts and in Erk activation in a manner parallel and independent of that of the TCR-Lat axis.
New proteins within the Zap70–Lat–SLP-76 network
Twenty five percent of the interacting proteins found here in the Zap70–Lat–SLP-76 network have been published in human or mouse T cells (Supplementary Figs. 5b,8 and Supplementary Table 2). Among the majority of new proteins found in the Zap70–Lat–SLP-76 protein network (Fig. 3 and Supplementary Table 1), some involved molecules that have been shown to participate in the responsiveness of T cells to cytokines (STAT1) or chemokines (DOCK2) and their role within the TCR-proximal signaling cascade remains thus to be determined. Others have never been observed in the context of TCR signaling and involved transcription regulators (TARDBP, Zc3hav1), transporters (ATP1B3, SLC25A12, KPNB1), a putative Ras-GTPase-activating protein (RASAL3A) and molecules involved in protein folding and degradation (Cand1, Ecm29, PSMC4). Intriguingly, TMEM73 (also known as STING), a central adaptor protein for cytosolic DNA sensing36, associated with Lat-OST in a TCR-inducible manner. Altogether, our analysis revealed 65 proteins that have not yet been associated with the Zap70–Lat–SLP-76 network and thus provides important cues for future functional experiments.
DISCUSSION
In this study we combined mouse genetics with quantitative mass spectrometry to investigate the organization of the Zap70–Lat–SLP-76 signaling network following activation of primary CD4+ T cells. We showed that this network consists of 90 proteins and of 112 high confidence interactions, most of which have not been reported. We also determined the temporal organization of the Zap70–Lat–SLP-76 signaling network at 4 time points covering 300 s following T cell activation with pervanadate. Considering that pervanadate is a potent inhibitor of protein tyrosine phosphatases, it remains to be determined whether a more transient dynamics of interaction occurs in response to physiological stimulation via the TCR due to the unabated action of protein tyrosine phosphatases. Along the same line, introducing transgenic TCR on the Zap70OST, LatOST and Slp76OST gene-targeted mice will allow to use triggers of increasing biological complexity and physiological relevance such as antigen-pulsed dendritic cells. Subsequent functional studies on the basis of our proteomics data suggested a model for the Lat-independent membrane recruitment of SLP-76 following TCR activation. According to this model, TCR signals bifurcate at the level of the plasma membrane via the use of two scaffold proteins. The first corresponds to Lat and was identified more than a decade ago, whereas the second, previously unappreciated, signaling scaffold relies on CD6 molecules and functions in a Lat-independent manner. Consistent with this proposed role, CD6 is expressed on the surface of all T cells and functions both for adhesion and as a costimulatory receptor29,30,37. Blocking the interaction between CD6 and its ligand results in diminished proliferation in response to anti-CD3 and anti-CD28 (refs. 23,29,30,37). Interestingly, a spliced isoform of CD6 that lacks the ALCAM-binding domain and fails to be incorporated in the immunological synapse has been associated with susceptibility to multiple sclerosis38,39. Contrasting with the above studies, a recent report suggested that CD6 is primarily involved with a negative regulatory role during T cell activation31.
In the absence of Lat, numerous components of the TCR signaling pathway, including SLP-76, are still phosphorylated after TCR engagement in a manner that is functionally relevant and results, for example, in the activation of the serine-threonine protein kinases Akt and PKC-θ4-6. Our transcriptomic analysis of CD4+ T cells deprived of Lat showed, however, that the numerous post-translational activation events that occur in the absence of Lat have limited transcriptional consequences. However, despite its limited transcriptional role, we showed that in the absence of Lat, CD6 was capable of integrating TCR-mediated signals essential for formation of T cell–APC conjugates. Along the same line, it will interesting to determine whether the existence of a CD6-based signaling axis that is TCR-inducible and Lat-independent explains the paradoxical finding that Lat-deficient cytotoxic T cells are still able to kill target cells via the release of preformed granules6. Therefore, the CD6 signaling pathway appears primarily involved in the regulation of transcription-independent events. In terms of transcriptional activation, Lat remains thus an essential and non-redundant component of the TCR signaling pathway, in that Lat and only Lat has the capacity to trigger most of the transcriptional responses triggered by the TCR.
Natural killer (NK) cell activation can be triggered by multiple activating receptors that associate with ITAM-containing adaptors. Akin to T cells, SLP-76 recruitment to the plasma membrane after ligation of ITAM-bearing receptors was thought to be solely mediated via Lat and its Lat2 homolog. Importantly, Lat2 is not expressed in mouse T cells40 and cannot participate in the Lat-independent recruitment of SLP-76 documented in the present report. Interestingly, a recent study41 demonstrated that ITAM-triggered NK cell functions, including cytokine production, degranulation and proliferation occurred through at least two distinct signaling pathways that both relied on SLP-76. While the canonical pathway utilized Lat and Lat2 for recruiting SLP-76 to the plasma membrane, the alternate Lat-Lat2-independent signaling pathway relied on a plasma membrane molecule the nature of which remained to be defined. Therefore, such an unexpected bifurcation of ITAM-mediated membrane proximal signals occurs both in NK cells and T cells and relies on Lat family-dependent and -independent mechanisms. Considering that CD6 is not expressed in mouse NK cells (http://www.immgen.org/databrowser/index.html), the molecule that triggers the Lat family-independent functions observed in NK cells remains to be determined.
In conclusion, our study illustrates the power of AP-MS studies to retrieve, in an unbiased manner, global information on how proteins involved in TCR signal propagation are organized into functionally interacting complexes. This study provides a solid basis for directing future functional studies on the mechanisms underlying signal processing in activated T cells. We have demonstrated the usefulness of this proteomics data by subsequent functional experiments establishing in both human Jurkat cells and mouse primary CD4+ T cells that CD6 constitutes a signaling scaffold permitting delivery of TCR signals via the Lat-independent recruitment of SLP-76. This is different from the previous model that suggested that the TCR used a single signaling scaffold constituted of Lat molecules. The conditional deletion of CD6 in peripheral T cells will permit evaluation of the relative contribution of the canonical, Lat-dependent pathway and of the CD6-dependent pathway identified in the present study. The initial series of gene-targeted mice we have developed to provide proof-of-concept for AP-MS analyses of endogenous signaling complexes expressed in primary T cells is readily scalable. In future studies, the possibility of subjecting these mice to targeted genetic or pharmacologic manipulation should permit measurement of the impact of a given mutation or a drug on activation of primary T cells at the systemic level with unprecedented resolution.
ONLINE METHODS
Construction of an OST-(Stop)2-loxP-tACE-CRE-PGK-gb2-neor-loxP cassette
A sequence corresponding to the One-STrEP-tag (OST)13 was mutated to remove an internal BspE1 site. An XmaI site and two STOP codons were subsequently added at the 5′ and 3′ ends of the mutated OST sequence, respectively. The modified OST sequence was then abutted to the 5′ end of a loxP-tACE-CRE-PGK-gb2-neor-loxP cassette42 to give rise to a cassette denoted as OST-(Stop)2-loxP-tACE-CRE-PGK-gb2-neor-loxP. It contains a neomycin/kanamycin resistance (neor) gene that can be expressed under the control of a prokaryotic (gb2) or a eukaryotic (Pgk1) promoter and a Cre recombinase that is expressed under the control of the tACE promoter and directs the excision of the loxP-flanked tACE-CRE-PGK-gb2-neor segment of the cassette as it passes through the male germline.
LatOST targeting vector
A 11 kb genomic fragment containing the whole Lat gene was isolated from a BAC clone (clone n° RP23-235A13; http://www.lifesciences.sourcebioscience.) of C57BL/6J origin. Using ET recombination43, a chloramphenicol-resistance gene bracketed by BspE1 and SalI sites was inserted at the 3′ end of the Lat coding sequence found in exon 11. Briefly, a chloramphenicol-resistance gene was amplified by PCR from plasmid pACYC184 using a pair of specific primers: sense 5′-GGAGAAGAGGAAGGGGTGGATGGAGAGGAAGCTCCTGACTATGAGAATCTGCAGGAGCTTAACGGTTCCGGAAACGAAGCGCTAACCGTTTTTAT-3′ and antisense 5′-GCAGGAGGGGGGTCCTGGAGAGAAGGCCCAAGGTGGGGGCGGGGACAGAGACCACTCACTAGGCTTGTCGACAGCGCTGATGTCCGCGGTGCTT-3′. In addition to sequences homologous to the chloramphenicol-resistance gene (underlined), the 5′ PCR primer comprised a sequence that codes for a Gly-Ser-Gly spacer sequence (indicated in bold) and that contained a BspeE1 site, and the 3′ PCR primer contained a SalI site (bold). Both primers also contained sequences flanking the site of integration chosen at the 3′ end of the Lat coding sequence (indicated in italics). The resulting PCR product was digested with DpnI to eliminate residual pACYC184 template and purified. Bacterial cells (strain YZ2000, ref. 43) were electroporated with 0.5 μg of the plasmid containing the 11 kb-long, whole Lat sequence and 0.5 μg of PCR product. Colonies containing a correctly inserted chloramphenicol-resistance gene were selected and the chloramphenicol-resistance gene was excised using BspeE1 and SalI digestion and replaced by a XmaI-SalI fragment corresponding to the OST-(Stop)2loxP-tACE-CRE-PGK-gb2-neor-loxP cassette. Finally, the targeting construct was abutted to a thymidine kinase expression cassette and linearized with FseI.
Slp76OST targeting vector
A 6.2 kb genomic fragment containing exons 19 to 21 of the Slp76 (also known as Lcp2) gene was isolated from a BAC clone (clone n° RP23-216O16A; http://www.lifesciences.sourcebioscience.) of C57BL/6J origin. A OST-(Stop)2loxP-tACE-CRE-PGK-gb2- neor-loxP cassette was introduced at the 3′ end of the Slp76 coding sequence found in exon 21 as described for the LatOST allele. For that purpose, the chloramphenicol-resistance gene was amplified by PCR from plasmid pACYC184 using a pair of specific primers: sense 5′-ATGGAAAGAATCGAGGGTCCAGATACCAGTGCACACTAACACACGCTGCAGGCTGTCTGGGTTCCGGAAACGAAGCGCTAACCGTTTTTT-3′ and antisense 5′-TGCTAAGGTCACGTGATTTCGCCGCAGTGACCACCAAGTCAGAAAGGCTCATTTCTTGGCTAACTTGGTCGACAGCGCTGATGTCCGGCGGTGCTT-3′. See the paragraph corresponding to the LatOST targeting vector for the definition of the specified segments of the primers. Further steps leading to the Slp76OST targeting vector were conducted as in the case of the LatOST targeting vector.
Zap70OST targeting vector
A 5.9 kb genomic fragment containing exons 10 to 13 of the Zap70 gene was isolated from a BAC clone (clone n° RP23-27H6A; http://www.lifesciences.sourcebioscience.) of C57BL/6J origin. A OST-(Stop)2loxP-tACE-CRE-PGK-gb2-neor-loxP cassette was introduced at the 3′ end of the Slp76 coding sequence found in exon 21 as described for the LatOST allele. For that purpose, the chloramphenicol-resistance gene was amplified by PCR from plasmid pACYC184 using a pair of specific primers: sense 5′-GGCCAGCCGGGCCGAGGGACCCCCACAGTGTGAACAGGTGGCCGAGGCTGCATGTGGCGGATCCGGAAACGAAGCGCTAACCGTTTTTAT-3′ and antisense 5′-CAGTCGATAGGGCTCCTGAACACAGGTCATCCTGGACAGAGGGTGTAGGGAGGCTTGGGGCGTCGACAGCGCTGATGTCCGGCGGTGCTT-3′. See the paragraph corresponding to the LatOST targeting vector for the definition of the specified segments of the primers. Further steps leading to the Slp76OST targeting vector were conducted as in the case of the LatOST targeting vector.
Isolation of recombinant embryonic stem (ES) cell clones
Bruce 4 C57BL/6J ES cells44 were electroporated with the LatOST targeting vector and JM8.F6 C57BL/6N ES cells45 were electroporated with the Slp76OST and Zap70OST targeting vectors. After selection in G418 and ganciclovir, ES cell clones were screened for proper homologous recombination by Southern blot or PCR analysis. LatOST allele: When tested on XbaI-digested genomic DNA, the 3′ single-copy probe used to identify proper recombination events hybridized to a 7.8 kb wild-type fragment and to a 5.4 kb recombinant fragment. The occurrence of an appropriate homologous recombination event at the 5′ side was screened by PCR using the following pairs of primers: sense 5′-CCCAGAGGCAAACCCTCTGAAG-3′ and antisense 5′-GCCCACAACAGCACCATTG-3′. Slp76OST allele: When tested on HindIII-digested genomic DNA, the 5′ single-copy probe used to identify proper recombination events hybridized to a 5.3 kb wild-type fragment and to a 6.4 kb recombinant fragment. When tested on BamHI-digested genomic DNA, the 3′ single-copy probe used to identify proper recombination events hybridized to a 18.6 kb wild-type fragment and to a 8.8 kb recombinant fragment. Zap70OST allele: When tested on XbaI-digested genomic DNA, the 5′ single-copy probe used to identify proper recombination events hybridized to a 7.2 kb wild-type fragment and to a 9.6 kb recombinant fragment. When tested on BamHI-digested genomic DNA, the 3′ single-copy probe used to identify proper recombination events hybridized to a 4.1 kb wild-type fragment and to a 6.1 kb recombinant fragment. A neor-specific probe was used to ensure that adventitious non-homologous recombination events had not occurred in the selected clones corresponding to the LatOST, Slp76OST, and Zap70OST alleles.
Production of knock-in mice
Mutant ES cells were injected into FVB blastocysts. Germline transmission led to the self-excision of the loxP-tACE-CRE-PGK-gb2-neor-loxP cassette in male germinal cells. Screening for the deletion of the loxP-tACE-CRE-PGK-gb2-neor-loxP cassette and for the presence of the sequence coding for the OST was performed by PCR using the following pair of primers. Lat OST mice: sense 5′-CCTTGAGTAGAGAGTCTGTAGGC-3′ and antisense 5′-GGGAGGACAGTCATGAAGCC-3′. This pair of primers amplified a 289 bp band in the case of the wild-type allele and a 479 bp band in the case of the LatOST allele. Slp76OST mice: sense 5′-GTCCAGATACCAGTGCACACTA-3′ and antisense 5′-TAAATCATGTGGTATTCAACAA-3′. This pair of primers amplified a 207 bp band in the case of the wild-type allele and a 400 bp band in the case of the Slp76OST allele. Zap70OST mice: sense 5′-CAACGTATGCGGAACTATTACTACA-3′ and antisense 5′-GTGATGTTTACCAATATCCCATCAG-3′. This pair of primers amplified a 210 bp band in the case of the wild-type allele and a 400 bp band in the case of the Zap70 OST allele.
Mice
Wild-type and Zap70OST (B6-Zap70tm5Mal), LatOST (B6-Lattm7Mal), Slp76OST (B6-Lcp2tm2Mal) knock-in mice were maintained in specific pathogen-free conditions and all experiments were done in accordance with institutional commitees and French and European guidelines for animal care. Latfl-dtr (B6;129-Lattm6Mal) mice have been described4,5. The maT-Cre transgenic mice allow the deletion of floxed genes in mature T cells (this paper and S.Y. and T.S., unpublished results). Eight- to twelve-week old mice were used.
Flow cytometry
Stained cells were analyzed using an LSRII system (BD Biosciences). Data were analyzed with a Diva software (BD Biosciences). Cell viability was evaluated using SYTOX Blue (Life Technologies). The following antibodies were used: anti-CD5 (53-7.3), anti-CD4 (RM4-5), anti-CD8α (53-6.7), anti-TCRγ (GL-3), anti-TCRβ (H57-597), all from BD Biosciences; anti-CD25 (PC61.5), and anti-CD19 (6D5) both from BioLegend. A CellTrace CFSE proliferation kit (Molecular Probes) was used.
Calcium-flux measurement
Splenic T cells were loaded with Indo-1 (Molecular Probes) for 30 min at 37 °C and then were stained with PE-Cy7-coupled anti-CD4 (RM4-5) and allophycocyanin-conjugated anti-CD8 (Ly-2) both from BD Biosciences. Baseline fluorescence was recorded with a LSR II (Becton Dickinson) before the addition of a biotinylated anti-CD3 (2C11; BD Biosciences). Crosslinking of the TCR-CD3 complexes was induced by addition of avidin. Calcium fluxes were determined for gated CD4+ and CD8+ cells. As a control, cells were stimulated with ionomycin.
CD4+ T cell isolation and short-term expansion
CD4+ T cells were purified from pooled lymph nodes and spleens with Dynabeads Untouched Mouse CD4+ T cell kits (Life Technologies) with a cell purity of over 95%. Purified CD4+ T cells were briefly expanded with plate-bound anti-CD3 (145-2C11; American Type Culture Collection) and soluble anti-CD28 (37-51; American Type Culture Collection). After 48 h of culture, CD4+ T cells were harvested and grown in the presence of IL-2 (5-10 U/ml) for 48 h prior to stimulation.
CD4+ T cell stimulation and lysis
CD4+ T cells (100 × 106) from Zap70OST, LatOST, Slp76OST and wild-type mice were left unstimulated or stimulated at 37 °C with pervanadate or antibodies. Pervanadate stock solution were made by mixing 7.6 volumes of water with 1.9 volumes of hydrogen peroxide (10 mM final concentration) and with 0.5 volume of sodium orthovanadate (100 μM final concentration), and left for 15 min at 20 °C prior to addition to CD4+ T cells. In the case of stimulation with antibodies, CD4+ T cells were incubated with anti-CD3 (0.2 μg per 106 cells; 145-2C11; American Type Culture Collection) and anti-CD4 (0.2 μg per 106 cells; GK1.5; American Type Culture Collection) on ice, followed by one round of washing at 4 °C and then cross-linkage with a purified Rabbit anti-Rat (0.4 μg per 106 cells; Jackson Immunoresearch) for 2 min at 37 °C. Stimulation was stopped by the addition of a twice concentrated lysis buffer (100 mM Tris, pH 7.5, 270 mM NaCl, 1 mM EDTA, 20% glycerol, 0.2% n-dodecyl-β-maltoside) supplemented with protease and phosphatase inhibitors. After 10 min of incubation on ice, cell lysates were centrifuged at 20, 000 g for 15 min at 4 °C. Postnuclear lysates were used for affinity purification or immunoblot analysis. Anti-Zap70 (2705; Cell Signaling Technology), anti-SLP76 (4958; Cell Signaling Technology), antibody to phosphorylated tyrosine (4G10; Millipore), anti-Lat (06-807; Millipore), anti-GADS (06-983; Millipore) and anti-CD6 (H300; Santa Cruz Biotechnology) were used for immunoblot analysis.
CD6 mediated Erk activation
The CD6 molecules expressed at the surface of E6.1-CD25ξ-CD6 and JCam2.5-CD25ξ-CD6 cells were crosslinked with an anti-CD6 antibody (SPV-L14; Life Sciences; 5 μg/ml). Activation of ERK 1 and 2 was assessed by immunoblots with phospho-specific antibodies directed against ERK1 and 2 pTY202/204 (Cell signaling Technology).
Conjugate assay
Total splenocytes – primarily B cells - from Cd3eΔ5/Δ5 mice46 were incubated for 16 h with 2.5 μg/ml of anti-CD40 (FGK45.5) antibody and then stained with Cell Trace Violet (CTV; Life Technologies). CD4+ T cells made defective in Lat (LatΔ/Δ) and wild-type CD4+ T cells (Lat+/+) were labeled with PKH26 (Sigma-Aldrich) and incubated with equal number of CTV-labeled splenocytes for 1 h at 37 °C in the presence of anti-CD3 (10 μg/ml) and in the presence or absence of anti-ALCAM antibody (10 μg/ml; R&D Systems). After disrupting nonspecific cell aggregates by pipetting twice the cell suspension, cells were fixed with 1.5 % paraformaldehyde, and analyzed by flow cytometry. The percentage of conjugates was defined as the number of double-positive events (CTV+PHK26+) in the upper right quadrant.
Affinity purification of protein complexes
Equal amount of postnuclear lysates were incubated with prewashed Strep-Tactin Sepharose beads (IBA GmbH) for 1.5 h at 4 °C on a rotary wheel. Beads were then washed 5 times with 1 ml of lysis buffer in the absence of detergent and of protease and phosphatase inhibitors. Proteins were eluted from the Strep-Tactin Sepharose beads with 2.5 mM desthiobiotin. To remove the biotin, samples were precipitated with trichloroacetic acid (TCA), washed three times with acetone, air-dried and re-solubilized in 50 μl 8 M urea in 50 mM NH4HCO3 pH 8.8. Cysteine bonds were reduced with 5 mM TCEP for 30 min at 37 °C and alkylated in 10 mM iodoacetamide for 30 min at 20 °C in the dark. Samples were diluted to a final concentration of 1.5 M urea using 270 μl of a 50 mM NH4HCO3 solution and digested with 1 g trypsin (Promega) overnight at 37 °C. The peptides were purified using C18 microspin columns (The Nest Group Inc.) according to manufacturer instructions and resolved in 0.1% formic acid, 1% acetonitrile for mass spectrometry analysis.
Tandem mass spectrometry analysis
LC-MS/MS analysis was performed on a LTQ Orbitrap XL mass spectrometer (Thermo Fisher Scientific). The tryptic peptides were separated by reverse phase chromatography using a Proxeon EASY-nLC II liquid chromatography system (Thermo Fisher Scientific) connected to an RP-HPLC column (75 μm x 10 cm) packed with Magic C18 AQ (3 μm) resin (WICOM International). Peptide elution was achieved using 0.1% formic acid, 98% acetonitrile (Solvent B) as mobile phase, following a linear gradient from 5% to 35% percent over the stationary phase (Solvent A; 0.1% formic acid, 98% acetonitrile) at a flow rate of 300 nl/min. The data acquisition mode was set to obtain one high resolution MS scan in the Orbitrap (60,000 @ 400 m/z) and select 10 most abundant ions for collision-induced fragmentation (CID), omitting unassigned or single charge states. The dynamic exclusion window was set to 30 s and limited to 300 entries. Only MS precursors that exceeded a threshold of 150 ion counts were allowed to trigger MS/MS scans. The ion accumulation time was set to 500 ms (MS) and 250 ms (MS/MS) using a target setting of 106 (MS) and 104 (MS/MS) ions. The resulting MS/MS fragment ion spectra were acquired in the linear trap quadrupole (LTQ). A peptide reference sample containing 200 fmol of human [Glu1]-Fibrinopeptide B (Sigma-Aldrich) was routinely analyzed between every four samples to monitor the performance of the LC-MS/MS system.
Protein identification
Acquired spectra were searched with X!Tandem47 against the canonical mouse proteome reference dataset (http://www.uniprot.org/), including the corresponding reverse decoy sequences for all entries. The search parameters were set to include only fully tryptic peptides (KR/P) containing up to two missed cleavage sites. Carbamidomethyl (+57.021465 amu) on Cys was set as static peptide modification. Oxidation (+ 15.99492 amu) on Met, and phosphorylation (+79.966331 amu) on Ser, Thr, Tyr were set as dynamic peptide modifications. The precursor mass tolerance was set to 25 ppm, the fragment mass error tolerance to 0.5 Da. Obtained peptide spectrum matches were statistically evaluated using PeptideProphet and protein inference by ProteinProphet, both part of the Trans Proteomic Pipeline (TPP, v.4.5.1)48. A minimum protein probability of 0.9 was set to match a false discovery rate (FDR) of <1%. The resulting pep.xml and prot.xml files were used as input for the software tool Abacus to calculate spectral counts and NSAF values49.
Filtering of unspecific binding proteins
Adjusted NSAF values of identified proteins were compared to a set of control purifications from wild-type CD4+ T cells, lacking expression of any OST tagged proteins. The protein abundance was estimated by the average NSAF values for each protein. In order to pass high confidence filtering, interactors had to be enriched five times over the control experiment and observed in at least two out of three replicates.
Label-free quantitative analysis
The obtained high confidence interacting proteins were quantified by the sum of the corresponding precursor ion intensities, using the commercial software tool progenensis (Nonlinear USA Inc.). Abundance values were normalized to the total ion current (TIC). To compare the dynamic changes in the time resolved interactome, each quantified protein was normalized towards its highest value in the time course experiment.
Cell lines and reagents
The Jurkat E6.1 T-cell line and its Zap70- (P116) and Lat-(JCaM2.5) deficient variants were kindly provided by A. Weiss (UCSF, San Francisco, USA). A chimeric cDNA construct coding for the extracellular and transmembrane regions of human CD25 linked to the cytoplasmic region of mouse CD3ξ and termed CD25ξ has been described50. A full-length cDNA corresponding to the largest isoform of human CD6 (CD6-201 Ensembl ENST00000344028) was isolated from Jurkat cells by reverse transcription and cloned into the pEF6 vector (Life Technology). Stable transfectants expressing CD25ξ chimeric constructs and human CD6 molecules were obtained by electroporation of Jurkat cells and sorted based on their level of CD6 or CD25ξ expression. Stimulating antibodies against CD25 (7G7) were from Millipore. Anti-ZAP70 (2705; Cell Signaling Technology), anti-SLP76 (4958; Cell Signaling Technology), anti-LAT (06-807; Millipore), anti-GADS (06-983; Millipore), anti-CD6 (H300; Santa Cruz Biotechnology), and antibodies to phosphorylated tyrosines (4G10; Millipore) were used for immunoblot analysis.
Transcriptional profiling and data analysis
Cells from pooled lymph nodes and spleen of Latfl-dtr mice expressing the Tmat-Cre transgene were subjected to B cell depletion using a mix of RA3-6B2 (anti-B220; American Type Culture Collection) and M5/114 (anti-MHC class II; American Type Culture Collection) antibodies and sheep anti-rat Ig microbeads (Invitrogen). B cell-depleted T cells were left unstimulated or stimulated for 4 h in 6-well culture plates coated with anti-CD3 (2C11; 3 μg/ml; American Type Culture Collection) in the presence soluble anti-CD28 (37-51; 1 μg/ml, American Type Culture Collection). Cells were then labeled with anti-CD4 (RM4-5), anti-CD8 (53-6.7), anti-CD62L (MEL-14); anti-CD69 (H1.2F3; all from BD Biosciences) and anti-human DTR (HB-EGF; R&D systems) and sorted with a Facs ARIAII (Beckton Dickinson). SYTOX Blue was used to discriminate dead cells from living cells. Unstimulated and stimulated CD4+ T cells were sorted into a hDTR+ and a hDTR− fractions with a cell purity of over 95%. RNA was prepared using a RNeasy Plus Mini Kit (Qiagen). Up to 106 cells were sorted, yielding from 250 ng to 1500 ng of RNA the quality of which was verified on a Bioanalyser 2000 Agilent. Samples were then frozen and sent to the Turku Centre for Biotechnology for transcriptional analysis. 100 ng of total RNA from 3 independent experiments was processed, and hybridized on GeneChip® Mouse Gene 1.1 ST 24 plate (Affymetrix). Raw microarray data were normalized using robust multi-array average algorithm51 as implemented in Bioconductor suite. Duplicate and un-annotated probesets were removed using the genefilter package in R (version 1.38.0). In case of duplicates, the probeset with the highest inter quartile range was retained. Present and absent calls for probesets were generated by fitting the chip-wide expression data to a two-component Gaussian distribution function using the standard EM algorithm implemented in mixtools package in R. A probe set was defined to be present if the corresponding data point has a higher likelihood for the Gaussian component with higher mean value52. Differential expression analysis was done using paired, moderated t-test as implemented in limma in R53. A gene is considered to be differentially expressed if its Benjamini-Hochberg adjusted P-value is < 0.05 and log fold change is < -1 or > 1.
Supplementary Material
ACKNOWLEDGMENTS
We thank the members of the SYBILLA consortium, O. Acuto (University of Oxford, Oxford, UK), M. Brown (University of Oxford, Oxford, UK), K. Reginald and A.-M. Schmitt-Verhulst for discussions, E. Caccomo, A.-M. Mura, F. Danjan and M. Richelme and the Finnish Microarray and Sequencing Centre at Turku for technical assistance, and A. Weiss (UCSF, San Francisco, USA) for cell lines. This work was supported by Centre National de la Recherche Scientifique, Institut National de la Santé et de la Recherche Médicale, GIS-IBISA, PHENOMIN, ANR (ADAPT project to M.M. and iSa project to B.M.), the European Communities (SYBILLA project to B.M., M.G., H.L. and R.L. and MASTERSWITCH project to B.M.), the Academy of Finland Centre for Excellence in Molecular Systems Immunology and Physiology Research and the Sigrid Jusélius Foundation (to R.L. and H.L.), the European Union 7th Framework project PROSPECTS and ERC grants Proteomics v3.0 (to R.A.) and Integrate (to B.M.), and fellowship from the China Scholarship Council (Y.L.).
Footnotes
Accession codes The microarray data have been deposited in the Gene Expression (GEO) database (http://www.ncbi.nlm.nih.gov/gds) under accession number GSE49507.
COMPETING FINANCIAL INTERESTS The authors declare no competing financial interests.
References
- 1.Balagopalan L, Coussens NP, Sherman E, Samelson LE, Sommers CL. The LAT story: a tale of cooperativity, coordination, and choreography. Cold Spring Harb. Perspect. Biol. 2010;2:a005512. doi: 10.1101/cshperspect.a005512. [DOI] [PMC free article] [PubMed] [Google Scholar]
- 2.Roncagalli R, Mingueneau M, Gregoire C, Malissen M, Malissen B. LAT signaling pathology: an “autoimmune” condition without T cell self-reactivity. Trends Immunol. 2010;31:253–259. doi: 10.1016/j.it.2010.05.001. [DOI] [PubMed] [Google Scholar]
- 3.Sommers CL, et al. A LAT mutation that inhibits T cell development yet induces lymphoproliferation. Science. 2002;296:2040–2043. doi: 10.1126/science.1069066. [DOI] [PubMed] [Google Scholar]
- 4.Mingueneau M, et al. Loss of the LAT adaptor converts antigen-responsive T cells into pathogenic effectors that function independently of the T cell receptor. Immunity. 2009;31:197–208. doi: 10.1016/j.immuni.2009.05.013. [DOI] [PubMed] [Google Scholar]
- 5.Chuck MI, Zhu M, Shen S, Zhang W. The role of the LAT-PLC-gamma1 interaction in T regulatory cell function. J. Immunol. 2010;184:2476–2486. doi: 10.4049/jimmunol.0902876. [DOI] [PMC free article] [PubMed] [Google Scholar]
- 6.Ou-Yang CW, et al. Role of LAT in the Granule-Mediated Cytotoxicity of CD8 T Cells. Mol. Cell Biol. 2012;32:2674–2684. doi: 10.1128/MCB.00356-12. [DOI] [PMC free article] [PubMed] [Google Scholar]
- 7.Zheng Y, et al. Temporal regulation of EGF signalling networks by the scaffold protein Shc1. Nature. 2013;499:166–171. doi: 10.1038/nature12308. [DOI] [PMC free article] [PubMed] [Google Scholar]
- 8.Glatter T, Wepf A, Aebersold R, Gstaiger M. An integrated workflow for charting the human interaction proteome: insights into the PP2A system. Mol. Syst. Biol. 2009;5:237. doi: 10.1038/msb.2008.75. [DOI] [PMC free article] [PubMed] [Google Scholar]; Inclusive pages or only one page? 237 turned out to be the article number. This article contains 14 pages numbered 1 to 14. The first page of each article of this journal starts by 1.
- 9.Varjosalo M, et al. Interlaboratory reproducibility of large-scale human protein-complex analysis by standardized AP-MS. Nat. Methods. 2013;10:307–314. doi: 10.1038/nmeth.2400. [DOI] [PubMed] [Google Scholar]
- 10.Mayya V, et al. Quantitative phosphoproteomic analysis of T cell receptor signaling reveals system-wide modulation of protein-protein interactions. Sci. Signal. 2009;2:ra46. doi: 10.1126/scisignal.2000007. [DOI] [PubMed] [Google Scholar]
- 11.Mbonye UR, et al. Phosphorylation of CDK9 at Ser175 enhances HIV transcription and is a marker of activated P-TEFb in CD4(+) T lymphocytes. PLoS Pathog. 2013;9:e1003338. doi: 10.1371/journal.ppat.1003338. [DOI] [PMC free article] [PubMed] [Google Scholar]
- 12.Astoul E, Edmunds C, Cantrell DA, Ward SG. PI 3-K and T-cell activation: limitations of T-leukemic cell lines as signaling models. Trends Immunol. 2001;22:490–496. doi: 10.1016/s1471-4906(01)01973-1. [DOI] [PubMed] [Google Scholar]
- 13.Junttila MR, Saarinen S, Schmidt T, Kast J, Westermarck J. Single-step Streptag purification for the isolation and identification of protein complexes from mammalian cells. Proteomics. 2005;5:1199–1203. doi: 10.1002/pmic.200400991. [DOI] [PubMed] [Google Scholar]
- 14.Secrist JP, Burns LA, Karnitz L, Koretzky GA, Abraham RT. Stimulatory effects of the protein tyrosine phosphatase inhibitor, pervanadate, on T-cell activation events. J. Biol. Chem. 1993;268:5886–5893. [PubMed] [Google Scholar]
- 15.Carvalho PC, Hewel J, Barbosa VC, Yates JR., 3rd Identifying differences in protein expression levels by spectral counting and feature selection. Genet. Mol. Res. 2008;7:342–356. doi: 10.4238/vol7-2gmr426. [DOI] [PMC free article] [PubMed] [Google Scholar]
- 16.Harkiolaki M, et al. Structural basis for SH3 domain-mediated high-affinity binding between Mona/Gads and SLP-76. EMBO J. 2003;22:2571–2582. doi: 10.1093/emboj/cdg258. [DOI] [PMC free article] [PubMed] [Google Scholar]
- 17.Di Bartolo V, et al. A novel pathway down-modulating T cell activation involves HPK-1-dependent recruitment of 14-3-3 proteins on SLP-76. J. Exp. Med. 2007;204:681–691. doi: 10.1084/jem.20062066. [DOI] [PMC free article] [PubMed] [Google Scholar]
- 18.Lasserre R, et al. Release of serine/threonine-phosphorylated adaptors from signaling microclusters down-regulates T cell activation. J. Cell Biol. 2011;195:839–853. doi: 10.1083/jcb.201103105. [DOI] [PMC free article] [PubMed] [Google Scholar]
- 19.Evans R, Lellouch AC, Svensson L, McDowall A, Hogg N. The integrin LFA-1 signals through ZAP-70 to regulate expression of high-affinity LFA-1 on T lymphocytes. Blood. 2011;117:3331–3342. doi: 10.1182/blood-2010-06-289140. [DOI] [PubMed] [Google Scholar]
- 20.Salmeron A, et al. Transferrin receptor induces tyrosine phosphorylation in T cells and is physically associated with the TCR zeta-chain. J. Immunol. 1995;154:1675–1683. [PubMed] [Google Scholar]
- 21.Kobarg J, Whitney GS, Palmer D, Aruffo A, Bowen MA. Analysis of the tyrosine phosphorylation and calcium fluxing of human CD6 isoforms with different cytoplasmatic domains. Eur. J. Immunol. 1997;27:2971–2980. doi: 10.1002/eji.1830271133. [DOI] [PubMed] [Google Scholar]
- 22.Wee S, et al. Tyrosine phosphorylation of CD6 by stimulation of CD3: augmentation by the CD4 and CD2 coreceptors. J. Exp. Med. 1993;177:219–223. doi: 10.1084/jem.177.1.219. [DOI] [PMC free article] [PubMed] [Google Scholar]
- 23.Hassan NJ, et al. CD6 regulates T-cell responses through activation-dependent recruitment of the positive regulator SLP-76. Mol. Cell Biol. 2006;26:6727–6738. doi: 10.1128/MCB.00688-06. [DOI] [PMC free article] [PubMed] [Google Scholar]
- 24.Williams BL, et al. Genetic evidence for differential coupling of Syk family kinases to the T-cell receptor: reconstitution studies in a ZAP-70-deficient Jurkat T-cell line. Mol. Cell Biol. 1998;18:1388–1399. doi: 10.1128/mcb.18.3.1388. [DOI] [PMC free article] [PubMed] [Google Scholar]
- 25.Finco TS, Kadlecek T, Zhang W, Samelson LE, Weiss A. LAT is required for TCR-mediated activation of PLCgamma1 and the Ras pathway. Immunity. 1998;9:617–626. doi: 10.1016/s1074-7613(00)80659-7. [DOI] [PubMed] [Google Scholar]
- 26.Letourneur F, Klausner RD. Activation of T cells by a tyrosine kinase activation domain in the cytoplasmic tail of CD3 epsilon. Science. 1992;255:79–82. doi: 10.1126/science.1532456. [DOI] [PubMed] [Google Scholar]
- 27.Wegener AM, et al. The T cell receptor/CD3 complex is composed of at least two autonomous transduction modules. Cell. 1992;68:83–95. doi: 10.1016/0092-8674(92)90208-t. [DOI] [PubMed] [Google Scholar]
- 28.Irving BA, Chan AC, Weiss A. Functional characterization of a signal transducing motif present in the T cell antigen receptor zeta chain. J. Exp. Med. 1993;177:1093–1103. doi: 10.1084/jem.177.4.1093. [DOI] [PMC free article] [PubMed] [Google Scholar]
- 29.Gimferrer I, et al. Relevance of CD6-mediated interactions in T cell activation and proliferation. J. Immunol. 2004;173:2262–2270. doi: 10.4049/jimmunol.173.4.2262. [DOI] [PubMed] [Google Scholar]
- 30.Zimmerman AW, et al. Long-term engagement of CD6 and ALCAM is essential for T-cell proliferation induced by dendritic cells. Blood. 2006;107:3212–3220. doi: 10.1182/blood-2005-09-3881. [DOI] [PubMed] [Google Scholar]
- 31.Oliveira MI, et al. CD6 attenuates early and late signaling events, setting thresholds for T-cell activation. Eur. J. Immunol. 2012;42:195–205. doi: 10.1002/eji.201040528. [DOI] [PMC free article] [PubMed] [Google Scholar]
- 32.Wakamatsu E, Mathis D, Benoist C. Convergent and divergent effects of costimulatory molecules in conventional and regulatory CD4+ T cells. Proc. Natl. Acad. Sci. USA. 2013;110:1023–1028. doi: 10.1073/pnas.1220688110. [DOI] [PMC free article] [PubMed] [Google Scholar]
- 33.Diehn M, et al. Genomic expression programs and the integration of the CD28 costimulatory signal in T cell activation. Proc. Natl. Acad. Sci. USA. 2002;99:11796–11801. doi: 10.1073/pnas.092284399. [DOI] [PMC free article] [PubMed] [Google Scholar]
- 34.Ibanez A, et al. Mitogen-activated protein kinase pathway activation by the CD6 lymphocyte surface receptor. J. Immunol. 2006;177:1152–1159. doi: 10.4049/jimmunol.177.2.1152. [DOI] [PubMed] [Google Scholar]
- 35.Menasche G, et al. RIAM links the ADAP/SKAP-55 signaling module to Rap1, facilitating T-cell-receptor-mediated integrin activation. Mol Cell Biol. 2007;27:4070–4081. doi: 10.1128/MCB.02011-06. [DOI] [PMC free article] [PubMed] [Google Scholar]
- 36.Burdette DL, Vance RE. STING and the innate immune response to nucleic acids in the cytosol. Nat. Immunol. 2013;14:19–26. doi: 10.1038/ni.2491. [DOI] [PubMed] [Google Scholar]
- 37.Hassan NJ, Barclay AN, Brown MH. Frontline: Optimal T cell activation requires the engagement of CD6 and CD166. Eur. J. Immunol. 2004;34:930–940. doi: 10.1002/eji.200424856. [DOI] [PubMed] [Google Scholar]
- 38.De Jager PL, et al. Meta-analysis of genome scans and replication identify CD6, IRF8 and TNFRSF1A as new multiple sclerosis susceptibility loci. Nat Genet. 2009;41:776–782. doi: 10.1038/ng.401. [DOI] [PMC free article] [PubMed] [Google Scholar]
- 39.Kofler DM, Severson CA, Mousissian N, De Jager PL, Hafler DA. The CD6 multiple sclerosis susceptibility allele is associated with alterations in CD4+ T cell proliferation. J. Immunol. 2011;187:3286–3291. doi: 10.4049/jimmunol.1100626. [DOI] [PubMed] [Google Scholar]
- 40.Gregoire C, et al. Deletion of the LIME adaptor protein minimally affects T and B cell development and function. Eur. J. Immunol. 2007;37:3259–3269. doi: 10.1002/eji.200737563. [DOI] [PubMed] [Google Scholar]
- 41.May RM, et al. Murine natural killer immunoreceptors use distinct proximal signaling complexes to direct cell function. Blood. 2013;121:3135–3146. doi: 10.1182/blood-2012-12-474361. [DOI] [PMC free article] [PubMed] [Google Scholar]
- 42.Mingueneau M, et al. The proline-rich sequence of CD3epsilon controls T cell antigen receptor expression on and signaling potency in preselection CD4+CD8+ thymocytes. Nat. Immunol. 2008;9:522–532. doi: 10.1038/ni.1608. [DOI] [PubMed] [Google Scholar]
- 43.Zhang Y, Muyrers JP, Testa G, Stewart AF. DNA cloning by homologous recombination in Escherichia coli. Nat. Biotechnol. 2000;18:1314–1317. doi: 10.1038/82449. [DOI] [PubMed] [Google Scholar]
- 44.Kontgen F, Suss G, Stewart C, Steinmetz M, Bluethmann H. Targeted disruption of the MHC class II Aa gene in C57BL/6 mice. Intl. Immunol. 1993;5:957–964. doi: 10.1093/intimm/5.8.957. [DOI] [PubMed] [Google Scholar]
- 45.Pettitt SJ, et al. Agouti C57BL/6N embryonic stem cells for mouse genetic resources. Nat. Methods. 2009;6:493–495. doi: 10.1038/nmeth.1342. [DOI] [PMC free article] [PubMed] [Google Scholar]
- 46.Malissen M, et al. Altered T cell development in mice with a targeted mutation of the CD3-epsilon gene. EMBO J. 1995;14:4641–4653. doi: 10.1002/j.1460-2075.1995.tb00146.x. [DOI] [PMC free article] [PubMed] [Google Scholar]
- 47.Craig R, Beavis RC. TANDEM: matching proteins with tandem mass spectra. Bioinformatics. 2004;20:1466–1467. doi: 10.1093/bioinformatics/bth092. [DOI] [PubMed] [Google Scholar]
- 48.Deutsch EW, et al. A guided tour of the Trans-Proteomic Pipeline. Proteomics. 2010;10:1150–1159. doi: 10.1002/pmic.200900375. [DOI] [PMC free article] [PubMed] [Google Scholar]
- 49.Fermin D, Basrur V, Yocum AK, Nesvizhskii AI. Abacus: a computational tool for extracting and pre-processing spectral count data for label-free quantitative proteomic analysis. Proteomics. 2011;11:1340–1345. doi: 10.1002/pmic.201000650. [DOI] [PMC free article] [PubMed] [Google Scholar]
- 50.Donnadieu E, et al. Reconstitution of CD3 zeta coupling to calcium mobilization via genetic complementation. J. Biol. Chem. 1994;269:32828–32834. [PubMed] [Google Scholar]
- 51.Irizarry RA, et al. Exploration, normalization, and summaries of high density oligonucleotide array probe level data. Biostatistics. 2003;4:249–264. doi: 10.1093/biostatistics/4.2.249. [DOI] [PubMed] [Google Scholar]
- 52.Lee HJ, et al. Direct transfer of alpha-synuclein from neuron to astroglia causes inflammatory responses in synucleinopathies. J. Biol. Chem. 2010;285:9262–9272. doi: 10.1074/jbc.M109.081125. [DOI] [PMC free article] [PubMed] [Google Scholar]
- 53.Smyth GK. Linear models and empirical bayes methods for assessing differential expression in microarray experiments. Stat. Appl. Genet. Mol. Biol. 2004;3:1–29. doi: 10.2202/1544-6115.1027. [DOI] [PubMed] [Google Scholar]
Associated Data
This section collects any data citations, data availability statements, or supplementary materials included in this article.