

Abstract
Understanding the relationship between network structure and behavior is fundamental to the field of computational and systems biology. A particularly important distinction is the extent to which qualitative aspects of network performance are encoded in network topology as opposed to being determined through quantitative details, such as those of kinetics. Here, we develop a general and rigorous mathematical framework for the analysis of genetic networks and apply it to a family of synthetic gene networks. A key feature of our methodology involves determining network behavior that is insensitive to kinetic parameters such as rate constants and nonlinear functional dependencies of rates on molecular concentrations. Results indicate that behavior observed in some networks cannot be reconciled with standard gene expression and regulation models. We explore relaxing model assumptions to explain the observed behavior, allowing for both dynamicand stochastic phenomena, and propose an alternative model. Our alternative model includes the suggestion of a new mechanism by which the counterintuitive behavior could be achieved; central to the model is the assumption that the Clp protein degradation system, which is responsible for the regulatory proteins used in this study, becomes saturated.
Simulation and understanding of gene and protein networks is central to computational and systems biology. A number of recent contributions have involved predictions about network behavior, either through computational modeling or analytical theory (Somogyi and Sniegoski 1996; McAdams and Arkin 1997; Becskei and Serrano 2000; Endy et al. 2000; van Dassow et al. 2000; Rao and Arkin 2001; Schoeberl et al. 2002; Shvartsman et al. 2002). Whereas models vary greatly in style and scope, virtually all attempts to predict behavior depend upon a (sometimes very large) number of parameters, which are generally adapted from the literature or fitted. Because thorough measurement of biochemical kinetic parameters in vivo is cumbersome and difficult, it is desirable to be able to create robust model predictions using fitted parameters, or in the absence of parameters altogether.
Here, we explore the behavior of a set of genetic circuits constructed and studied by Guet et al. (2002). The network family was generated using the three genes lacI, λ cI, and tetR, which were combinatorially assigned promoters for the three repressors. This allowed for 27 different network topologies when three repressing promoters were used. These systems were then perturbed by adding saturating amounts of two effectors, anhydrotetracycline (aTc) and isopropyl-β-thiogalactopyranoside (IPTG), which inhibit TetR and LacI, respectively. Network output was monitored using green fluorescent protein (GFP) under control of a repressive promoter for cI. The GFP level was measured under four conditions (without effector, with IPTG, with aTc, and with both effectors added). An interesting result of the study was that networks with identical topology, but interchanged regulatory elements, sometimes behaved differently (Guet et al. 2002).
Our goal is to understand the nature of this symmetry-breaking behavior. In our work, no numerical parameter values were assumed or fitted. Rather, mathematical relationships were constructed that permit qualitative predictions of network behavior. We show that parameter differences for the two regulatory elements could not explain behavior differences, at least in the context of models normally used to describe genetic circuitry. Moreover, we suggest an extension to a commonly used model, which could explain the observed behavior.
METHODS
Assumptions and General Model
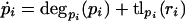
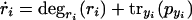
We begin with the following assumptions, which are frequently used for biological network simulation (Arkin et al. 1998; Elowitz and Leibler 2000; Thattai and van Oudenaarden 2001), as follows: (1) there is no spatial dependence of the molecule concentrations or rate constants (i.e., the cell is well stirred); (2) there is no cross-talk between promoters; (3) control of expression is at the transcriptional level only; and (4) the dependence of translation and transcription rates on protein and RNA concentration, respectively, is strictly monotonic. It is a widely accepted abstraction to view translation, transcription, and degradation as composite processes, neglecting the detailed underlying reactions. In this framework, the model components for a given gene and its products consist of two equations, one describing the rate of change of RNA concentration and the other the rate of change for protein. Each equation consists of a degradation term (usually modeled as first-order decay) and a transcription or translation term. On this level, the most general model is,
 |
1 |
 |
2 |
in which pi and ri are protein and RNA concentrations, respectively; degri (ri) is the RNA degradation rate of RNA ri; tryi(pyi) is the transcription rate of RNA ri as a function of the repressor concentration pyi that controls RNA ri expression; degpi (pi) is the protein degradation rate; and tlpi (ri) is the rate of translation of ri into pi. Note that degri (ri) and degpi (pi) will always be negative, as they correspond to the reduction of RNA or protein concentration through degradation. Most of the assumptions are implicit in the notation; we assume further that tr(p) is strictly monotonically decreasing for every repressor p, tl(r) is strictly monotonically increasing, and all degradation rates are strictly monotonically decreasing. The network topology is encoded in the yi. They determine which transcription factor represses which gene (i.e., each pyi is one of the pi).
Simplification of the Equations
Now, we assume steady state and show properties of the relationship between transcription factor concentration and steady-state protein expression,
 |
3 |
 |
4 |
Because we assume the degradation rates are strictly6 monotonic with respect to concentration, we can invert equation 3 and then eliminate ri from equation 4,
 |
5 |
 |
6 |
 |
7 |
Note that  is monotonically decreasing, because with rising pyi, -tryi(pyi) will get larger (smaller in absolute value) and degri-1 is strictly monotonically decreasing. Likewise,
  is strictly monotonically increasing and finally,
  is strictly monotonically decreasing. Because we do not assume any further information about the degradation, translation, or transcription functions aside from their strict monotonicity, we can replace the right-hand side of equation 7 with one function that is strictly monotonically decreasing,
 |
8 |
We can now describe any system of genetic networks built from genes that repress one another with a system of equations similar to equation 8, with the network topology encoded by the labels yi. These equations will define the steady-state behavior of the system, if it is in fact fully defined by this approach. In other words, the steady-state level of any given protein has monotonically decreasing dependence on the concentration of a repressor controlling its expression. This is also an intuitive result, but here it has been determined assuming only strict monotonicity and a simple but commonly applied model. The formalism can be extended to include activators.
Validity of the Steady-State Assumption
For any gene with an autoregulatory loop for which equations 1 and 2 hold for its expression, the jacobian will be,
 |
From monotonicity restrictions
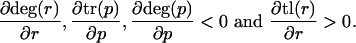 |
For eigenvalues λ1 and λ2,
 |
From restrictions above, λ1 · λ2 > 0.
 |
From here, we get λ1 + λ2 < 0; therefore, λ1,λ2 < 0 for all p,r. This fact makes the steady-state values for r0 and p0 an asymptotically stable point according to the Ljapunov-Poincare theorem (Strogatz 1994). Furthermore, if r0 and p0 define the steady state, for any r1 > r0 and p1 > p0, one can see from equations 1 and 2 that ṙ1 and ṗ1 will be negative (because ṙ0 = ṗ0 = 0), bringing the system to the steady state. The same arguments can be applied to the cases of r1 < r0, p1 > p0 and others, so that from every (r,p) steady state will eventually be reached in this model.
Monte Carlo Simulations
Monte Carlo simulations were carried out using the algorithms developed by Gillespie (1977). The algorithm was implemented in the mathematics programming package MATLAB (The Mathworks). Simulations were run on an AMD Athlon 1200-MP workstation and took less than 20 min to carry out. The full nonlinear system given by equations 1 and 2 was simulated. Initial parameters for the simulations were adapted from Elowitz and Leibler (2000), in which a very similar system was modeled. However, whereas Elowitz and Leibler (2000) modeled both TetR and LacI as dimers and emulated a Hill model by sequential binding of two proteins, we use a Hill model (perfect cooperativity) with Hill coefficients of 2 and 4 for TetR and LacI, respectively. Binding to promoter was modeled with a rate constant of 1 nM-1 sec-1, unbinding from promoter with 9 sec-1, transcription from occupied promoter with 0.0005 sec-1, transcription from unoccupied promoter with 0.5 sec-1, translation with 0.167 mRNA-1 sec-1, protein degradation with a half-life of 10 min, and mRNA degradation with a half-life of 2 min. Our direct reimplementation of the model of Elowitz and Leibler (2000) yielded similar results (data not shown). We sampled parameter space stochastically and ran simulations for 500 different parameter sets. For every new set of parameters, each parameter was allowed to vary over a range of three orders of magnitude. The parameters were randomized by taking 10 to the power of a random number from a uniform distribution from -1.5 to 1.5, and multiplying the result with the parameter value. We carried out each simulation separately, with and without effector addition. Each simulation was run four times to steady state. Simulations for the extended model were carried out using the same methodology, with addition of the binding and degradation reactions of the Clp system.
Extended Model
A possible model extension is the saturability of degradation rates (for example, due to limiting ClpXP concentration). The extended model was represented as,
 |
9 |
 |
10 |
The main difference from the simple model in equations 1 and 2 is that, here, the protein degradation rate also depends on the total protein concentration, which reflects saturation effects. The degradation rate will be monotonically decreasing with rising total protein concentration. Solution of the systems gives,
 |
11 |
at steady state.
RESULTS
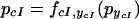
Applying the framework described here to the combinatorially synthesized networks of Guet et al. (2002) produced the following expressions,
 |
12 |
 |
13 |
 |
14 |
 |
15 |
Note, that whereas the functions fiyi can all be different, they share the property that they are monotonically decreasing in their argument. When only considering networks consisting of mutual repressors, there are a total of 27 different topologies possible. To model the behavior observed in the experiments, we predict the change in pcI when adding IPTG, aTc, or both, using the very general framework to model system perturbation. The following equation describes the behavior when the effector that acts on pyi (i.e., aTc for TetR and IPTG for LacI) is added,
 |
16 |
So, we simply replace the function tryi(pyi) with a term tryi(p where peyi is the concentration of active repressor in the presence of effector. Because of the high-effector concentration used in the experiments, here, we treat the effector as inactivating its repressor (peyi ≪ pyi),7 producing the following in place of equation 8,
 |
17 |
From equation 16, f(peyi) > f(pyi) holds; 8 we write,
 |
18 |
and we treat f eiyi as a constant without dependence on pyi.
Analysis of the 27 cases results in nine for which the steady-state network output can be represented as,
 |
19 |
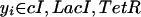
This corresponds to the case in which λ cI represses itself, so addition of either effector is not expected to change the level of cI. The predicted behavior for all networks is shown in Figure 1. Whereas for most networks, our model does make a prediction of the change in GFP level upon effector addition, it cannot predict changes for some cases. In those cases, the monotonicity constraint is not strong enough, and further specification of functional forms and parameters is needed. Although Guet et al. (2002) used two promoters to which LacI binds with different characteristics, no case is shown in which the difference in promoter affected the qualitative behavior of the network. This in agreement with our model, for which results are independent of promoter characteristics.
Figure 1.

Predicted behavior of all 27 synthetic repressor networks, consisting of the genes LacI, TetR, and cI. In the columns titled IPTG, aTc, and IPTC/aTc, GFP level changes are given (predicted here/observed by Guet et al. [2002]) as +, -, 0, or x (unknown).
For two particular networks, we will illustrate the results of our modeling framework. For the network D038 (No. 27 in Fig. 1), equation 20 implicitly defines the steady-state value p0TetR,
 |
20 |
Upon addition of aTc, inactivation through binding of the protein product of TetR causes the following steady-state relation,
 |
21 |
This equation defines another steady state paTcTetR, which can be shown to be always larger than p0TetR.9 Using a similar argument, it follows that paTcLacI > p0aTc < p0cI. Hence, we expect GFP levels to be higher than without effector.
Likewise, addition of IPTG leads to,
 |
22 |
and we expect cI levels to be higher and GFP levels to be lower than without IPTG. Adding both IPTG and aTc, we expect lower GFP levels by similar arguments.
In summary, we expect the GFP levels to be the highest in the case with aTc added, which is in accord with experimental findings (Guet et al. 2002). However, upon IPTG addition, the model predicts a GFP level less than without IPTG, whereas the experiments reported no change. Note that the model does allow for the GFP level change to be very small, and possibly undetected by experiments. Yet, it does rule out a higher GFP level.
However, for a topologically equivalent network, the experimental results cannot be reconciled with the current model. The network D052 is topologically symmetric to D038; the roles of tetR and lacI are switched. Using arguments similar to the ones used for D038, the model predicts analogous behavior. That is, GFP levels should be highest with IPTG added. However, it is found experimentally that they are highest when no effector is added, in clear contradiction with the predictions of the model.
Perfect symmetry of the networks is broken because the promoters used (PLtetO1 and PLlacO1) have different repression thresholds, and LacI is a tetramer, whereas TetR is a dimer (Lutz and Bujard 1997). Therefore, it might be supposed that the difference in parameters and Hill coefficients could lead to the fundamentally different behavior observed. However, our results show that this is not the case within the modeling framework used; for our general model, the two networks are perfectly equivalent and are predicted to behave similarly (network D038 perturbed with aTc should act like D052 perturbed with IPTG and vice versa). The modeling results are independent of parameterization.
DISCUSSION
It is a surprising to find that a model as general as the one used cannot be reconciled with experimental findings. It should be noted here that the model not only allows for any possible combination of parameters, but also any functional dependencies within the monotonicity constraint, and thus encompasses a large volume of model space. The observation that all such models should behave similarly for cases in which a prediction is possible, permits model simplification.
Because topologically equivalent networks don't behave similarly, it is reasonable that one of the assumptions of the model has to be incorrect. The first assumption we challenge is the assumption of steady-state behavior, because it is known that many biological networks do not necessarily reach steady state. However, it is easy to show (see Methods) that at least in all network models of the type applied here and with autoregulatory loops, steady-state will be reached. Whereas we show this independent of parameter values, it is possible to question whether steady state could be reached on the experimental time scale. Several experimental studies have measured the time course of the GFP level in systems very similar to the one used in the experiments modeled here (Elowitz and Leibler 2000; Gardner et al. 2000), where it was found that steady state was reached within several hours. Guet et al. (2002) measured GFP levels after overnight growth, suggesting sufficient time for steady state to be reached.
Assumptions of transcription level control only and no cross-talk are used widely, and there is no strong biological evidence to the contrary here. Although it is easy to imagine cases in which the dependence of transcription or translation rate on protein or RNA concentration, respectively, would not be monotonic, such cases tend to be the result of intentional design.
The dilution effect of growing cell cultures is often neglected. Because cells grow and divide, any given protein concentration, even if neither degradation nor translation take place, will decrease by pure dilution. At stationary phase, the dilution effect can be neglected because cell division and growth is very limited. In general, the dilution effect has a monotonically decreasing dependence on molecule concentration itself, so it can be viewed and treated mathematically as part of the degradation term, and we do not need to treat it separately (Rosenfeld et al. 2002).
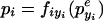
Another possibility is that the existence of noise may affect the results of our study. It has been pointed out (Arkin et al 1998; Thattai and van Oudenaarden 2001; Elowitz et al. 2002), that gene expression is a stochastic process, and the ordinary differential equation model can only be an approximation. To address the question of whether stochastic effects would affect the results, we used an approach based on the Master equation (Thattai and van Oudenaarden 2001). Note that the Master equation is more fundamental than the model in eqs. 1 and 2, which describe the behavior of the population average of quantities described in the master equation. The model shows that at steady state, stochastic effects will induce a deviation, which disappears by averaging large numbers. Experimental data is also given in terms of population averages, hence, stochastic effects are unlikely to be the cause of large differences in this particular case. Furthermore, Monte Carlo simulations based on the method introduced by Gillespie (1977) were carried out for network D052. The full nonlinear system described by equations 1 and 2 was simulated. Parameter space was sampled stochastically for 500 parameter sets. In each of the 500 simulations, the steady-state level of cI without effector was lower than or approximately equal to the level of cI with IPTG. A significant increase in cI concentration, which is implied by the lower observed GFP level, could not be found in 500 simulations. Hence, stochastic effects do not seem to bring our model into agreement with experiments. In Figure 2, we show a histogram of the relative difference in protein number of the simulations run with and without IPTG addition with respect to the standard deviation in the simulation.
Figure 2.

A histogram of the difference between the Monte Carlo simulations of D052 without effector and with IPTG added are shown for the stochastic parameter sampling. The difference in protein number of cI relative to the standard deviation of both simulations is shown.
Having challenged and validated the basic assumptions used in applying the model, we next consider limitations of the model itself. The synthetic network used in the study by Guet et al. (2002) has one property not generally found in genetic circuits—all regulatory proteins carry an ssrA Tag and are thus degraded by special cellular machinery, the Clp system (Keiler et al. 1996). The cellular concentrations of ClpX and ClpP are thought to be fairly low, and it is possible that the system can be saturated. Because three proteins carry an ssrA Tag in the network of Guet et al. (2002), they may compete for binding to limited ClpX. Therefore, the degradation of a given protein may become dependent on the concentrations of the others. In other words, if one particular protein becomes abundant, it could slow the degradation of other proteins by outcompeting them for binding ClpX.
It can be shown that the extended model would allow for the observed behavior through the simple addition of saturation effects. Monte Carlo simulations for this model exhibit the experimentally observed behavior. Intuitively, adding IPTG releases the repression of both LacI and TetR. Both proteins are expressed strongly, reaching high-cellular concentrations and subsequently outcompete cI for degradation. This effect can then lead to an overall increase in cI concentration if the basal transcription rate of the repressed cI promoter is higher than the resulting degradation rate of cI. There are several options to test this model experimentally. The same experimental setup used by Guet et al. (2002) could be reused by removing the ssrA tag to avoid Clp related effects. This approach, however, could lead to problems with reaching steady state, because the removal of the ssrA tags would significantly increase protein lifetimes. Another possibility would be to quantify LacI, TetR, and cI directly using a conventional biochemical technique. Also, it should be possible to overexpress components of the Clp system to overcome the saturation effect. It should be noted that the suggested model extension is only one of many possibilities to resolve the discrepancy.
The work here illustrates a mathematical framework for studying the behavior of gene networks in a parameter-free manner. Whereas agreement with many experimental results has been shown, more interesting are the discrepancies. Our framework illustrates that these discrepancies result from flaws in the underlying model form—a model base commonly used in the field—and not to a particular set of parameters. This suggests either that general improvements are necessary to the models, or a specific remedy is needed for this system. One possibility is that saturation of the Clp protein degradation system is caused by the introduction of synthetic genetic networks with ssrA tags that target proteins for degradation via this pathway. If further support for this hypothesis ensues, it suggests that care must be taken, particularly with synthetic biological networks that interact with protein-degradation machinery. One possible solution is to simultaneously overexpress components of the degradation system.
Acknowledgments
We thank Igor Levchenko and Chris Hayes for useful information on the Clp system, and Bambang S. Adiwijaya, Drew Endy, and Caitlin A. Bever for helpful discussions and suggestions. P.M.K. is a Ph.D. Fellow of the Boehringer Ingelheim Fonds. This work was partially supported by the National Institutes of Health (MH62344).
The publication costs of this article were defrayed in part by payment of page charges. This article must therefore be hereby marked “advertisement” in accordance with 18 USC section 1734 solely to indicate this fact.
Footnotes
Article and publication are at http://www.genome.org/cgi/doi/10.1101/gr.1207003.
We need the strict monotonic property of the degradation rates in order to be able to compute the inverses, degri-1 and degpi-1.
Guet et al. (2002) added aTc at 100 ng ml-1 and IPTG at 1 mM, which is known to be about 10-fold higher than the saturating concentration of each effector (Lutz and Bujard 1997). Note that our treatment becomes somewhat less general by assuming effector saturation.
We can apply simple arguments about monotonicity here. Because we know that tr(pe) > tr(p) and all functions in 17 are monotonic, we can deduce that f(pe) > f(p).
We have seen in eq. 18 that fe = f(pe)>f(p), therefore, also  .
.
References
- Arkin, A., Ross, J., and McAdams, H.H. 1998. Stochastic kinetic analysis of developmental pathway bifurcation in phage λ-infected Escherichia coli cells. Genetics 149: 1633-1648. [DOI] [PMC free article] [PubMed] [Google Scholar]
- Becskei, A. and Serrano, L. 2000. Engineering stability in gene networks by autoregulation. Nature 405: 590-593. [DOI] [PubMed] [Google Scholar]
- Elowitz, M.B. and Leibler, S. 2000. A synthetic oscillatory network of transcriptional regulators. Nature 403: 335-338. [DOI] [PubMed] [Google Scholar]
- Elowitz, M.B., Levine, A.J., Siggia, E.D., and Swain, P.S. 2002. Stochastic gene expression in a single cell. Science 297: 1183-1186. [DOI] [PubMed] [Google Scholar]
- Endy, D., You, L., Yin, J., and Molineux, I.J. 2000. Computation, prediction, and experimental tests of fitness for bacteriophage T7 mutants with permuted genomes. Proc. Natl. Acad. Sci. 97: 5375-5380. [DOI] [PMC free article] [PubMed] [Google Scholar]
- Gardner, T.S., Cantor, C.R., and Collins, J.J. 2000. Construction of a genetic toggle switch in Escherichia coli. Nature 403: 339-342. [DOI] [PubMed] [Google Scholar]
- Gillespie, D.T. 1977. Exact stochastic simulation of coupled chemical reactions. J. Phys. Chem. 81: 2340-2361. [Google Scholar]
- Guet, C.C., Elowitz, M.B., Hsing, W., and Leibler, S. 2002. Combinatorial synthesis of genetic networks. Science 296: 1466-1470. [DOI] [PubMed] [Google Scholar]
- Keiler, K.C., Waller, P.R., and Sauer, R.T. 1996. Role of a peptide tagging system in degradation of proteins synthesized from damaged messenger RNA. Science 271: 990-993. [DOI] [PubMed] [Google Scholar]
- Lutz, R. and Bujard, H. 1997. Independent and tight regulation of transcriptional units in Escherichia coli via the LacR/O, the TetR/O and AraC/l1-l1 regulatory elements. Nucleic Acids Res. 25: 1203-1210. [DOI] [PMC free article] [PubMed] [Google Scholar]
- McAdams, H.H. and Arkin, A. 1997. Stochastic mechanisms in gene expression. Proc. Natl. Acad. Sci. 94: 814-819. [DOI] [PMC free article] [PubMed] [Google Scholar]
- Rao, C.V. and Arkin, A.P. 2001. Control motifs for intracellular regulatory networks. Annu. Rev. Biomed. Eng. 3: 391-419. [DOI] [PubMed] [Google Scholar]
- Rosenfeld, N., Elowitz, M.B., and Alon, U. 2002. Negative autoregulation speeds the response times of transcription networks. J. Mol. Biol. 323: 785-793. [DOI] [PubMed] [Google Scholar]
- Schoeberl, B., Eicher-Johnsson, C., Gilles, E.D., and Mueller, G. 2002. Computational modeling of the dynamics of the map kinase cascade activated by surface and internalized EGF receptors. Nat. Biotechnol. 20: 370-375. [DOI] [PubMed] [Google Scholar]
- Shvartsman, S.Y., Muratov, C.B., and Lauffenburger, D.A. 2002. Modeling and computational analysis of EGF receptor-mediated cell communication in Drosophila oogenesis. Development 128: 2577-2589. [DOI] [PubMed] [Google Scholar]
- Somogyi, R. and Sniegoski, C.A. 1996. Modeling the complexity of genetic networks: Understanding multigenetic and pleitropic regulation. Complexity 1: 45-63. [Google Scholar]
- Strogatz, S. 1994. Nonlinear dynamics and chaos. Addison-Wesley Publishing Company, Reading, MA.
- Thattai, M. and van Oudenaarden, A. 2001. Intrinsic noise in gene regulatory networks. Proc. Natl. Acad. Sci. 98: 8614-8619. [DOI] [PMC free article] [PubMed] [Google Scholar]
- van Dassow, G., Meir, E., Munro, E.M., and Odell, G.M. 2000. The segment polarity network is a robust developmental module. Nature 406: 188-192. [DOI] [PubMed] [Google Scholar]