Abstract
Gene expression profiles are an increasingly common data source that can yield insights into the functions of cells at a system-wide level. The present work considers the limitations in information content of gene expression data for reverse engineering regulatory networks. An in silico genetic regulatory network was constructed for this purpose. Using the in silico network, a formal identifiability analysis was performed that considered the accuracy with which the parameters in the network could be estimated using gene expression data and prior structural knowledge (which transcription factors regulate which genes) as a function of the input perturbation and stochastic gene expression. The analysis yielded experimentally relevant results. It was observed that, in addition to prior structural knowledge, prior knowledge of kinetic parameters, particularly mRNA degradation rate constants, was necessary for the network to be identifiable. Also, with the exception of cases where the noise due to stochastic gene expression was high, complex perturbations were more favorable for identifying the network than simple ones. Although the results may be specific to the network considered, the present study provides a framework for posing similar questions in other systems.
The present work addresses the coordinated regulation of genes in response to environmental inputs. We present a novel in silico model and systems analysis tools useful for this purpose. Mammalian cells are constantly remodeling their transcriptional activity profiles in response to combinations of inputs. Both the data and the tools to understand these coordinated responses have been lacking, as has the means to evaluate whether data or tools are adequate. The emergence of global gene expression data sets has begun to provide an appropriate substrate for these ends. However, the suitability of global gene expression data (in particular the results commonly available by gene expression profiling experiments) for deriving regulation is not certain. There are several issues due to the present state of the art such that the number of observations will always be low and the levels of noise high. In addition, these data quantity and quality issues will interact with the nature of the biological system, such that the ability to infer regulation will depend on the complexity of the system itself. Finally, new global sources of information that may be used in conjunction with gene expression data are emerging, but they must be evaluated to determine which of these are of value for the analysis goals. This present scenario leads to the questions: What system knowledge can be derived from gene expression data alone? How do additional data types influence the knowledge that can be gained? What analysis methods are the best for extracting this knowledge?
Several previous works have recognized the advantages of addressing the above questions in silico. Wessels et al. (2001) explored several approaches for reverse engineering genetic regulatory networks from gene expression data, but they constrained the complexity of their in silico systems by the reverse engineering approaches themselves. The studies of Zak et al. (2001a), Smith et al. (2002, 2003), and Yeung et al. (2002) more closely paralleled the experimental situation in that their reverse engineering techniques differed from the systems used to generate the simulation data. Whereas Smith et al. (2002, 2003) used largely descriptive in silico models, the in silico models of Zak et al. (2001a) and Yeung et al. (2002) were based on simplified biochemical models of transcriptional regulation. Finally, Michaud et al. (2003) developed an online tool that allows users to generate artificial data sets from known networks of arbitrary structure, but like Smith et al. (2002, 2003), the models are of a descriptive nature. In silico models that are mechanistic in nature are preferable, as they more closely resemble true biological systems themselves. The more closely the in silico system resembles true biology, the greater the likelihood that the results will be relevant to experimental systems.
The present analysis considers the a priori identifiability and practical identifiability of a mechanistic regulatory network as a function of input perturbations and noise due to stochastic gene expression, given measurements of gene expression and prior knowledge of the network structure. A priori identifiability is concerned with whether or not, given a particular model of the system and a particular input-output experiment, it is possible to uniquely determine the model parameters in the case of noise-free data (Jacquez and Greif 1985). Practical identifiability is concerned with the accuracy with which the parameters in the model can be estimated given the covariance of the measurements.
We considered input perturbation as an experimental variable because the richness of the perturbation determines the richness of the dynamic character that may be observed (Ljung 1999), and thus influences model identifiability. This is of practical importance to the experimentalist, who must decide how to excite the system of interest in an experiment. In the present study, we restricted our attention to relatively simple perturbations that may be realized with the present state of the art (step, pulse, or double pulse of ligand).
Stochastic gene expression is important given that some components involved in transcriptional regulation are present in very low numbers in individual cells, such as promoters and transcripts (McAdams and Arkin 1999). It is also of practical importance, given that single-cell gene expression profiling is a reality (Hemby et al. 2002), and experimentalists who utilize such techniques will be confronted by stochastic aspects of transcription. For these reasons, the number of cells collected per time point was considered as an experimental variable in the present study. Note that this differs subtly from the number of replicated measurements taken per time point, as it may be feasible to collect millions of cells per time point whereas it is not feasible to collect millions of replicate measurements (in the case of cell culture, for example). When very few cells are collected, as may be the case in a laser-capture microdissection experiments (Simone et al. 1998), the noise due to stochastic gene expression will be significant, whereas the effects will be greatly diminished in studies using millions of cells per time point.
The prior structural knowledge that was assumed in the present study concerns which transcription factors regulate the transcription of which genes, as may be obtained experimentally from genome-wide location analysis or other methods that identify protein-DNA interactions on a genomic scale (Pugh and Gilmour 2001). The structural knowledge also includes knowing what transformations the transcription factors undergo, which may be obtained from the literature (Herdegen and Leah 1998).
The identifiability analyses employed in the present work were developed specifically for deterministic, ordinary differential equation (ODE) models, and thus our attention is presently restricted to ODE systems. The link to the stochastic simulations is made through the practical identifiability analysis, which, in the present work, uses an ensemble of stochastic simulations to estimate the measurement covariance matrix over time. This represents an idealized scenario, where the variability in the measurements only arises from the stochastic nature of gene expression, and differs from the present state of the art where measurement noise is significant. Nevertheless, we feel there is value in exploring what may be possible when measurement noise is sufficiently reduced.
We must point out that in using the stochastic simulations to estimate the measurement covariance matrix, we make the subtle assumption that the noise due to the stochastic effects is essentially additive to an otherwise deterministic time evolution in mRNA levels. We know that this is not the case, since the stochastic noise is inherent to the dynamics of transcription, and this is a limitation in any approach that attempts to construct ODE models of gene expression. Despite this limitation, numerous ODE models of gene expression have been constructed that have provided important insights (Hargrove et al. 1991; Goldbeter 1996; Smolen et al. 1998; Cherry and Adler 2000; De Jong 2002; Isaacs et al. 2003). Additionally, ODE models of gene expression may be more readily integrated with models of signal transduction, which are routinely formulated as ODEs (Kholodenko et al. 1999; Chen et al. 2000). Finally, ODEs are advantageous because of the availability of numerous analysis techniques, such as the identifiability analyses employed in the present work, and analysis tools, such as DASSL/DASPK (Maly and Petzold 1996), and MATLAB (Shampine and Reichelt 1997). For these reasons, we feel that the advantages of ODEs outweigh the shortcomings, and that the implicit assumption in using the stochastic simulations is an acceptable one. We refer the reader interested in the much more difficult problem of analysis of stochastic systems to empirical efforts regarding optimizing parameters in molecular models (Raimondeau et al. 2003), efforts in estimating parameters in stochastic differential equation systems (Nielsen et al. 2000; Fullana and Rossi 2002), and efforts in the sensitivity analysis of stochastic differential equation systems (Dacol and Rabitz 1984).
The present work is a departure from previous efforts in that the analysis of a specific in silico system itself is presented, rather than a novel reverse engineering approach. Given that our study considers only one specific network, it may suffer in comparison to other studies that considered several in silico networks (Wessels et al. 2001; Yeung et al. 2002; Smith et al. 2003). Our network is, however, of greater mechanistic detail than those considered in the previous studies. Additionally, the present study lays the groundwork for both the construction and analysis of other networks.
In the following, we present results from simulating the in silico network in deterministic ODE and novel hybrid stochastic/deterministic frameworks, followed by the identifiability analysis results. Details of the model development, simulation, and identifiability analysis are provided in the Methods section below and in the online Supplemental material available at www.genome.org and http://www.dbi.tju.edu/dbi/publications/icsb2002/.
RESULTS
In Silico Genetic Regulatory Network
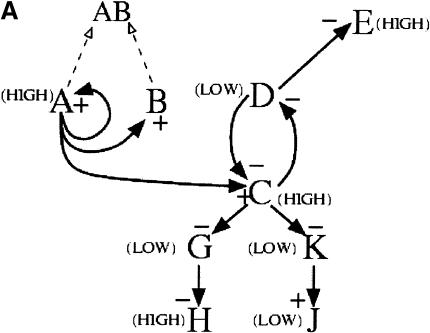
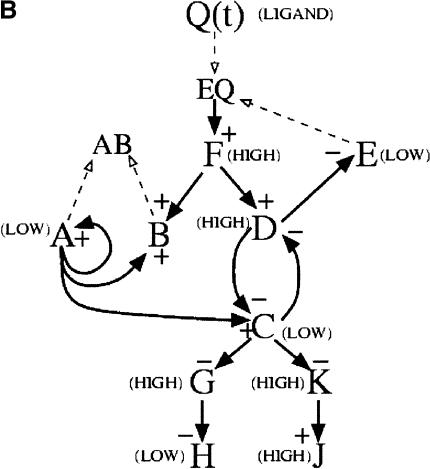
The genetic regulatory network considered in the present study is an extension of a network model reported previously (Zak et al. 2001a), and the presentation in the Methods section is the first full account of the model development. We constructed the in silico network by arranging modules of transcriptional regulation into regulatory motifs consisting of groups of two to four genes interacting through mechanisms drawn from the literature, and then assembling the motifs into a unified network. Four motifs were used in the network, described in Methods. The overall structure was chosen so that, in the absence of ligand input, there are high levels of transcription factors A and C, protein B, receptor E, and downstream gene H(Fig. 1A). When ligand is introduced, the cell shifts into a state where transcription factors A and C and receptor E are present at low levels, and transcription factors D and F and downstream protein J are present at high levels (Fig. 1B). When ligand is removed, the cell returns to the initial state. The model parameters were selected to yield time scales representative of mammalian gene expression (available in the online Supplemental material). Overall, there are relatively few (13) interconnections between transcriptional modules, as is the case in biological networks (Arnone and Davidson 1997; Jeong et al. 2001; Ravasz et al. 2002).
Figure 1.
In silico genetic regulatory network. The network consists of a cascade, a pair of mutually repressive genes, an auto-activation and sequestration motif, and an agonist-induced receptor down-regulation motif. (A) When ligand is absent, genes A, E, C, and H are in a “HIGH” state, indicating maximal levels of their respective transcripts and proteins, whereas genes D, G, K, and J are in a “LOW” state, indicating minimal levels of their respective transcripts and proteins. In this state transcripts and protein for gene F are absent. (B) When ligand is present, genes F, D, G, K, and J are in the HIGH state while genes A, C, E, and H are in a LOW state. Signed solid arrows indicate transcriptional regulatory interactions; dashed arrows indicate protein-protein interactions.
Simulation Results
We used both ODE and stochastic chemical kinetic (Gillespie 1976) approaches to integrate (simulate) the network. The ODE approach allowed us to obtain a general sense of the system behavior with a small computational investment. The stochastic approach was used to address the stochastic nature of transcription. To remedy the high computational cost of stochastic simulations incurred by the standard stochastic simulation method (Gillespie 1976), we developed a hybrid stochastic/deterministic approach that preserved the stochastic nature of gene expression while speeding up the other reactions with deterministic integration. Details of this approach are provided in Methods and in the online Supplemental material.
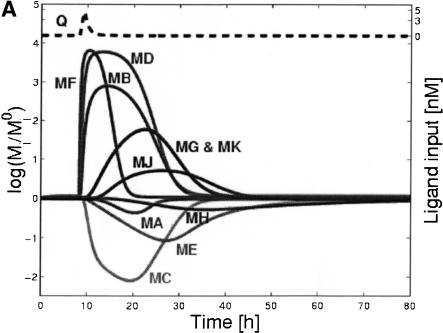
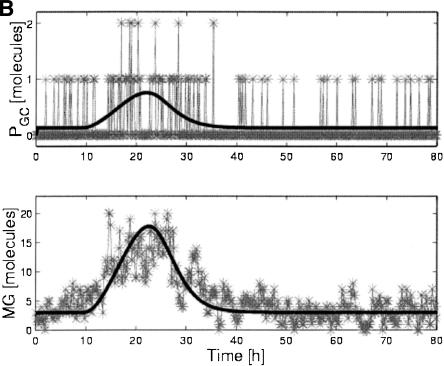
Log-ratios of gene expression levels are shown in Figure 2A for the deterministic response of all genes to a pulse of ligand, where the log-ratio is the natural logarithm of the ratio of expression level at time t, MI(t), to its level at the initial time, MI0. Figure 2B demonstrates stochastic effects on the transcript levels for gene G and on the unrepressed G promoter (PGC), obtained from the hybrid stochastic/deterministic simulation. Note that C is a repressor of G, and hence the pulse, causing a decrease in C, causes an increase in unrepressed G promoter (PGC), and leads to an increase in G transcript.
Figure 2.
Representative time courses from the model. (A) Loge (expression ratios) vs. time for all genes (shaded lines) and ligand (dashed line) from deterministic simulation in response to a pulse of ligand. (B) Comparison of stochastic and deterministic simulations for the unrepressed G promoter (PGC) and the G transcript: PGC and MG vs. time. Note that the stochastic simulation accounts for the fact that there can only be 0, 1, or 2 molecules of PGC/cell at any given time.
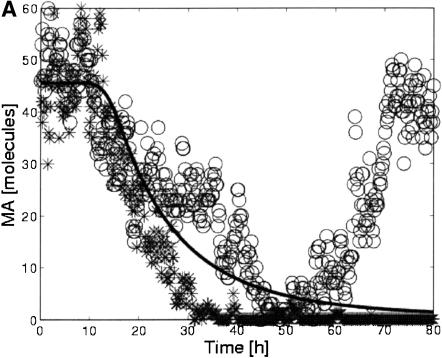
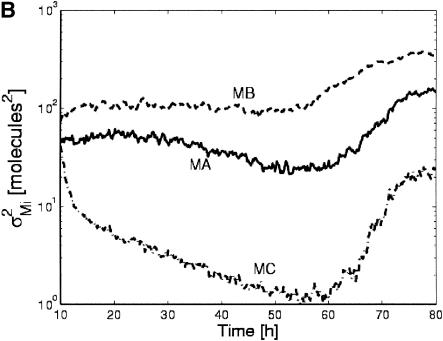
The stochastic simulations yielded unexpected results for the case of an extended step in ligand concentration (Fig. 3). Deterministic simulations predicted that, despite the agonist-induced down-regulation of the receptor, prolonged ligand exposure would lead to prolonged down-regulation of gene A (Fig. 3A). Although this was true for some of the stochastic simulations, it was not true for all. A plot of the variances in the transcript levels over time calculated from 500 hybrid simulations demonstrates this further (Fig. 3B). At longer times, the variance increases due to the increasing number of cells that transiently adapt to the ligand input.
Figure 3.
Influence of stochastic gene expression on system behavior. (A) Deterministic and stochastic time courses for transcript MAduring a step of ligand. The deterministic simulation does not show adaptation (solid line), whereas some (circles) but not all stochastic simulations (stars) do. (B) Variance in transcript levels (σ2Mi) vs. time for MA, MB, and MC. Despite constant ligand input, the variance increases for these transcripts at later times due to the transient adaptation of an increasing fraction of the population.
We confirmed this unexpected behavior by performing simulations with the full Gillespie algorithm. The behavior arises from the integer nature mRNA molecules in a single cell. The transcript for the receptor, ME, at steady state in the presence of ligand will have a concentration of 0.4 molecules/cell in the deterministic simulation. This is sufficient for receptor (E) to be translated, making the EQ complex available to activate transcription of MF and indirectly repress A and C. In the stochastic simulations, 0.4 molecules/cell becomes 0 molecules/cell for the majority of the time, during which receptor is not translated, leading to a significant decrease of receptors/cell compared to the deterministic simulation. In some cases, the receptor level becomes so low that transcription of F is reduced, allowing derepression of A and C. Figures demonstrating this process are provided in the online Supplemental material.
Identifiability Analysis
We considered three experimentally realizable ligand input perturbations in the identifiability analyses: step, single 1-h pulse, and two 1-h pulses, 1 d apart. Pulses may be realized in batch cell culture systems by using combinations of receptor agonists and antagonists with varying affinities. We employed the numerical method of Jacquez and Greif (1985) to evaluate the a priori identifiability of the parameters at the nominal parameter values. The details of these calculations are given in the Methods section, and the results are shown in Table 1. We observed that the input perturbation strongly influenced which parameters were a priori identifiable. For the single step, over half of the parameters could not be identified from the data. For the single-pulse and double-pulse studies, approximately one-third of the parameters were not identifiable. Four of the parameters in the model were insensible for all inputs; that is, they had no effect on the measured outputs (Jacquez and Perry 1990). These parameters were related to the translation and degradation of proteins J and H, which did not feed back into the network. It was observed that a large fraction of the unidentifiable parameters were related to the processes of promoter binding/unbinding and transcription factor dimerization/undimerization. Close analysis indicated that these sets of parameters were almost perfectly correlated, indicating that it is possible to reduce the number of parameters in the model by assuming that the forward and reverse rates of the promoter binding and dimerization reactions were about equal. This is known as the equilibrium assumption (Moore and Pearson 1981), and amounts to reduction of the model. It was also observed that some of the unidentifiable parameters were the mRNA degradation constants. It is becoming increasingly feasible to measure mRNA degradation on a genomic scale (Fan et al. 2002; Wang et al. 2002), and it is therefore a reasonable assumption that this type of data may be acquired experimentally. By combining the model reduction with mRNA degradation data, only 1/4 of the original parameters were unidentifiable for the single-step case, and about 1/9 were unidentifiable for the pulse cases. In practice, the remaining unidentifiable parameters would have to be fixed at best estimate values, or the models would need to be reduced further.
Table 1.
A Priori Unidentifiable Parameters Grouped by Biological Function, for the Three Perturbations
| Biological function (total params.) | Single step | Single pulse | Double pulse |
|---|---|---|---|
| Protein monomer degradation (10) | 8 (6)a | 4 (2)a | 4 (2)a |
| Transcript degradation (10) | 7 | 5 | 5 |
| Translation (10) | 9 (7)a | 5 (3)a | 6 (4)a |
| Unidimerization and dimer deg. (21) | 13 (6)b | 10 (3)b | 11 (4)b |
| Promoter un/binding (20) | 12 (2)b | 13 (3)b | 13 (3)b |
| Transcription (26) | 2 | 0 | 0 |
| Total (97) | 51 (30)c (23)d | 37 (16)c (11)d | 39 (18)c (13)d |
The number of unidentifiable parameters that would remain if the insensible parameters (see text) were removed from the model.
The number of unidentifiable parameters that would remain if the equilibrium approximation was made for the appropriate parameters.
The total remaining unidentifiable parameters if the insensible parameters were removed and the equilibrium assumption was applied where appropriate.
The total remaining unidentifiable parameters if mRNA half-lives were measured in addition to application of the equilibrium assumption and removal of insensible parameters.
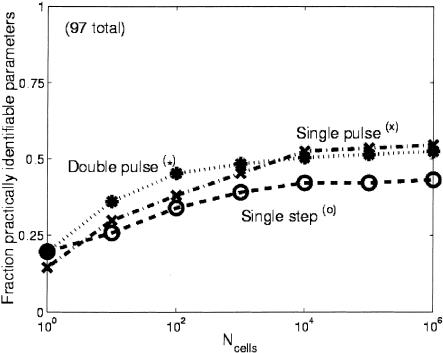
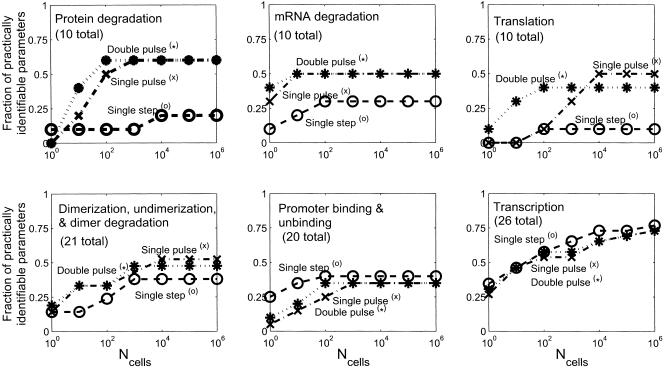
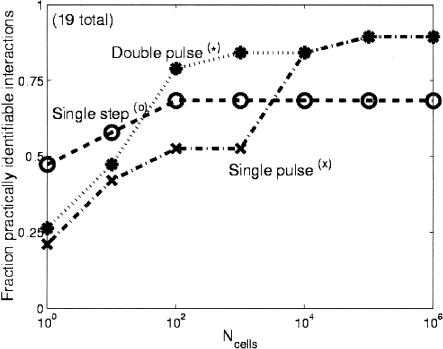
After we determined the set of a priori identifiable parameters, we used the Fisher information matrix to determine which parameters were practically identifiable, following the methods of Landaw and DiStefano III (1984) and Delforge et al. (1990) (details in Methods). The fraction of practically identifiable parameters for the three inputs as a function of the number of cells sampled per time point are shown in Figure 4. For all cases, the double-pulse input had the largest number of practically identifiable parameters. We also considered the influence of the input perturbation on the type of parameters that were practically identifiable. Figure 5 shows a plot for all six classes of parameters for each ligand input as a function of the number of cells sampled per time point. The double-pulse input clearly allows a greater variety of parameters to be identified than either of the other inputs. Interestingly, the single-step input allowed a greater number of parameters related to promoter binding/unbinding to be determined, whereas all three inputs were about equal for determining the transcriptional parameters. Finally, we considered which signs of transcriptional regulatory interactions could be identified with 95% confidence. These signs of regulatory interactions correspond to the differences in the transcription rates for the bound and unbound promoter states. The results are shown in Figure 6 and were strongly dependent on the number of cells that were sampled. The impact of stochastic gene expression was much stronger on the pulse perturbations than the single-step perturbation, and thus at small cell numbers it was possible to identify a greater number of transcriptional interactions with 95% confidence than it was for either of the pulse cases. As the number of sampled cells was increased, however, the pulse perturbations were superior for determining the signs of the interactions.
Figure 4.
Fraction of practically identifiable parameters (see Methods section for definition) vs. the number of cells sampled per time point (Ncells) for the three input perturbations. When only a few cells are sampled per time point, the effect of stochastic gene expression is the greatest, and each perturbation allows about the same number of parameters to be identified with statistical confidence. As more cells are sampled per time point, the noise is reduced and the double-pulse perturbation performs the best. When a very large number of cells are sampled, greatly reducing the impact of stochastic gene expression, the single pulse performs as well as or slightly better than the double pulse. The slight advantage of the single pulse in this limit is due to the slightly greater number of parameters that are a priori identifiable with that perturbation (Table 1).
Figure 5.
Fraction of practically identifiable parameters (see Methods for definition) by biological function vs. the number of cells sampled per time point (Ncells) for the three input perturbations: For protein degradation and translation parameters, the different perturbations perform about equally well when Ncells is small (high noise), with the double pulse being superior at intermediate Ncells, and the double and single pulses performing about equally well at very high Ncells. For mRNA degradation, dimerization, undimerization, dimer degradation, promoter binding, and unbinding, both pulse perturbations perform about equally well. Interestingly, the step perturbation is more effective for identifying promoter binding and unbinding parameters. All three perturbations perform about equally well for the transcriptional parameters. The differing effectiveness for the perturbations for the different classes of parameters may result from their tendency to excite different time scales in the system.
Figure 6.
Fraction of practically identifiable (see Methods for definition) transcriptional interactions (differences between bound and unbound transcriptional parameters) vs. the number of cells sampled per time point (Ncells) for the three input perturbations. At low values of Ncells, corresponding to a large impact of stochastic gene expression, the single-step perturbation actually allows the greatest number of transcriptional regulatory interactions to be determined with 95% confidence. As the number of sampled cells is increased, however, the double-pulse perturbation becomes more effective for determining the regulatory interactions. This result differs from the previous (Figs. 4,5) in that it demonstrates a trade-off between the richness of the perturbation and sensitivity to the effects of stochastic gene expression.
DISCUSSION
Here we evaluated the utility of gene expression data and prior structural knowledge for reverse engineering genetic regulatory networks, considering the impacts of input perturbation and stochastic gene expression. We developed an in silico genetic regulatory network for this purpose, used it to perform deterministic and hybrid stochastic/deterministic simulations, and performed an identifiability analysis of it. We obtained results that are of relevance to the experimental reverse engineering of genetic regulatory networks.
Our approach to constructing the network by assembling modules into motifs, and then motifs into the network fits well with the current literature. With few exceptions (Davidson et al. 2002; Lee et al. 2002; Shen-Orr et al. 2002), most known examples of transcriptional regulation consist of only a few interacting genes (Almagor and Paigen 1988; Reagan et al. 1993; Alberts et al. 1994; Reinitz and Sharp 1995; Meyer and Schmidt 1997; Ouali et al. 1997; Herdegen and Leah 1998; Cherry and Adler 2000; Gardner et al. 2000; Ramakrishnan et al. 2002). There are few alternatives for constructing biologically relevant networks that contain large numbers of genes other than by assembling several known regulatory motifs. Our approach is further supported by recent studies of transcriptional regulatory networks in Escherichia coli (Shen-Orr et al. 2002) and Saccharomyces cerevisiae (Lee et al. 2002) in which the authors demonstrated that these regulatory networks consist of regulatory motifs repeated many times. Although the motifs employed in the present study are generally more complex than the motifs observed in either of those two studies, their observations do support our approach.
Recent experimental results (Elowitz et al. 2002; Ozbudak et al. 2002) have demonstrated that gene expression is a stochastic process for certain systems. For this reason, the stochastic formalism used by many authors (Arkin and McAdams 1998; McAdams and Arkin 1999; Barkai and Leibler 2000; Zak et al. 2001b; Gonze et al. 2002; Vilar et al. 2002) is appropriate for modeling gene expression, although it comes at the cost of increased difficulty of analysis common to molecular models (Raimondeau et al. 2003). The results of the stochastic simulations of the present work, obtained using an efficient hybrid approach, are similar to other studies that made use of stochastic chemical kinetics to observe qualitative behaviors that could not be observed with deterministic simulations (Arkin and McAdams 1998). Due to the fact that transcripts can only exist in integer numbers in individual cells, a fraction of the simulated cells were able to transiently adapt to constant ligand input. This result also demonstrates the limitations of ODE models of gene expression. There is a trade-off between the ease with which ODE systems may be analyzed, and their inability to address the stochastic nature of transcription.
The practical identifiability analysis based on the Fisher information matrix has been applied previously to the yeast cell cycle (Stelling and Gilles 2001) to investigate the robustness properties of the system, as well as the importance of including additional data from perturbed states for estimating model parameters. Identifiability analysis has also been applied in studies of ligand binding (Delforge et al. 1990) and water treatment (Petersen et al. 2001) to investigate how additional perturbations or measurements improve the accuracy of parameter estimates. Our application of identifiability analysis to the reverse engineering of genetic regulatory networks is consistent with these previous studies in that we directly investigated how the complexity of the perturbation influences how well the genetic regulatory network may be reverse engineered. In addition, we considered how stochastic gene expression interacts with the complexity of perturbations in the context of reverse engineering genetic regulatory networks.
In the present study, prior knowledge of the model parameters was required to perform the identifiability analyses. In an experimental situation, the parameter values will not be known a priori, and the identifiability analyses will instead play a role in an iterative process involving experimental design and parameter estimation. The first step in the iteration is the collection of nominal values for the parameters, which may be used to design experiments that render the parameters practically identifiable. If this is not possible, it may be necessary to reduce the number of parameters in the model. The new experiment is carried out, and new parameter values are estimated using the experimental data. The identifiability analyses are then performed to determine whether the parameters were a priori and practically identifiable. If they were not, the experimentalist must design another experiment that will render them identifiable, and complete iterations until a practically identifiable parameter set is obtained.
The results of the present study may be translated into guidelines for the experimentalist who is interested in reverse engineering genetic regulatory networks from gene expression data. Even though we assumed prior structural knowledge of the network, all of the parameters were not a priori identifiable. This implies that without structural knowledge, attempts to identify genetic regulatory networks will meet with limited success. This result is consistent with our previous observations (Zak et al. 2001a). Structural knowledge, as may be obtained from genome-wide protein-DNA binding assays (Pugh and Gilmour 2001), promoter bioinformatics (Tavazoie et al. 1999), and literature information (Herdegen and Leah 1998) is critical to the reverse engineering of genetic regulatory networks. The a priori identifiability analysis also showed that, for any of the input perturbations, a large number of parameters were unidentifiable, even in the case of perfect data. An effort must be made to obtain prior estimates of key parameters, such as mRNA degradation constants (Fan et al. 2002; Wang et al. 2002), and to avoid over-parameterization of the models, by using model reduction approaches such as the equilibrium assumption (Moore and Pearson 1981). Finally, the number of cells that are collected per time point in an experiment will influence the type of perturbation that will be most informative and the amount of prior knowledge that will be necessary for network identification. For situations where only a few cells are collected per time point, as in laser-capture microdissection experiments (Simone et al. 1998), the impact of stochastic gene expression will be significant, and simple perturbations with prior knowledge of many key parameters will be favorable. When hundreds or millions of cells may be collected per time point, the impact of stochastic gene expression will be small and the reverse engineering will be favored by complex input perturbations.
Our study considered how input perturbations and stochastic gene expression influence the identifiability of a specific regulatory network given gene expression profiles and prior structural knowledge. This work may be expanded by including additional sources of variability, such as measurement noise, by including additional data types that may be available, such as functional protein levels, and by varying network structure (Smith et al. 2003). Additionally, the effort may be coupled with specific reverse engineering techniques, as the performance of different methods may vary from system to system. The present study lays the groundwork for these future efforts, and we invite other investigators to use our model for this purpose and to participate in the further development of these concepts.
METHODS
In Silico Genetic Regulatory Network
In our modular approach to network construction, modules of transcriptional regulation were arranged into regulatory motifs consisting of groups of two to four genes interacting through mechanisms drawn from the literature. The overall network was then constructed by assembling the motifs into a network.
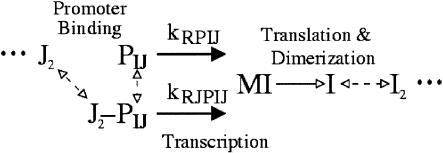
The structure of the transcriptional regulatory module, based on that used by Barkai and Leibler (2000), is shown in Figure 7. We extended the original module to allow homodimerization-dependent activation of transcription factors and binding of multiple transcription factors to promoters.
Figure 7.
Transcriptional regulatory module. Transcription factor dimer J2 bind to the promoter, PIJ of gene I, influencing the rate of MI transcription. MI is translated into protein I, which dimerizes and then binds to other promoters. Solid arrows indicate irreversible reactions (transcription and translation), dashed arrows indicate reversible promoter binding reactions.
The regulatory motifs used in the network were as follows:
Cascade: The cascade is a unidirectional flow of activating or repressing interactions. Cascades in transcriptional regulation are well established in development. In Drosophila, for example, it is known that the gap genes regulate eve expression, but eve does not regulate the gap genes (Reinitz and Sharp 1995). Genes C, G, H, J, and K were arranged in a cascade in the present network.
Mutual repression: The mutual repression motif is a pair of mutually repressive genes or switch. Mutual repression motifs have been observed in prokaryotes (λ-phage, Alberts et al. 1994) and eukaryotes (Reinitz and Sharp 1995), synthesized artificially (Gardner et al. 2000), and studied mathematically (Cherry and Adler 2000). Genes C and D are mutually repressive in the present network.
Auto-activation and sequestration: The auto-activation and sequestration motif is based on the observation that the dimerization partners of transcription factors determine how they regulate the transcription of target genes (Alberts et al. 1994). An example of auto-activation and sequestration is given by c-jun and Fra-2, where c-jun activates of transcription of c-jun and Fra-2 as a homodimer (or with c-fos) but not when it is sequestered as a heterodimer with Fra-2 (Herdegen and Leah 1998). Genes A and B interact via this motif in the present network.
Agonist-induced receptor down-regulation: In the agonist-induced receptor down-regulation motif, a ligand forms a complex with its receptor, which then diffuses into the nucleus. Once inside the nucleus the complex binds to and activates the expression of specific genes, which ultimately lead to the down-regulation of the receptor itself. This mechanism, in which receptor binding ultimately leads to receptor down-regulation, is well documented in mammalian systems (Meyer and Schmidt 1997; Ouali et al. 1997). Genes E, F, and D make up the agonist-induced receptor down-regulation motif in the present network.
Parameters
The total system consists of 118 reactions with 44 species and 97 parameters. The parameters include protein monomer degradation (10 parameters), transcript degradation (10 parameters), translation (10 parameters), dimerization/undimerization/dimer degradation (21 parameters), promoter binding/unbinding (20 parameters), and transcription (26 parameters).
Assignment of mean values to all of the genes would be unrealistic, because variations greater than 100-fold for transcription rates, mRNA turnover, and protein turnover are known to exist in mammalian systems (Hargrove 1994). Our approach was to assign the rate constants based on literature values for genes and proteins with roles similar to those in the model network.
Genes A, B, C, D, F, G, and K encode for transcription factors and were therefore assigned rate constants based on the transcription factors c-jun and Fra-2 in the mammalian nervous system (Herdegen and Leah 1998). Gene E encodes a receptor and was therefore assigned kinetics of a G-protein coupled receptor (AT1 in bovine adrenocortical cells [BACs], Ouali et al. 1997). Genes Hand J are downstream genes and were given the kinetics of metabolic enzymes (H, alanine aminotransferase [AAT]; J, tyrosine aminotransferase [TAT]) with rate parameters derived from studies using rat liver (Kenney and Lee 1982). Not all of the required parameters could be assigned values based on the literature, and further approximations were necessary. A description of the steps taken in deriving the parameter values can be downloaded from the Supplemental information Web site.
The model definition in the Systems Biology Markup Language format (SBML, http://www.sbw-sbml.org/), a table containing all of the parameter values, and a description of the steps taken in deriving the parameter values can be downloaded from the Supplemental information Web site.
Simulating the Network
Deterministic Approach
For deterministic simulations, the transcriptional regulatory module was cast as a set of ODEs, given below for hypothetical gene I. All rate constants are indicated by k and were taken as constants in the simulations. Values of the various ks for specific genes can be found in the online Supplemental information.
Binding and unbinding of transcription factors (TFs; e.g., J2) to promoters (PIJ) to form TF-promoter complexes were described by:
 |
1 |
Translation was modeled as a first-order process with rate constant kTI. Dimerization and undimerization for the formation of active transcription factor (I2) followed simple mass action kinetics. Dimer concentrations are also affected by all of the promoter binding (ΣPB) and unbinding reactions (ΣPU) in which they participate. The ODEs used for proteins and dimers were:
 |
2 |
In the present model, the overall transcription rate was a linear sum of the transcription rates for the bound (kRJPIJ) and unbound (kRPIJ) promoter states, giving an ODE for the I transcript (MI) as follows:
 |
3 |
In the case of promoters where more than one transcription factor can bind, the ODE was:
 |
4 |
where kRN is the transcription rate associated with promoter state PIN. For the case where two TFs bind to the promoter, there will be four transcriptional rates (no TFs bound, TF-A bound, TF-B bound, and both TF-A and TF-B bound).
The MATLAB (The Mathworks) function ode15s (Shampine and Reichelt 1997) was used to carry out the numerical integration in the present study.
Hybrid Stochastic/Deterministic Approach
In our hybrid approach, a stochastic integrator (Gillespie 1976) was coupled with a deterministic integrator (implicit Euler; Heath 1997). The stochastic integrator was used for the components present in small numbers (promoters and transcripts), and the deterministic integrator was used for components present in large numbers (proteins, transcription factor dimers), thereby breaking the transcriptional module into stochastic and deterministic subsystems (Fig. 8). We also assumed that promoter binding and unbinding reactions did not significantly influence the concentration of transcription factor dimers (J2). This assumption removes the ΣPB and ΣPU terms from Equation 2, and had a small effect on the results. We observed a speedup greater than 500-fold over the full stochastic simulation when this approach was implemented on the genetic regulatory network model. It is difficult to quantify precisely the error introduced by the hybrid stochastic/deterministic approximation, but there are indications that it is small for this system. For the Barkai and Leibler (2000) circadian rhythm model, it was observed that noise characteristics for the hybrid simulation matched those of the full stochastic simulation very closely, indicating that little error was introduced. The hybrid stochastic/deterministic simulation algorithm is described further in the online Supplemental material).
Figure 8.
Stochastic and deterministic subsystems in the transcriptional module. The stochastic subsystem consists of those states typically present in small numbers, such as promoters (PIJ, J2PIJ, PKI, I2PKI) and transcripts (MI). The deterministic subsystem consists of those components typically present in larger numbers, such as proteins (I) and dimers (J2, I2).
Identifiability Analysis
The numerical method for checking a priori identifiability, based on that given by Jacquez and Greif (1985), was as follows.
The system is expressed as a set of Nx differential equations with Nx states (x) and Np parameters (p):
 |
5 |
The set of Ny measured states (y) was selected from x with the Ny by Nx matrix C:
 |
6 |
The Nx by Np sensitivity matrix S was calculated (Khalil 1992):
 |
7 |
where:
 |
8 |
The Ny by Np sensitivity matrix Sy of the measured states was then calculated:
 |
9 |
Finally the correlation matrix of the parameters (Mc) was calculated:
 |
10 |
where:
 |
11 |
Parameters that are locally identifiable have correlations with all others parameters between -1 and 1. Parameters that are not locally identifiable, termed a priori unidentifiable in the present work, have correlations of exactly +1 or -1 with at least one other parameter. These parameters influence the measured variables in exactly the same or exactly the opposite manner. The original parameter set, p can be reduced to the identifiable parameter set, pI, of length NI, by calculating Mc, removing one unidentifiable parameter, recalculating Mc, removing another unidentifiable parameter, etc., until no more unidentifiable parameters remain.
Given the set of identifiable parameters, the covariance of the measurements over time, and assuming that the measurements have Gaussian distributions, it is possible to estimate lower bounds on the variances of the parameter estimates through use of the Fisher information matrix (FIM; Landaw and DiStefano III 1984). The Gaussian assumption for the measurements does not hold under all conditions for gene expression. When transcript levels are not close to zero, the Gaussian assumption is acceptable. When transcript levels are near zero, however, the distribution is distinctly non-Gaussian, because the transcript levels cannot take negative values. Representative results for the system are given in the online Supplemental information. Despite this, we used FIM-1 to estimate the variances of the parameter estimates, to obtain a first-order estimate of the parameter estimation accuracies. FIM was calculated from:
 |
12 |
where SI is the Ny by NI sensitivity matrix of the measured states to the identifiable parameters, and W is the covariance of the measurements. The covariance was estimated by using an ensemble of 500 hybrid stochastic/deterministic simulation runs. For the case where only one cell was sampled per time point, the covariance in the mRNA measurements was directly calculated from the 500 hybrid runs. For the case where 10 cells were sampled from each time point, the covariance in the measurements was obtained from the averages of 10 runs, sampled randomly from the pool of 500 runs, 500 times. From these covariances, it was possible to extrapolate the effect that sampling more cells had on the covariance in the mRNA levels.
From FIM the lower bounds on the variances of the parameter estimates were obtained (Landaw and DiStefano III 1984; Petersen et al. 2001) by:
 |
13 |
From the variances of the parameter estimates, confidence intervals for the parameter values were calculated. In the limit of a large number of measurements, the 95% confidence interval for the parameters is: [p0 - 1.96σp, p0 + 1.96σp] (Delforge et al. 1990), where p0 is the nominal value of the parameter, and σp is the standard deviation of its estimate. Practically unidentifiable parameters were defined as those for which it was not possible to determine with 95% confidence that their values were non-zero.
Variances in quantities derived from the parameters, such as the difference between two parameters, were obtained from the relation (Landaw and DiStefano III 1984):
 |
14 |
where g(p) is the quantity to be estimated and FIM-1 has been substituted for the covariance matrix of the parameters.
It must be noted that estimation of σpi2 requires inversion of FIM, and thus problems arise when FIM is singular. A singular FIM indicates the presence of unidentifiable parameters, and correlations between parameters that are greater than 0.99 may lead to singular FIM (Landaw and DiStefano III 1984). For this reason, the procedure for obtaining a subset of identifiable parameters was modified so that parameters are removed until some measure of the singularity of FIM is above a threshold. In the present study, the LAPACK reciprocal condition estimator in MATLAB (The MathWorks), rcond was used to determine whether FIM was singular. If rcond(FIM) < 10ε, where ε is the floating point relative accuracy (2.2 * 10-16), FIM was taken to be singular.
Acknowledgments
We thank Rishi Khan, Dr. Rajanikanth Vadigepalli, Dr. Jan Hoek, Dr. Boris Kholodenko, and Dr. Ronald Pearson for discussions concerning model development and the reverse engineering of genetic regulatory networks; Dr. Joerg Stelling for discussions regarding sensitivity and identifiability analyses, and the DARPA BioComp Initiative under DE-AC03-76SF00098 (F.J.D., PI) and F30602-01-2-0578 (J.S., PI), NIH/NHLBI (R01 HL54194-05), NIH/NIAAA IRPG (R01 AA-13204-01), and NIH/NIGMS (P20 H64459). D.E.Z. also acknowledges NIH training grant NIAAA5T32AA07463-15 and the University of Delaware Department of Chemical Engineering for funding. F.J.D. additionally acknowledges the Alexander van Humboldt Foundation for funding.
The publication costs of this article were defrayed in part by payment of page charges. This article must therefore be hereby marked “advertisement” in accordance with 18 USC section 1734 solely to indicate this fact.
Footnotes
[Supplemental material is available online at www.genome.org. An appendix with the complete model description and detailed descriptions of some of the methods used are also available online at http://www.dbi.tju.edu/dbi/publications/icsb2002/].
Article and publication are at http://www.genome.org/cgi/doi/10.1101/gr.1198103.
References
- Alberts, B., Bray, D., Lewis, J., Raff, M., Roberts, K., and Watson, J.D. 1994. Mol. Biol. Cell, pp. 413-426. Garland Publishing, New York.8054685
- Almagor, H. and Paigen, K. 1988. Chemical kinetics of induced gene expression: Activation of transcription by noncooperative binding of multiple regulatory molecules. Biochemistry 27: 2904-2102. [DOI] [PubMed] [Google Scholar]
- Arkin, A. and McAdams, H.H. 1998. Stochastic kinetic analysis of developmental pathway bifurcation in phage λ-infected Escherichia coli cells. Genetics 149: 1633-1648. [DOI] [PMC free article] [PubMed] [Google Scholar]
- Arnone, M.I. and Davidson, E.H. 1997. The hardwiring of development: Organization and function of genomic regulatory systems. Development 124: 1851-1864. [DOI] [PubMed] [Google Scholar]
- Barkai, N. and Leibler, S. 2000. Circadian clocks limited by noise. Nature 403: 267-268. [DOI] [PubMed] [Google Scholar]
- Chen, K.C., Csikasz-Nagy, A., Gyorffy, B., Val, J., Novak, B., and Tyson, J.J. 2000. Kinetic analysis of a molecular model of the budding yeast cell cycle. Mol. Biol. Cell 11: 369-391. [DOI] [PMC free article] [PubMed] [Google Scholar]
- Cherry, J.L. and Adler, F.R. 2000. How to make a biological switch. J. Theor. Biol. 203: 117-133. [DOI] [PubMed] [Google Scholar]
- Dacol, D.K. and Rabitz, H. 1984. Sensitivity analysis of stochastic kinetic models. J. Math. Phys. 25: 2716-2727. [Google Scholar]
- Davidson, E.H., Rast, J.P., Oliveri, P., Ransick, A., Calestani, C., Yuh, C.H., Minokawa, T., Amore, G., Hinman, V., Arenas-Mena, C., et al. 2002. A genomic regulatory network for development. Science 295: 1669-1678. [DOI] [PubMed] [Google Scholar]
- De Jong, H. 2002. Modeling and simulation of genetic regulatory systems: A literature review. J. Comput. Biol. 9: 67-103. [DOI] [PubMed] [Google Scholar]
- Delforge, J., Syrota, A., and Mazoyer, B.M. 1990. Identifiability analysis and parameter identification of an in vivo ligand-receptor model from PET data. IEEE Trans. Biomed. Eng. 37: 653-661. [DOI] [PubMed] [Google Scholar]
- Elowitz, M.B., Levine, A.J., Siggia, E.D., and Swain, P.S. 2002. Stochastic gene expression in a single cell. Science 297: 1183-1186. [DOI] [PubMed] [Google Scholar]
- Fan, J., Yang, X., Wang, W., Wood, W.H., Becker, K.G., and Gorospe, M. 2002. Global analysis of stress-regulated mRNA turnover by using cDNA arrays. Proc. Natl. Acad. Sci. 99: 10611-10616. [DOI] [PMC free article] [PubMed] [Google Scholar]
- Fullana, J.M. and Rossi, M. 2002. Identification methods for nonlinear stochastic systems. Phys. Rev. E. 65: 1-10. [DOI] [PubMed] [Google Scholar]
- Gardner, T.S., Cantor, C.R., and Collins, J.J. 2000. Construction of a genetic toggle switch in Escherichia coli. Nature 403: 339-342. [DOI] [PubMed] [Google Scholar]
- Gillespie, D.T. 1976. A general method for numerically simulating the stochastic time evolution of coupled chemical reactions. J. Comput. Phys. 22: 403-434. [Google Scholar]
- Goldbeter, A. 1996. Biochemical oscillations and cellular rhythms: The molecular bases of periodic and chaotic behaviour, 2nd ed., pp. 14-15. Cambridge University Press, Cambridge, UK.
- Gonze, D., Halloy, J., and Goldbeter, A. 2002. Robustness of circadian rhythms with respect to molecular noise. Proc. Natl. Acad. Sci. 99: 673-678. [DOI] [PMC free article] [PubMed] [Google Scholar]
- Hargrove, J.L. 1994. Kinetic modeling of gene expression, pp 24-28. R.G. Landes, Austin, TX.
- Hargrove, J.L., Hulsey, M.G., and Beale, E.G. 1991. The kinetics of mammalian gene expression. BioEssays 13: 667-674. [DOI] [PubMed] [Google Scholar]
- Heath, M.T. 1997. Scientific computing, pp. 280-281. McGraw Hill, New York.
- Hemby, S.E., Ginsberg, S.D., Brunk, B., Arnold, S.E., Trojanowski, J.Q., and Eberwine, J.H. 2002. Gene expression profile for schizophrenia. Arch. Gen. Psychiat. 59: 631-640. [DOI] [PubMed] [Google Scholar]
- Herdegen, T. and Leah, J.D. 1998. Inducible and constitutive transcription factors in the mammalian nervous system: Control of gene expression by Jun, Fos, and Krox, and CREB/ATF proteins. Brain. Res. Rev. 28: 370-490. [DOI] [PubMed] [Google Scholar]
- Isaacs, F.J., Hasty, J., Cantor, C.R., and Collins, J.J. 2003. Prediction and measurement of an autoregulatory genetic module. Proc. Natl. Acad. Sci. 100: 7714-7719. [DOI] [PMC free article] [PubMed] [Google Scholar]
- Jacquez, J.A. and Greif, P. 1985. Numerical parameter identifiability and estimability: Integrating identifiability, estimability, and optimal sampling design. Math. Biosci. 77: 201-227. [Google Scholar]
- Jacquez, J.A. and Perry, T. 1990. Parameter estimation: Local identifiability of parameters, Am. J. Physiol. 258: 727-736. [DOI] [PubMed] [Google Scholar]
- Jeong, H., Mason, S.P., Barabasi, A.L., and Oltvai, Z.N. 2001. Lethality and centrality in protein networks. Nature 411: 41-42. [DOI] [PubMed] [Google Scholar]
- Kenney, F.T. and Lee, K.L. 1982. Turnover of gene products in the control of gene expression. Bioscience 32: 181-184. [Google Scholar]
- Khalil, H.K. 1992. Nonlinear systems, pp. 87-89. Macmillan, New York.
- Kholodenko, B.N., Demin, O.V., Moehren, G., and Hoek, J.B. 1999. Quantification of short term signaling by the epidermal growth factor receptor. J. Biol. Chem. 274: 30169-30181. [DOI] [PubMed] [Google Scholar]
- Landaw, E.M. and DiStefano III, J.J. 1984. Multiexponential, multicompartmental, and noncompartmental modeling. II. Data analysis and statistical considerations. Am. J. Physiol. 246: 665-677. [DOI] [PubMed] [Google Scholar]
- Lee, T.I., Rinaldi, N.J., Robert, F., Odom, D.T., Bar-Joseph, Z., Gerber, G.K., Hannett, N.M., Harbison, C.T., Thompson, C.M., and Simon, I., et al. 2002. Transcriptional regulatory networks in Saccharomyces cerevisiae. Science 298: 799-804. [DOI] [PubMed] [Google Scholar]
- Ljung, L. 1999. System identification: Theory for the user, p. 409. Prentice Hall PTR, Upper Saddle River, NJ.
- Maly, T. and Petzold, L.R. 1996. Numerical methods and software for sensitivity analysis of differential-algebraic systems. Appl. Numer. Math. 20: 57-79. [Google Scholar]
- McAdams, H.H. and Arkin, A. 1999. It's a noisy business: Genetic regulation at the nanomolar scale. Trends Genet. 15: 65-69. [DOI] [PubMed] [Google Scholar]
- Meyer, A.S. and Schmidt, T.J. 1997. Differential effects of agonist and antagonists on autoregulation of glucocorticoid receptors in a rat colonic adenocarcinoma cell line. J. Steroid Biochem. 62: 97-105. [DOI] [PubMed] [Google Scholar]
- Michaud, D.J., Marsh, A.G., and Dhurjati, P.S. 2003. eXPatGen: Generating dynamic expression patterns for the systematic evaluation of analytical methods. Bioinformatics 19: 1140-1146. [DOI] [PubMed] [Google Scholar]
- Moore, J.W. and Pearson, R.G. 1981. Kinetics and mechanism, pp. 313-317. John Wiley, New York.
- Nielsen, J.N., Madsen, H., and Young, P.C. 2000. Parameter estimation in stochastic differential equations: An overview. Annu. Rev. Control 24: 83-94. [Google Scholar]
- Ouali, R., Berthelon, M.C., Begeot, M., and Saez, J.M. 1997. Angiotensin II receptor subtypes AT1 and AT2 are downregulated by Angiotensin II through AT1 receptor by different mechanisms. Endocrinology 138: 725-733. [DOI] [PubMed] [Google Scholar]
- Ozbudak, E.M., Thattai, M., Kurtser, I., Grossman, A.D., and van Oudenaarden, A. 2002. Regulation of noise in the expression of a single gene. Nat. Genet. 31: 69-73. [DOI] [PubMed] [Google Scholar]
- Petersen, B., Gernaey, G., and Vanrolleghem, P.A. 2001. Practical identifiability of model parameters by combined respirometric-titrimetric measurements. Water Sci. Technol. 43: 347-355. [PubMed] [Google Scholar]
- Pugh, B.F. and Gilmour, D.S. 2001. Genome-wide analysis of protein-DNA interactions in living cells. Genome Biol. 2: 1-3. [DOI] [PMC free article] [PubMed] [Google Scholar]
- Raimondeau, S., Aghalayam, P., Mhadeshwar, A.B., and Vlachos, D.G. 2003. Parameter optimization of molecular models: Application to surface kinetics. Ind. Eng. Chem. Res. 42: 1174-1183. [Google Scholar]
- Ramakrishnan, R., Dubois, D.C., Almon, R.R., Pyszczynski, N.A., and Jusko, W.J. 2002. Fifth-generation model for corticosteroid pharmacodynamics: Application to steady-state receptor down-regulation and enzyme induction patterns during seven-day continuous infusion of methylprednisolone in rats. J. Pharmacokinet. Pharmacodyn. 29: 1-24. [DOI] [PMC free article] [PubMed] [Google Scholar]
- Ravasz, E., Somera, A.L., Mongru, D.A., Oltvai, Z.N., and Barabasi, A.L. 2002. Hierarchical organization of modularity in metabolic networks. Science 297: 1551-1555. [DOI] [PubMed] [Google Scholar]
- Reagan, L.P., Ye, X., Maretzki, C.H., and Fluharty, S.J. 1993. Down-regulation of Angiotensin II receptor subtypes and desensitization of cyclic GMP production in neuroblastoma N1E-115 cells. J. Neurochem. 60: 24-31. [DOI] [PubMed] [Google Scholar]
- Reinitz, J. and Sharp, D.H. 1995. Mechanism of eve stripe formation. Mech. Dev. 49: 133-158. [DOI] [PubMed] [Google Scholar]
- Shampine, L.F. and Reichelt, M.W. 1997. The MATLAB ODE suite. SIAM J. Sci. Comput. 18: 1-22. [Google Scholar]
- Shen-Orr, S.S., Milo, R., Mangan, S., and Alon, U. 2002. Network motifs in the transcriptional regulation network of Escherichia coli. Nat. Genet. 31: 64-68. [DOI] [PubMed] [Google Scholar]
- Simone, N.L., Bonner, R.F., Gillespie, J.W., Emmert-Buck, M.R., and Liotta, L.A. 1998. Laser-capture microdissection: Opening the microscopic frontier to molecular analysis. Trends Genet. 14: 272-276. [DOI] [PubMed] [Google Scholar]
- Smith, V.A., Jarvis, E.D., and Hartemink, A.J. 2002. Evaluating functional network inference using simulations of complex biological systems. Bioinformatics 18: 216-224. [DOI] [PubMed] [Google Scholar]
- Smith, V.A., Jarvis, E.D., and Hartemink, A.J. 2003. Influence of network topology and data collection on network inference. Proc. Pac. Symp. Biocomput. 8: 164-175. [PubMed] [Google Scholar]
- Smolen, P., Baxter, D.A., and Byrne, J.H. 1998. Frequency selectivity, multistability, and oscillations emerge from models of genetic regulatory systems. Am. J. Physiol. 274: 531-542. [DOI] [PubMed] [Google Scholar]
- Stelling, J. and Gilles, E.D. 2001. Robustness vs. identifiability of regulatory modules? Proc. 2nd Intl. Conf. Systems Biology 181-190.
- Tavazoie, S., Hughes, J.D., Campbell, M.J., Cho, R.J., and Church, G.M. 1999. Systematic determination of genetic network architecture. Nat. Genet. 22: 281-285. [DOI] [PubMed] [Google Scholar]
- Vilar, J.M., Kueh, H.Y., Barkai, N., and Leibler, S. 2002. Mechanisms of noise-resistance in genetic oscillators. Proc. Natl. Acad. Sci. 30: 5988-5992. [DOI] [PMC free article] [PubMed] [Google Scholar]
- Wang, Y., Liu, C.L., Storey, J.D., Tibshirani, R.J., Herschlag, D., and Brown, P.O. 2002. Precision and functional specificity in mRNA decay. Proc. Natl. Acad. Sci. 99: 5860-5865. [DOI] [PMC free article] [PubMed] [Google Scholar]
- Wessels, L.F., Someren, E.P.V., and Reinders, M.J. 2001. A comparison of genetic network models. Proc. Pac. Symp. Biocomput. 6: 508-519. [PubMed] [Google Scholar]
- Yeung, M.K., Tegner, J., and Collins, J.J. 2002. Reverse engineering gene networks using singular value decomposition and robust regression. Proc. Natl. Acad. Sci. 99: 6163-6168. [DOI] [PMC free article] [PubMed] [Google Scholar]
- Zak, D.E., Doyle, F.J., Gonye, G.E., and Schwaber, J.S. 2001a. Simulation studies for the identification of genetic networks from cDNA array and regulatory activity data. Proc. 2nd Intl. Conf. Systems Biology 231-238.
- Zak, D.E., Doyle, F.J., Vlachos, D.G., and Schwaber, J.S. 2001b. Stochastic kinetic analysis of transcriptional feedback models for circadian rhythms. Proc. 40th IEEE Conf. Decision & Control 849-854.
WEB SITE REFERENCES
- http://www.dbi.tju.edu/dbi/publications/icsb2002/; Supplementary information Web site.
- http://www.sbw-sbml.org/; Systems Biology Markup Language (SBML) Web site.


