

Abstract
Objective:
Clinicians caring for children rely on measures of linear growth as a biomarker of development and overall health. Current reference ranges for height velocity (HV) for US children are unable to provide HV percentiles or Z-scores for early maturing and late maturing children at ages other than age at peak velocity. We present empirically acquired, age-specific reference ranges for HV from a contemporary sample of US youth.
Study Design:
Subjects were enrolled in the Bone Mineral Density in Childhood Study, a large, multicenter, multiethnic, contemporary cohort of children (aged 5–19 y at enrollment) from the United States followed for up to 7 years. More than 4000 annual (12 ± 1 mo) HV measurements from approximately 1500 children were available. Pubertal status was determined by breast stage or testicular volume assessed by experienced health providers. Age-specific reference ranges were determined using the LMS method.
Results:
Reference ranges (third to 97th percentiles) were generated for the entire cohort and for subgroups whose pubertal timing was defined as “earlier,” “average,” or “later.” African American girls experienced earlier pubertal onset and had greater HV at younger ages and lower HV at older ages, compared to non-African American girls; differences did not persist after adjustment for pubertal timing. These differences were not observed for males.
Conclusions:
These reference ranges for annual HV can be used to assess growth relative to peers of the same age and sex, with consideration of pubertal timing. Z-scores and exact percentiles for HV can also be determined for population studies.
Linear growth velocity provides one of the most important biomarkers of a child's health status and varies according to a variety of inherent and environmental factors including age, sex, genetics (1), pubertal development, nutrition, and psychosocial status. Acceleration or deceleration of growth may result from systemic disease, poor nutrition, chronic illness, or endocrine dysfunction. Children who experience normal variants of pubertal maturation may come to medical attention due to their deviation from established height percentiles during early adolescence; this pattern is typical of children with pubertal delay who are plotted on cross-sectional growth charts. Height velocity (HV) curves provide the clinician with an additional tool to distinguish between normal and abnormal variants of growth and pubertal maturation and may be used in the research setting to test the effect of an intervention on HV.
The Tanner-Davies HV curves in use in the United States today (2) are based upon curves introduced by Tanner and Whitehouse in 1976 (3), which were a refinement of curves published in 1966 (4, 5). Although the Tanner-Whitehouse height distance curves were based on large numbers of children, their longitudinally derived HV curves were based upon two cohorts of children: 1) from the London City Council Study: a limited number of British children who were randomly selected from London and who contributed data through the age of 11–12 years (actual numbers undisclosed but as few as 19 and no more than 220); and 2) from the Harpenden Growth Study: a second restricted cohort of 49 males and 41 females who were living in a children's home outside of London and who provided data beyond age 11 years (3–6). To develop the curves, age at peak HV was determined for each child. Children were then categorized as early, average, or later maturers based upon the timing of peak HV available from the Harpenden Growth Study cohort described above and from the published literature (7). Curves depicting the third percentile through the 97th percentile HVs were then generated for “average maturers” by centering peak HV on the published average age at peak HV. The third, 50th, and 97th percentiles at peak HV were then highlighted for early and later maturers.
The Tanner-Davies HV curves (2) were developed for the US population in the 1980s by superimposing the Tanner-Whitehouse longitudinal British data on the cross-sectional National Center for Health Statistics (NCHS) height charts (8). The NCHS population included a nationally representative group of children ages 2–18 years recruited for three separate NCHS surveys between 1963 and 1974. Age at peak HV for average, early, and late maturing children was based upon modeling of the cross-sectional NCHS data (2, 8). For males, average age at peak HV was assumed to be 13.5 ± 1.8 years; early and late maturers were defined by attainment of peak HV before 11.7 years and after 15.3 years, respectively. For females, average age at peak HV was assumed to be 11.5 ± 1.8 years; early and late maturers were defined by attainment of peak HV before 9.7 years and after 13.3 years, respectively. Again, only the third and 97th percentiles at age of peak HV are provided for earlier and later maturers (2).
The use of the Tanner-Davies curves has several limitations. Although early and late maturing peak HV-centered curves are typically used in the clinical setting for children whose pubertal onset falls beyond the spectrum of the physiological norm, the actual timing of peak HV is often only recognized in retrospect (if accurate height data are available). Additionally, although other HV reference ranges have been published (9, 10), no HV reference curves are currently available that are based on a diverse population of US children who have undergone physical examinations at set intervals for the assessment of height and sexual maturation. The trend toward earlier age at entry of puberty affects the timing of peak HV (11–14), and thus, previous curves may not be applicable for contemporary children. Moreover, newer statistical approaches such as the LMS method quantitatively depict age-related distributions of HV (15–17) and can be used to calculate exact percentiles and Z-scores. Here, we present empirically acquired age-based reference ranges for annual HV using measurements from a contemporary sample of US children that is well-characterized, geographically and ethnically diverse, healthy, and sufficiently large to capture the normal variability in height. Additionally, we developed separate reference ranges based upon age at onset of puberty (earlier, average, later).
Subjects and Methods
The National Institute of Child Health and Human Development Bone Mineral Density in Childhood Study (BMDCS) was a multicenter longitudinal study to develop pediatric reference ranges primarily for bone mineral density. The study sample included 2014 participants (1022 females) of different ethnic groups in the United States.
Detailed inclusion/exclusion criteria and study procedures have been published previously (16). Briefly, healthy subjects aged 5–19 years, excluding subjects with precocious or delayed puberty, were recruited. Precocious puberty was defined as breast development beginning before age 8 years for girls and testicular size ≥ 4 cc before age 9 years for boys. Delayed puberty was defined as breast development beginning after 13 years for girls and testicular size ≥ 4 cc occurring after age 14 years for boys. Additional exclusion criteria included height, weight, or body mass index (BMI; kg/m2) less than the third percentile or more than the 97th percentile; a current or previous medical condition known to affect growth, maturation, physical activity, or nutritional status; and medications known to affect growth, maturation, or bone mineral accrual. Children were not excluded from the study once enrolled if they subsequently developed precocious puberty, delayed puberty, or height, weight, or BMI below the third percentile or above the 97th percentile.
Participants were classified as “African American” or “non-African American” based on parental report of their child's ancestry. Hispanics and Asians were included in the non-African American group. Participants were evaluated annually for up to 7 years.
The Institutional Review Board at each clinical center approved the protocol. For subjects age < 18 years, consent was obtained from each participant's parent or guardian and assent was obtained from study participants. Consent was obtained directly from the participant for subjects age 18 years and older.
Weight was measured on a digital scale in light clothing. Standing height was measured in triplicate using a wall-mounted stadiometer and recorded to the nearest 0.1 cm. Participants were measured without shoes in the same vertical plane as the stadiometer, with arms relaxed at their sides and faces positioned with the outer canthus and upper ear aligned horizontally. Z-scores for height, weight, and BMI were calculated using the Centers for Disease Control and Prevention 2000 growth charts (18).
HV was calculated as the difference in height, divided by the difference in age between consecutive annual study visits. Midage was calculated at the midpoint between the ages at these consecutive annual study visits, and the annualized HV was assigned to that midage. Annualized HV was included in the analysis if the interval between consecutive visits was ≥ 11 months and ≤ 13 months. HVs that had negative values due to measurement error or erroneous data entry were inspected. To prevent an upward bias in the distribution of HV values, only HV values < −1 cm/y or extreme outliers were excluded.
Sexual maturation was determined by physical examination performed by a physician or nurse practitioner with established expertise in pediatric endocrinology. Stages of breast development using palpation (females) were evaluated based upon the criteria of Tanner (19), and testicular volume (males) was measured by orchidometer (20).
Presented here are annualized HV data for the cohort of males until midage 18.5 years and females until midage 17.5 years because growth is nearly complete or complete at these ages. Separate annualized HV reference ranges were then generated for earlier and later maturing children. These were identified among the subset of participants whose puberty began during the course of the study or for whom the first physical signs of puberty were present at enrollment as follows.
For females, Tanner stage (TS) 2 breast development was used to define pubertal onset. If a female had TS2 breast at enrollment, the age at enrollment was used to define the start of puberty. If a female had TS1 breast at enrollment and TS2 breast at a subsequent visit, the age at that subsequent visit was used to define the start of puberty. If a female progressed from TS1 (prepubertal) to TS3 breast between two annual visits, the midinterval age was imputed to indicate age at TS2 breast.
For males, testicular size of 4 cc was used to define pubertal onset. If a male had a testicular volume of 4 cc at enrollment, the age at enrollment was used to define the start of puberty. If a male had testicular size < 4 cc, he was considered prepubertal at enrollment. If he developed 4 cc testes at a subsequent visit, the age at that subsequent visit was used to define the start of puberty. If a male progressed from prepubertal testes (≤3 cc) to a testicular volume of 5 cc between two annual visits, the midinterval age was imputed to indicate age at start of puberty.
The median and the 25th and 75th percentiles for age at pubertal onset were calculated for each sex (see Supplemental Table 1, published on the Endocrine Society's Journals Online web site at http://jcem.endojournals.org). Subjects for whom pubertal onset data were available were classified as having “earlier” pubertal timing if age of onset of puberty was < 25th percentile, “average” if pubertal onset occurred at an age between the 25th and 75th percentiles, and “later” if pubertal onset occurred at an age > 75th percentile. Females with TS3, -4, or -5 breast development at an age < 25th percentile for TS2 breast were considered to have earlier onset puberty. Females with TS1 breast development at an age > 75th percentile for TS2 breast development were categorized as having later onset puberty. Similarly, males with testicular volume ≥ 6 cc at an age < 25th percentile for male pubertal onset were considered to have earlier onset puberty. Males with testicular volume ≤ 3 cc at an age > 75th percentile for TS2 for pubertal onset were categorized as having later onset puberty.
Statistical analyses
Statistical analyses were conducted with Stata software (StataCorp). The distribution of pubertal onset was compared between African American and non-African American males and females using Pearson's χ2 test. HVs at each age were compared between African American and non-African American participants using Student's t test. Because HVs were obtained in the same individuals over several years, longitudinal mixed effect models (xtmixed procedure) were used to compare HV at each age interval between African American and non-African American participants, adjusted for pubertal status (earlier, average, later), accounting for the multiple observations per subject. A P value < .05 was considered statistically significant.
Sex-specific HV reference ranges were constructed using the LMS method and LMSchartmaker software version 1.16 (21, 22). Variance in HV is not constant with change in age and pubertal status. The LMS method uses a Box-Cox transformation to obtain normality. This LMS method generates age-specific values for skewness (L), median (M), and variability (S). A SD score (Z) is also generated and corresponds to a percentile. These LMS values (found in Supplemental Table 2, a and b) can then be used to generate centile curves using the following equation: HV-centile = M(1 + LSZ)1/L (equation 1).
This equation can then be transformed such that a HV-Z can be generated for a given HV: HV-Z = [(HV/M)L − 1]/LS (equation 2).
As recommended by software guidelines, the fit of the centile curves was assessed using visual inspection on obtaining optimal L, M, and S values. A similar process was used to generate HV reference ranges for males and females based upon pubertal timing (earlier, average, later).
For comparison, empirically derived values at each age for the third, 10th, 25th, 50th, 75th, 90th, and 97th percentiles were determined and smoothed using the Lowess procedure in Stata (version 12.0; StataCorp). The smoothed curves were compared to the LMS curves and visually inspected to confirm the fit of the LMS curves.
Pearson correlations between year-to-year HV-Z, HV-Z and Ht-Z, and pubertal status-adjusted HV-Z and Ht-Z were also calculated for children age < 16 years.
In addition, median curves for early, average, and late maturers from Tanner and Davies (2) were plotted, along with the contemporary reference data developed in this study, and comparisons were made by visual inspection.
Results
In the age range specified, a total of 7308 HV measurements were obtained in 1707 subjects. However, when restricted to measurements that occurred within an interval of 12 ± 1 months, the number of HV measurements used was 4305 among 1541 participants;: 2127 annualized HVs were available in 766 males (178 African American), and 2178 annualized HVs were available in 775 females (172 African American). Sixty-seven percent of subjects contributed three or more HV measurements to the dataset, and less than 2% contributed only one measurement. Negative HV measurements (HV < 0 cm/y) occurred in 200 instances (4.6% of observations), but nearly all of these (72%) occurred among participants age 15 years or older and were within the range of measurement error (±0.5 cm). Nine negative HV values were excluded because they were < −1 cm/y, the designated cutoff for measurement error, and two other outliers were excluded for erroneous data entry.
In the total sample, timing of puberty (earlier, average, later) was available in 289 males and 299 females. Median age of onset of puberty in males was 11.1 years; the 25th and 75th percentiles for age at onset of puberty were 10.2 and 11.8 years, respectively. These ages were used to define earlier pubertal onset (<10.2 y) vs later pubertal onset (>11.8 y). Median age of onset of puberty in females was 10.4 years; the 25th percentile for age at pubertal onset was 9.6 years (used to define earlier onset puberty), and the 75th percentile was 11.1 years (used to define later onset puberty). A total of 929 annualized HVs were available in the subset of 289 males in whom pubertal onset was defined and who met the criteria for inclusion in the HV reference range (n = 278; earlier maturing n = 78 267 observations; average maturing n = 133 437 observations; later maturing n = 67 225 observations). For females, a total of 945 observations were available in 296 of the 299 females (earlier maturing n = 74 219 observations; average maturing n = 130 418 observations; later maturing n = 92 308 observations).
African American females were more likely to have an earlier pubertal onset than non-African American females. No differences in pubertal onset were observed in African American and non-African American males (Supplemental Table 1).
Differences in annualized HV were apparent between African American and non-African American children, particularly in females (Table 1). African American females tended to have greater HVs than non-African American females between the ages of 8.5 and 10.4 years, but after age 11.5 years HV tended to be slower in African American compared to non-African American females. However, after adjustment for pubertal onset, no differences in HV were found between African American and non-African American females. African American males had greater HV at age 12 years than non-African American males, but this difference was no longer apparent after adjustment for pubertal onset. Thus, separate reference ranges were not generated for African American vs non-African American males or females. Insufficient numbers of subjects of other population ancestry groups (eg, Asian, Mexican American) were recruited to conduct similar analyses in these subgroups.
Table 1.
HV in African American vs Non-African American Males and Females by Age Group
| Age, y | Males |
Females |
||||
|---|---|---|---|---|---|---|
| Non-African American | African American | P | Non-African American | African American | P | |
| 6 | 6.63 ± 0.90 (37) | 7.17 ± 0.93 (13) | .07 | 6.53 ± 0.86 (43) | 6.24 ± 1.48 (9) | .42 |
| 7 | 6.18 ± 0.72 (105) | 6.21 ± 0.80 (25) | .82 | 6.25 ± 0.87 (107) | 6.40 ± 1.25 (23) | .49 |
| 8 | 5.92 ± 0.98 (85) | 5.75 ± 0.85 (20) | .49 | 5.99 ± 1.05 (90) | 6.05 ± 1.17 (15) | .82 |
| 9 | 5.63 ± 1.02 (100) | 5.40 ± 0.93 (22) | .33 | 5.86 ± 1.23 (111) | 6.76 ± 1.58 (27) | .0017 |
| 10 | 5.49 ± 1.18 (116) | 5.64 ± 1.33 (32) | .53 | 6.26 ± 1.44 (140) | 6.81 ± 1.80 (34) | .06 |
| 11 | 5.57 ± 1.53 (144) | 6.39 ± 1.94 (34) | .0081 | 6.65 ± 1.55 (161) | 6.87 ± 1.81 (44) | .43 |
| 12 | 6.49 ± 2.08 (186) | 6.89 ± 2.70 (41) | .29 | 6.11 ± 1.83 (192) | 5.55 ± 2.29 (56) | .06 |
| 13 | 7.66 ± 2.40 (150) | 7.47 ± 2.33 (45) | .65 | 4.54 ± 2.28 (187) | 2.59 ± 1.67 (51) | <.0001 |
| 14 | 6.81 ± 2.40 (151) | 6.21 ± 2.69 (51) | .14 | 2.56 ± 1.93 (163) | 1.49 ± 1.57 (54) | .0003 |
| 15 | 4.51 ± 2.62 (168) | 4.11 ± 2.57 (53) | .32 | 1.24 ± 1.22 (171) | 0.38 ± 0.71 (53) | <.0001 |
| 16 | 2.66 ± 2.18 (163) | 2.06 ± 1.69 (43) | .1 | 0.66 ± 1.03 (192) | 0.53 ± 0.75 (50) | .40 |
| 17 | 1.13 ± 1.33 (163) | 0.93 ± 1.00 (38) | .39 | 0.34 ± 0.62 (154) | 0.25 ± 0.60 (41) | .44 |
| 18 | 0.48 ± 0.56 (105) | 0.40 ± 0.55 (36) | .48 | |||
Data are expressed as mean ± SD (number of subjects).
HV reference ranges
Smoothed age- and sex-specific reference percentiles for HV are shown in Supplemental Table 2, a and b. Lowess curves of empirical percentiles were graphically superimposed on the smoothed reference ranges generated by the LMS technique and agree well (Figure 1). Separate reference ranges were generated for males and females according to onset of puberty (earlier, average, later) (Figures 2 and 3). These smoothed reference ranges are not centered on age at peak HV, and thus, no single age at peak HV for earlier, average, and later maturing males and females is defined. Thus, median curves from Tanner and Davies (2) were graphically superimposed on the reference data (Figure 4); the early, average, and late maturing Tanner-Davies curves fall within the distribution of our reference percentiles despite the differences in defining maturation (±2 SD at age of peak HV vs < 25% or > 75% at age of entry into puberty). Individualized HV curves for randomly selected males with earlier, average, and later onset puberty are superimposed upon the annualized HV reference data to illustrate the cross-sectional nature of the reference data (Figure 5). For subjects midage < 16 years, the year-to-year correlation for Ht-Z was 0.95 (P < .0001), but for HV-Z it was only 0.33 (P < .0001) and between HV-Z and Ht-Z it was 0.25 to 0.29 (P < .0001). The year-to-year correlation for HV-Z was 0.11 for prepubertal subjects, 0.28 for Tanner stages 2 through 5, and 0.46 for Tanner stage 5 (P < .0001 for all). The poor agreement between HV-Z at baseline compared to subsequent visits is further illustrated in Supplemental Figure 1.
Figure 1.
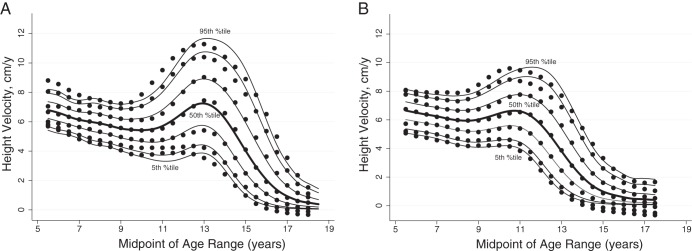
Reference curves for HV for males aged 5 to 18.5 years (A) and females aged 5 to 17.5 years (B). Shown are curves for the fifth, 10th, 25th, 50th, 75th, 90th, and 95th percentiles. The dots are the corresponding empirical percentiles smoothed with the Lowess method.
Figure 2.
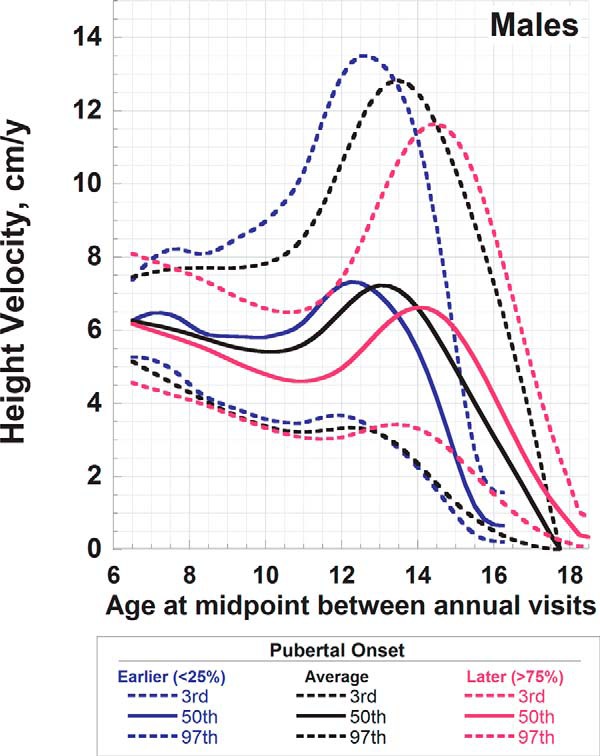
Reference curves for HV for male children aged 6 to19 years according to onset of puberty. Shown are the median and the third and 97th percentiles for earlier (blue), average (black), and later (red) onset puberty. Earlier puberty was defined as age of onset < 10.2 years, average onset as occurring between 10.2 and 11.8 years, and later puberty as onset at age > 11.8 years.
Figure 3.
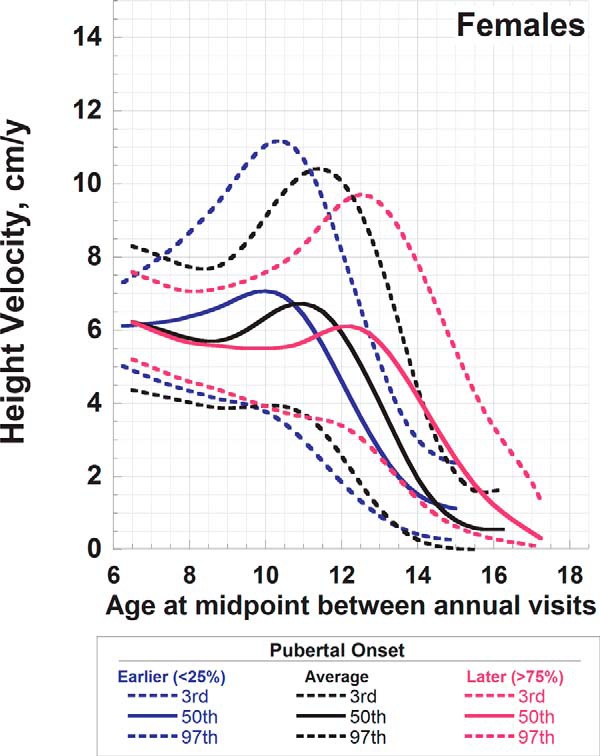
Reference curves for HV for female children aged 6–17 years according to onset of puberty. Shown are median and the third and 97th percentiles for earlier (blue), average (black), and later (red) onset puberty. Earlier puberty was defined as age of onset < 9.6 years, average onset as occurring between 9.6 and 11.1 years, and later puberty as onset at age > 11.1 years.
Figure 4.

Median curves (shown in black) for earlier, average, and later maturers were derived from the data of Tanner and Davies (2) and superimposed upon BMDCS references ranges (shown in dashed lines: median, third and 97th percentiles).
Figure 5.

Examples of earlier, average, and later maturing boys compared to BMDCS reference ranges (shown in black: median, third and 97th percentiles).
Discussion
Growth and pubertal development are key biomarkers of health status during childhood and adolescence. Thus, HV is useful in the clinical setting for determining whether growth is proceeding normally, and pubertal development is an important consideration in the growth evaluation. Here, we present annual HV reference ranges and their respective percentiles for the entire cohort and according to pubertal status using data derived from a large, 7-year longitudinal, multicenter, multiethnic study. Our reference ranges have the advantage of being able to calculate Z-scores and exact percentiles, whereas the previous publications only permit values to be entered onto the published graph.
Tanner and Davies developed HV curves for the US population by superimposing longitudinal velocity data primarily derived from the Harpenden study (3) upon the cross-sectional NCHS reference data (8). As such, these previously published HV curves are not empirically derived velocity reference data. Our reference ranges offer a number of advantages over the Tanner-Davies velocity curves; the velocities presented here are derived from longitudinal data obtained in a large diverse US population that included African Americans and Caucasians (both including a subset of Hispanics), as well as Asians. This contemporary population contrasts with the children included in the original Tanner and Whitehouse HV curves who were primarily of European origin (4, 5). Additionally, the Tanner and Whitehouse curves and the subsequent Tanner and Davies curves were centered on age at peak HV (2). The annual HV reference ranges presented here are not centered according to the age at peak HV. Instead, the reference ranges are based on the distribution of age-specific HV values, with separate reference ranges presented based on the timing of pubertal onset. Over time, an individual subject is not likely to “track” along a given percentile for HV, as evidenced by the poor correlation between year-to-year HV-Z and examples given in Figure 5, but would be expected to exhibit a HV that is within the reference range for sex, age, and, if known, the timing of pubertal onset. The “peaks” evident in the graphical representation of the HV reference ranges presented here should not be interpreted to represent the expected longitudinal HV of an individual; the third percentile curve does not represent third percentile for peak HV. In fact, a child with a HV at the third percentile at any given time is not expected to maintain a HV consistently on the third percentile, as highlighted by the low year-to-year HV-Z correlations. For these reasons, peak HV and age at peak HV from Tanner and Davies (2) (as well as data from reference curves of Berkey et al; Ref. 9) cannot be directly compared with the reference data provided here. However, whereas the median age-based reference ranges presented here are broader and less “peaked” compared to curves centered on age at peak HV, the full complement of age-based reference percentiles still captures peak HV values as shown in Figures 4 and 5.
Another important consideration is the use of HV curves based on pubertal onset. A secular trend in younger age of onset of puberty is well-recognized (12–14, 23). The median age of pubertal onset in males defined here as 11.1 years (25th percentile, 10.2 y; and 75th percentile, 11.8 y) contrasts with the data compiled by Tanner in 1962, as 11.5 years (10.8 y and 12.2 y) (24). Similarly, median age of onset of puberty in females was 10.4 years (25th percentile, 9.6 y; and 75th percentile, 11.1 y) and is earlier than that identified by Tanner as 10.9 years (25th percentile, 10.2 y; and 75th percentile, 11.6 y). The mean age of onset of female breast development was similar to that found in the cross-sectional data in females ages 8–18 years from National Health and Nutrition Examination Survey (NHANES) III (25). Our results for the mean age of pubertal onset in boys differed from NHANES III, but different assessment methods were used; we defined pubertal onset based upon enlargement in testicular volume rather than Tanner's stages of genital development. Accounting for puberty in HV curves is also relevant for assessing growth in African American girls who tend to have earlier puberty, onset of which impacts HV (25, 26). Moreover, in the clinic setting, age at peak HV is often not known in “real-time.” Instead, the timing of pubertal onset (earlier, average, later) is more often apparent, and the timing of the growth spurt may be deduced from pubertal status (27–30) and inferred from bone age.
Despite the differences in defining earlier and later maturation, the secular trend in earlier onset of puberty, and the inclusion of a more ethnically diverse population, the Tanner-Davies average maturing curves overlap well with the HV reference ranges developed here for average maturing children. Moreover, the Tanner and Davies earlier and later maturing median curves fall within our reference data. Additionally, after adjusting for pubertal onset, differences in HV are no longer apparent; thus, whereas the absolute ages at pubertal onset may be earlier, the relationship of growth to pubertal events remains consistent.
Other available reference data have some limitations to consider. The growth curves developed by Roche and Himes (10) in 1980 were based on measures obtained every 6 months in white children living in Ohio and recruited from 1929–1978 for the Fels longitudinal study. The population includes siblings and offspring, but the data are considered similar to those from a more ethnically representative sample in the NCHS data (8). As in the current study, curves for individuals were not individually plotted and centered; instead, HVs at each age were used to construct curves (10). Pubertal status, however, was not included, and separate curves for earlier and later maturing children were not constructed; instead, earlier maturation can be gleaned from the younger age and more rapid growth during the pubescent years.
In 1993, Berkey et al (9) published HV curves from over 6500 early, average, and late maturing African American and white children in the Six Cities Study, a longitudinal study of air pollution during which anthropometrics (but not pubertal staging) were obtained in the school setting. In contrast to the HV reference data presented here, maturation was defined by the age at peak HV. Subjects were defined as early or late if peak HV occurred at least 2 years younger (third percentile) or 2 years older (97th percentile) than the median age at peak HV of 13 years for males, 11 years for white girls, and 10 years for African American girls. Similar to our findings, Berkey et al (9) found that African American females tended to have higher HVs at younger ages—a function of maturational status. Data for African Americans and whites were thus combined in construction of early, average, late maturation HV curves. These curves may be less useful in the clinical setting when the timing of the peak growth spurt is not known.
The curves prepared here were constructed using the LMS method, which recognizes that parameters such as weight and height may not be normally distributed at any given age in growing children and, thus, transforms data to achieve normality. The curves agree well with those constructed using the Lowess method. An advantage of the LMS method is that percentiles and SD scores can be derived. Availability of these alternative expressions of HV is relevant not only for the clinical setting but also in research aimed at quantifying changes in HV during critical periods of growth when velocities change as a function of normal childhood development. The LMS method was also used in the construction of weight and length/HV centile for children 5 years of age and younger in the multinational longitudinal World Health Organization (WHO) study. The WHO growth curves generated for children ages 5–19 years relied on the Box-Cox power exponential transformation (31) and simplified to the LMS method, but were based upon historical data limiting the ability to develop separate velocity curves.
An important consideration when using these curves involves estimation of HV. The annualized HVs were calculated based upon heights obtained within 11 to 13 months of each other. If annualized HVs are based upon shorter or longer time intervals, biased estimates may result. Indeed, the impact of an error in measurement is magnified when the intervals of measurements are short (eg, just 6 mo) (10, 32). In addition, valid estimates of HV require careful measurement of height because the measurement error for velocity is greater than the measurement error for a single height measurement.
Several limitations to these new HV reference data are worth noting. First, because of their small numbers, Asian and Hispanic subgroups were not examined separately but were grouped with the non-African American group. We had limited representation of African American children within age-sex groups, so our power to detect differences in HV between African American and non-African American groups was limited. African American and non-African American groups were ultimately combined to generate HV curves because the few detectable differences in HV were no longer significant when tempo-specific reference ranges were used. However, we cannot exclude the possibility that the HV ranges for these subpopulations are different. Additionally, for the original Bone Mineral Density in Childhood Study from which the current data were derived, obese children were excluded at enrollment. Obesity is a risk factor for earlier onset of puberty, and obese children are frequently tall for age (33), suggesting that obesity impacts HV. De Leonibus et al (33) found earlier age at peak HV but lower overall peak HV in obese children compared to nonobese children. The extent to which these new HV curves are generalizable to obese children has not been formally tested. The presence of obesity also complicates identification of glandular breast tissue; to minimize misclassifying chest adiposity for breast tissue, breast tissue was visually inspected and palpated.
In this study, we present updated HV reference data based upon a large cohort of ethnically diverse, healthy children followed longitudinally. Annualized HV reference data for earlier, average, and later maturing children were categorized using pubertal status rather than timing of peak HV, thus allowing growth to be placed in the context of pubertal status. Moreover, these reference curves permit generation of exact HV Z-scores and percentiles and can be used by clinicians evaluating growth in children and in the clinical research arena where duration of follow-up is limited.
Acknowledgments
We are indebted to our collaborators in the pediatric endocrine divisions of each Bone Mineral Density in Childhood Study Clinical Center. In particular, we acknowledge David Langdon, Thomas Moshang, Steve Willi, Lorraine Katz, Charles Stanley, and Craig Alter and the faculty in the Division of Pediatric Endocrinology at Children's Hospital of Philadelphia; Lynda Fisher, Mitchell Geffner, Debra Jeandron, Steven Mittelman, Pisit Pitukcheewanont, and Francine Kaufman from Children's Hospital Los Angeles; Susan Rose, Frank Biro, Peggy Stenger, Debbie Elder, and James Heubi from Cincinnati Children's Hospital Medical Center; Mary Horlick, Natasha Leibel, and Abeer Hassoun at Columbia University Medical Center-St. Luke's Hospital; and Jean-Claude Desmangles from Creighton University. We thank our collaborators, Drs John Shepherd and Thomas Hangartner, from University of California, San Francisco, and Wright State, respectively. We also acknowledge the guidance and advice from the Data Safety and Monitoring Board members: Drs Clifford Rosen, Ralph D'Agostino, Ingrid Holm, James Reynolds, and Reginald Tsang.
This work was supported by Eunice Kennedy Shriver National Institute of Child Health and Human Development Contracts NO1-HD-1–3228, NO1-HD-1–3329, NO1-HD-1–3330, NO1-HD-1–3331, NO1-HD-1–3332, and NO1-HD-1–3333, and the Clinical and Translational Research Center Grants UL1RR024134 (National Center for Research Resources) and UL1TR000003 (National Center for Advancing Translational Sciences).
Disclosure Summary: The authors have nothing to declare.
Footnotes
- BMI
- body mass index
- HV
- height velocity
- TS
- Tanner stage.
References
- 1. Sovio U, Bennett AJ, Millwood IY, et al. Genetic determinants of height growth assessed longitudinally from infancy to adulthood in the northern Finland birth cohort 1966. PLoS Genet. 2009;5:e1000409. [DOI] [PMC free article] [PubMed] [Google Scholar]
- 2. Tanner JM, Davies PS. Clinical longitudinal standards for height and height velocity for North American children. J Pediatr. 1985;107:317–329 [DOI] [PubMed] [Google Scholar]
- 3. Tanner JM, Whitehouse RH. Clinical longitudinal standards for height, weight, height velocity, weight velocity, and stages of puberty. Arch Dis Child. 1976;51:170–179 [DOI] [PMC free article] [PubMed] [Google Scholar]
- 4. Tanner JM, Whitehouse RH, Takaishi M. Standards from birth to maturity for height, weight, height velocity, and weight velocity: British children, 1965. II. Arch Dis Child. 1966;41:613–635 [DOI] [PMC free article] [PubMed] [Google Scholar]
- 5. Tanner JM, Whitehouse RH, Takaishi M. Standards from birth to maturity for height, weight, height velocity, and weight velocity: British children, 1965. I. Arch Dis Child. 1966;41:454–471 [DOI] [PMC free article] [PubMed] [Google Scholar]
- 6. Tanner JM, Whitehouse RH, Marubini E, Resele LF. The adolescent growth spurt of boys and girls of the Harpenden growth study. Ann Hum Biol. 1976;3:109–126 [DOI] [PubMed] [Google Scholar]
- 7. Deming J. Application of the Gompertz curve to the observed pattern of growth in length of 48 individual boys and girls during the adolescent cycle of growth. Hum Biol. 1957;29:83–122 [PubMed] [Google Scholar]
- 8. Hamill PV, Drizd TA, Johnson CL, Reed RB, Roche AF. NCHS growth curves for children birth-18 years. United States. Vital and Health Statistics Series 11. Hyattsville, MD: US Department of Health, Education, and Welfare, Public Health Service, National Center for Health Statistics; 1977:1–74 DHEW Publication No. (PHS) 78–1650 [PubMed] [Google Scholar]
- 9. Berkey CS, Dockery DW, Wang X, Wypij D, Ferris B., Jr Longitudinal height velocity standards for U.S. adolescents. Stat Med. 1993;12:403–414 [DOI] [PubMed] [Google Scholar]
- 10. Roche AF, Himes JH. Incremental growth charts. Am J Clin Nutr. 1980;33:2041–2052 [DOI] [PubMed] [Google Scholar]
- 11. Herman-Giddens ME, Steffes J, Harris D, et al. Secondary sexual characteristics in boys: data from the Pediatric Research in Office Settings Network. Pediatrics. 2012;130:e1058–1068 [DOI] [PubMed] [Google Scholar]
- 12. Euling SY, Herman-Giddens ME, Lee PA, et al. Examination of US puberty-timing data from 1940 to 1994 for secular trends: panel findings. Pediatrics. 2008;121(suppl 3):S172–S191 [DOI] [PubMed] [Google Scholar]
- 13. Toppari J, Juul A. Trends in puberty timing in humans and environmental modifiers. Mol Cell Endocrinol. 2010;324:39–44 [DOI] [PubMed] [Google Scholar]
- 14. Biro FM, Galvez MP, Greenspan LC, et al. Pubertal assessment method and baseline characteristics in a mixed longitudinal study of girls. Pediatrics. 2010;126:e583–e590 [DOI] [PMC free article] [PubMed] [Google Scholar]
- 15. Cole TJ, Green PJ. Smoothing reference centile curves: the LMS method and penalized likelihood. Stat Med. 1992;11:1305–1319 [DOI] [PubMed] [Google Scholar]
- 16. Kalkwarf HJ, Zemel BS, Gilsanz V, et al. The bone mineral density in childhood study: bone mineral content and density according to age, sex, and race. J Clin Endocrinol Metab. 2007;92:2087–2099 [DOI] [PubMed] [Google Scholar]
- 17. Zemel BS, Kalkwarf HJ, Gilsanz V, et al. Revised reference curves for bone mineral content and areal bone mineral density according to age and sex for black and non-black children: results of the bone mineral density in childhood study. J Clin Endocrinol Metab. 2011;96:3160–3169 [DOI] [PMC free article] [PubMed] [Google Scholar]
- 18. Kuczmarski RJ, Ogden CL, Guo SS, et al. 2000 CDC Growth Charts for the United States: Methods and Development. Vital and Health Statistics Series 11, No. 246. Hyattsville, MD: Department of Health and Human Services, Centers for Disease Control and Prevention, National Center for Health Statistics; 2002:1–190 DHHS Publication No. (PHS) 2002–1696 [PubMed] [Google Scholar]
- 19. Tanner JM. Growth at adolescence. 2nd ed Oxford, UK: Blackwell Scientific; 1962 [Google Scholar]
- 20. Zachmann M, Prader A, Kind HP, Häfliger H, Budliger H. Testicular volume during adolescence. Cross-sectional and longitudinal studies. Helv Paediatr Acta. 1974;29:61–72 [PubMed] [Google Scholar]
- 21. Pan H, Cole T. LMSchartmaker, a program to construct growth reference data using the LMS method. Version 2.43. 2010. http://www.healthforallchildren.com/?product=lmschartmaker-pro Accessed November 1, 2013
- 22. Pan H, Cole TJ. LMSgrowth, a Microsoft Excel add-in to access growth references based on the LMS method. Version 2.69. 2010. http://www.healthforallchildren.com/?product=lmsgrowth Accessed November 1, 2013
- 23. Wagner IV, Sabin MA, Pfäffle RW, et al. Effects of obesity on human sexual development. Nat Rev Endocrinol. 2012;8:246–254 [DOI] [PubMed] [Google Scholar]
- 24. Tanner JM. Growth at Adolescence, With a General Consideration of the Effects of Hereditary and Environmental Factors Upon Growth and Maturation From Birth to Maturity. 2nd ed Oxford, UK: Blackwell; 1962 [Google Scholar]
- 25. Sun SS, Schubert CM, Chumlea WC, et al. National estimates of the timing of sexual maturation and racial differences among US children. Pediatrics. 2002;110:911–919 [DOI] [PubMed] [Google Scholar]
- 26. Salsberry PJ, Reagan PB, Pajer K. Growth differences by age of menarche in African American and White girls. Nurs Res. 2009;58:382–390 [DOI] [PMC free article] [PubMed] [Google Scholar]
- 27. Marshall WA. Interrelationships of skeletal maturation, sexual development and somatic growth in man. Ann Hum Biol. 1974;1:29–40 [DOI] [PubMed] [Google Scholar]
- 28. Roche AF, Eyman SL, Davila GH. Skeletal age prediction. J Pediatr. 1971;78:997–1003 [DOI] [PubMed] [Google Scholar]
- 29. Nahhas RW, Sherwood RJ, Chumlea WC, Towne B, Duren DL. Predicting the timing of maturational spurts in skeletal age. Am J Phys Anthropol. 2013;150:68–75 [DOI] [PMC free article] [PubMed] [Google Scholar]
- 30. Lazar L, Lebenthal Y, Shalitin S, Phillip M. Natural history of idiopathic advanced bone age diagnosed in childhood: pattern of growth and puberty. Horm Res Paediatr. 2011;75:49–55 [DOI] [PubMed] [Google Scholar]
- 31. de Onis M, Onyango AW, Borghi E, Siyam A, Nishida C, Siekmann J. Development of a WHO growth reference for school-aged children and adolescents. Bull World Health Organ. 2007;85:660–667 [DOI] [PMC free article] [PubMed] [Google Scholar]
- 32. Goldstein H. Sampling for growth studies. In: Faulkner F, Tanner JM, eds. Human Growth: A Comprehensive Treatise. New York: Plenum Press; 1986;59–78 [Google Scholar]
- 33. De Leonibus C, Marcovecchio ML, Chiavaroli V, de Giorgis T, Chiarelli F, Mohn A. Timing of puberty and physical growth in obese children: a longitudinal study in boys and girls [published online May 27, 2013]. Pediatr Obes. doi:10.1111/j.2047–6310.2013.00176.x [DOI] [PubMed] [Google Scholar]