

Abstract
Background: Changes in lipid profile have been associated with malignancy because of their key role in the maintenance the integrity of the cell membrane. This study evaluated the alterations in serum lipid profile in untreated patients of oral submucus fibrosis (OSMF), oral leukoplakia, and oral lichen planus and proven cases of oral cancer with respect to healthy controls. Materials & Methods: In this case control study, 20 clinically and histopathologically proven patients of oral precancer and oral cancer each were compared with 20 healthy controls. In these groups, serumlipids including: (i) Total cholesterol. (ii) Triglycerides (TGL). (iii) High density lipoprotein cholesterol (HDL), low density lipoprotein cholesterol (LDL) and very low density lipoprotein cholesterol (VLDL) were analyzed. Results: Decrease in plasma total cholesterol, triglycerides, HDL, LDL, VLDL in the subjects with the oral precancer and oral cancer as compared to the controls was statistically significant. There was also decrease in plasma levels of TGL and VLDL in oral cancer subjects as compared to precancer subjects. Thus, it was found that there is an inverse relationship between plasma lipid levels and patients. Conclusion: Post operative morbidity was increasing along with more operating time and increase in the depth of mandibular third molar impaction. How to cite the article: Garg D, Sunil MK, Singh PP, Singla N, Rani SR, Kaur B. Serum lipid profile in oral precancer and cancer: a diagnostic or prognostic marker? J Int Oral Health 2014;6(2):33-9.
Key words: : head cancer, leukoplakia, lichen planus, lipid profile, neck cancer, oral submucus fibrosis
Introduction
In recent years, head and neck cancer has become one of the major causes of morbidity and mortality. 1 Oral carcinoma is one of the most prevalent cancers and is one of the 10 most common causes of death. So, earlier the cancer is diagnosed, better is the outcome. 2 Oral cancer is usually preceded by lesions which are non-cancerous to begin with and which have therefore been termed as precancerous. 2 A variety of premalignant lesions and conditions having malignant potential includes mainly leukoplakia, erythroplakia, oral lichen planus, oral submucous fibrosis.
Biochemical studies in evaluation of cancer have shown that various substances alter quantitatively in the serum during tumor development and are referred to as tumor markers. So, if the biochemical changes occur even before frank cancer has occurred, we can predict even in oral
precancerous lesions and conditions whether a particular individual is at risk or not. 3 - 5
Cholesterol is an amphipathic lipid and it is an essential structural component of all cell membranes and of the outer layer of plasma lipoproteins. It is present either as free cholesterol or combined with a long-chain fatty acid, as cholesterylesterin tissues and in plasma lipoprotein. 6 Fundamentally the development of a malignancy requires the uncontrolled and excessive proliferation of cells. 7 These rapidly forming cells need many basic components well above the normal limits which are used in physiological process. One such component which forms major cell membrane components essential for various biological functions including cell division and growth of normal and malignant tissues is lipids. Lipid stores are diminished due to increased use of lipids by this rapidly dividing cells. 8 , 9
So, this study was undertaken to evaluate whether alterations in serum cholesterol levels have a diagnostic or prognostic role in early diagnosis and treatment of oral premalignant and malignant lesions.
Materials and Methods
A hospital based study was conducted in 60 individuals who visited the Department of Oral Medicine and Radiology, from Guru Nanak Dev Dental College and Research Institute, Sunam, India. 20 clinically diagnosed
and histologically proven oral cancer and 20 with oral precancer were included in this study. 20 healthy individuals, who had no complaint or any major illness in the recent past, were included in the study as controls. Written consent was taken from the patients for the same. Signs, symptoms, and detailed history including habits, histopathology, and extended lipid profile estimation were recorded in all patients.
Blood samples of overnight fasting were collected in plain vials. Serum was collected after centrifugation and stored at 80 o Cuntil analyzed. Plasma levels of cholesterol, triglycerides, and HDL were calculated by using des kits obtained from Erba Diagnostics, Mannheim. Statistical
analysis was performed.
Results
The study comprised of 60 patients who were divided into 3 groups. In Group I (precancer group), total number of patients were 20 out of which 5 were females and 15 male subjects. In Group II (cancer group) total number of patients was20 out of which 3 were females and 17 male
subjects. In Group III (control group), total number of patients were 20 out of which 6 were females and 14 male subjects. ( Graph 1 )
Graph 1: Number of patients and the gender distribution included in the study.
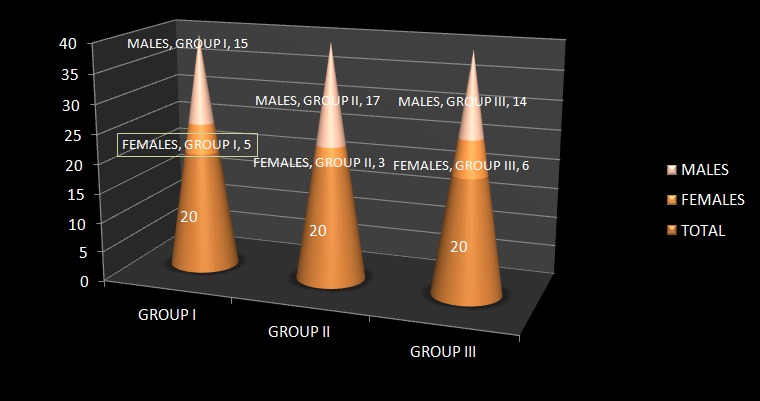
In total of 60 patients, Group I (pre cancer group) included subjects in the age group of 20-70 years. Group II (cancer group) included subjects in the age group of 35-70 years. Group III (control group) included subjects in the age group of 30-72 years.
Intergroup Comparison for Serum Cholestrol Level in Group I (Precancer Group), Group II (Cancer Group) and Group III (Control Group)
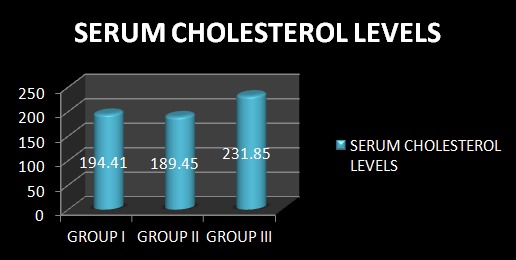
Serum cholesterol levels were 194.41mg% in the oral precancer group, 189.45 mg% in oral cancer group and 231.85 mg% in the control group according to Table 1 . ( Graph 2 ) The difference in serum cholesterol levels between Group I and Group II are statistically insignificant. (p = 0.474) whereas both Group I and Group II show a statistically significant lower value than Group III (p=0.000).
Table 1: Showing Intergroup Comparison for Serum Cholesterol Level between Cancer Group, Precancer Group and Control Group.
| GROUPS | N | Mean(mg%) | Std. Deviation | Std. Error | F value | p value | Significance |
| Group I | 20 | 194.41 | 24.76 | 5.53 | 29.366 | 0.000 | Significant Difference |
| Group II | 20 | 189.45 | 18.14 | 4.05 | |||
| Group III | 20 | 231.85 | 12.47 | 2.79 |
Graph 2: Showing Intergroup Comparison for Serum Cholesterol Level between Cancer Group, Precancer Group and Control Group.
Intergroup Comparison for Serum Triglyceride Level in Group I (Precancer Group), Group II (Cancer Group) and Group III (Control Group)
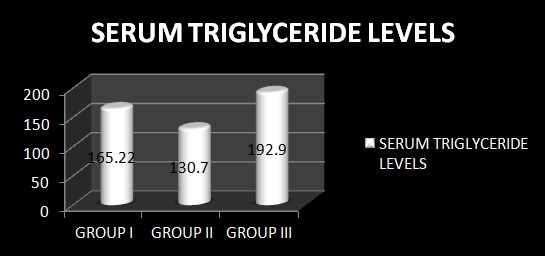
Serum triglyceride levels were found to be 165.22 mg% in the oral precancer group, 130.70 mg% in the subjects with oral cancer and 192.90 mg% in the control group according to Table 2 . ( Graph3 ) The serum Triglyceride levels were statistically significantly lower in the oral cancer group as compared to the oral precancer group. (p = 0.024). Also, both Group I and Group II show statistically significant difference in serum TGL levels with Group III (p=0.020, p=0.000).
Table 2: Showing Intergroup Comparison for Serum Triglyceride Level between Cancer Group, Precancer Group and Control Group.
| GROUPS | N | Mean(mg%) | Std. Deviation | Std. Error | F value | p value | Significance |
| Group I | 20 | 165.22 | 50.26 | 11.23 | 13.420 | 0.000 | Significant Difference |
| Group II | 20 | 130.70 | 41.98 | 9.38 | |||
| Group III | 20 | 192.90 | 7.27 | 1.63 |
Graph 3: Showing Intergroup Comparison for Serum Triglyceride Level between Cancer Group, Precancer Group and Control Group.
Intergroup Comparison for Serum HDL Level in Group I (Precancer Group), Group II (Cancer Group) and Group III (Control Group)
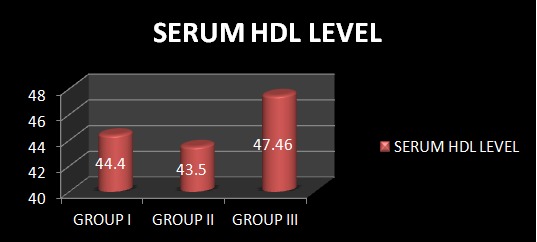
Serum HDL levels were found to be 44.40 mg% ± 3.48 in the oral precancer group, 43.50 mg% ± 2.01 in the subjects
with oral cancer and 47.46 mg% ± 1.50 in the control group according to Table 3 . ( Graph 4 ) The serum HDL levels were statistically significantly lower in the oral precancer and oral cancer group as compared to the control group (p = 0.001, p = 0.000). The difference in serum cholesterol levels between Group I and Group II were statistically insignificant (p = 0.324).
Table 3: Intergroup Comparison for Serum HDL Level between Cancer Group, Precancer Group and Control Group.
| GROUPS | N | Mean(mg%) | Std. Deviation | Std. Error | F value | p value | Significance |
| Group I | 20 | 44.40 | 3.48 | 0.78 | 14.011 | 0.000 | Significant Difference |
| Group II | 20 | 43.50 | 2.01 | 0.45 | |||
| Group III | 20 | 47.46 | 1.50 | 0.33 |
Graph 4: Showing Intergroup Comparison for Serum HDL Level between Cancer Group, Precancer Group and Control Group.
Intergroup Comparison for Serum LDL Level in Group I (Precancer Group), Group II (Cancer Group) and Group III (Control Group)
Serum LDL levels were found to be 115.70 mg % in the subjects with oral precancer, 119.65 mg% in the subjects with oral cancer and 145.80 mg% in the control group according to Table 4 . ( Graph 5 ) Serum LDL levels were found to be statistically significantly lower in oral precancer group and oral cancer group as compared to the control group. (p = 0.000). The difference in serum LDL levels between the subjects with oral cancer and those with oral precancer was statistically insignificant (p = 0.484).
Table 4: Showing Intergroup Comparison for Serum LDL Level between Cancer Group, Precancer Group and Control Group.
| GROUPS | N | Mean(mg%) | Std. Deviation | Std. Error | F value | p value | Significance |
| Group I | 20 | 115.70 | 20.75 | 4.64 | 21.849 | 0.000 | Significant Difference |
| Group II | 20 | 119.65 | 13.94 | 3.12 | |||
| Group III | 20 | 145.80 | 10.46 | 2.34 |
Graph 5: Showing Intergroup Comparison for Serum LDL Level between Cancer Group, Precancer Group and Control Group.

Intergroup Comparison for Serum VLDL Level in Group I (Precancer Group), Group II (Cancer Group) and Group III (Control Group)
Serum VLDL levels were found to be 32.65 mg% ± 9.05 in the subjects with oral precancerous lesion group, 26.15 mg% ± 8.39 in the subjects with oral cancer and 38.58 mg% ± 1.45 in the control group according to Table 5 . ( Graph 6 ) Serum VLDL levels were found to be statistically significantly lower in the oral precancer group and oral cancer group as compared to the control group. (p = 0.006, p = 0.000). Also, the serum VLDL levels were statistically significantly lower in the oral cancer group as compared to the oral precancer group (p = 0.020).
Table 5: Showing Intergroup Comparison for Serum VLDL Level between Cancer Group, Precancer Group and Control Group.
| GROUPS | N | Mean(mg%) | Std. Deviation | Std. Error | F value | p value | Significance |
| Group I | 20 | 32.65 | 9.05 | 2.02 | 15.004 | 0.000 | Significant Difference |
| Group II | 20 | 26.15 | 8.40 | 1.88 | |||
| Group III | 20 | 38.58 | 1.45 | 0.32 |
Graph 6: Showing Intergroup Comparison for Serum VLDL Level between Cancer Group, Precancer Group and Control Group.

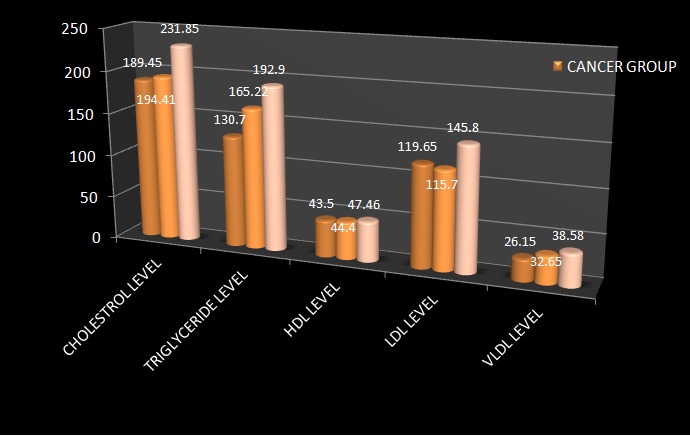
All these above values are compared in single graphical representation ( Graph 7 ).
Graph 7: Intergroup Comparison for Serum Lipid Profile Level between the three groups.
Discussion
Cholesterol which is an amphipathic lipid is an essential structural component of all cell membranes and of the outer layer of plasma lipoproteins. It is present either as free cholesterol or combined with a long-chain fatty acid, as cholesterylesterin tissues and in plasma lipoprotein. It is synthesized from acetyl-CoA in many tissues and is ultimately eliminated as cholesterol or bile saltsfrom the body. In the circulation, lipoprotein transports free cholesterol and it readily equilibrates cholesterol in other lipoproteins and in membranes. 3 , 10 - 12
Head and neck cancer is one of the major causes of morbidity and mortality and habit of tobacco consumption is a known etiological factor for development of oral precancerous disease and head and neck cancer. Patients who suffer from oral precancerous conditions show a
significant tendency to develop cancer. Free radicals and reactive oxygen species are generated from tobacco carcinogens which are responsible for high rate of oxidation / per oxidation of polyunsaturated fatty acids. It results in greater utilization of lipids including total cholesterol, lipoproteins and triglycerides for new membrane biogenesis. Cells fulfill these requirements either from circulation, or by synthesis through
metabolism or from degradation of major lipoprotein fractions like VLDL, LDL, and HDL. 5 , 13 , 14
In the present study, a significant decrease in plasma total cholesterol, TGL, HDL, LDL and VLDL was observed in oral precancer and cancer patients as compared to the controls. A significant decrease was also observed in plasma levels of TGL and VLDL in oral cancer group as
compared to oral precancer group.
Conclusion
The change in lipid levels may have a diagnostic or prognostic role in the early diagnosis or prognostication for oral premalignant and malignant lesions. The lower plasma lipid status may be a useful indicator for initial changes occurring in neoplastic cells. So, our study opens new prospects for serum lipid profile to be a diagnostic marker for identifying the precancerous and cancerous conditions from their serum lipid levels. However, a detailed study of cholesterol carrying lipoprotein transport and the efficiency of the receptor system may help in understanding the underlying mechanisms of regulation of plasma cholesterol concentrations in cancer.
Footnotes
Source of Support: Nil
Conflict of Interest: None
Contributor Information
Deepanshu Garg, Department of Oral Medicine & Radiology, Guru Nanak Dev Dental College and Research Institute, Sunam, Punjab, India.
M K Sunil, Department of Oral Medicine & Radiology, Guru Nanak Dev Dental College and Research Institute, Sunam, Punjab, India.
Param Pal Singh, Department of Oral Medicine & Radiology, Guru Nanak Dev Dental College and Research Institute, Sunam, Punjab, India.
Neetu Singla, Department of Oral Medicine & Radiology, Guru Nanak Dev Dental College and Research Institute, Sunam, Punjab, India.
S R Ashwini Rani, Department of Oral Medicine & Radiology, School of Dental Sciences, KIMSDU, Maharashtra, India.
Beant Kaur, Department of Oral Medicine & Radiology, Guru Nanak Dev Dental College and Research Institute, Sunam, Punjab, India.
References
- 1.PS Patel, MH Shah, FP Jha, GN Raval, RM Rawal, MM Patel, JB Patel, DD Patel. Alterations in Plasma Lipid Profile Patterns in Head and Neck Cancer and Oral Precancerous Conditions. Indian J Cancer. 2004;41(1):25–31. [PubMed] [Google Scholar]
- 2.VK Lohe, SS Degwekar, BhowateRR, RP Kadu, SB Dangore. Evaluation ofn correlation of serum lipid profile in patients with oral cancer and precancer and its association with tobacco abuse. J Oral Pathol Med. 2010;39:141–148. doi: 10.1111/j.1600-0714.2009.00828.x. [DOI] [PubMed] [Google Scholar]
- 3.JG Chawda, SS Jain, HR Patel, N Chaduvula, K Patel. The relationship between serum lipid levels and the risk of oral cancer. Indian J Med Paediatr Onc. 2011;32(1):34–37. doi: 10.4103/0971-5851.81888. [DOI] [PMC free article] [PubMed] [Google Scholar]
- 4.RJ Oliver, P Sloane, MN Pemberton. Oral biopsies: methods and applications. Br Dent J. 2004;196:329–333. doi: 10.1038/sj.bdj.4811075. [DOI] [PubMed] [Google Scholar]
- 5.WT Friedawald, RI Levy, DS Fredrickson. Estimation of the Concentration of Low-Density Lipoprotein Cholesterol in Plasma, without use of the Preparative Ultracentrifuge". Clin Chem. 1972;18(6):492–502. [PubMed] [Google Scholar]
- 6.R Mehrotra, S Pandya, AK Chaudhary, HP Singh, RK Jaiswal, M Singh, SC Gupta, M Singh. Lipid profile in oral submucous fibrosis. Lipids Health Dis. 2009;8(29):2–7. doi: 10.1186/1476-511X-8-29. [DOI] [PMC free article] [PubMed] [Google Scholar]
- 7.S Gupta, S Gupta. Alterations in serum lipid profile patterns in oral cancer and oral precancerous lesions and conditions-a clinical study. Indian J Dent. 2011;2(2):1–7. [Google Scholar]
- 8.BW Neville, TA Day. OralCancer and Precancerous Lesions. CA Cancer J Clin. 2002;52:195–215. doi: 10.3322/canjclin.52.4.195. [DOI] [PubMed] [Google Scholar]
- 9.P Nayak, S Nayak, MD Darafsh. Alteration in plasma lipid profile in precancerous conditions. J Nepal Dent Assoc. 2010;11(1):40–45. [Google Scholar]
- 10.JE Bouquot, BS Whitaker. Oral leukoplakia- rationale for diagnosis and prognosis of its clinical subtypes or phases. Quintessence Int. 1994;25:133–140. [PubMed] [Google Scholar]
- 11.T Axell, P Holmstrup, IR Kramer, JJ Pindborg, M Shear. International seminar on oral leukoplakia and lesions related to tobacco habits. Community Dent Oral Epidemiol. 1984;12:145–154. [Google Scholar]
- 12.WK Hong, J Endicott, LM Itri, W Doos, JG Batsakis, R Bell, al et. 13-cis-retinoic acid in the treatment of oral leukoplakia. N Engl J Med. 1986;315 (24):1501–1505. doi: 10.1056/NEJM198612113152401. [DOI] [PubMed] [Google Scholar]
- 13.P McCarthy, G Shklar. Keratinizing lesions of the oral mucosa in Diseases of the oral mucosa, 2nded. Philadelphia, USA:Lea and Febiger. 1980:182–202. [Google Scholar]
- 14.World health organization collaborating centre for oral precancerous lesions. Definition of oral leukoplakia and related lesions: an aid to studies on oral precancer. Oral Surg Oral Med Oral Pathol. 1978;46:518–539. [PubMed] [Google Scholar]