

Abstract
Drug resistance causes treatment failure in approximately 50% of breast cancer patients with chemotherapy. Overexpression of glucosylceramide synthase (GCS) confers drug resistance in cancer cells, and suppression of GCS sensitizes cancers to chemotherapy in preclinical studies. Thus, GCS becomes a potential target to reverse drug resistance, however, little is known about GCS expression levels in normal tissues and whether GCS overexpression is associated with metastatic cancers. Herewith, we report our studies in GCS expression levels and breast cancer from patients. GCS levels were analyzed using cancer profiling arrays, breast cancer histo-arrays and quantitative RT-PCR in tumor tissues. We found that breast (18 exp. index) and other hormone-dependent organs (testis, cervix, ovary, prostate) displayed the lowest levels of GCS mRNA, whereas liver (52 exp. index) and other organs (kidney, bladder, stomach) displayed the highest levels of GCS. GCS mRNA levels were significantly elevated in tumors of breast, cervix, rectum and small intestine, as compared to each paired normal tissue. In mammary tissue, GCS overexpression was detected in breast cancers with metastasis, but not in benign fibroadenoma or primary tumors. GCS overexpression was coincident with HER2 expression (γ2=0.84) in ER-negative breast adenocarcinoma. In tumor specimens, GCS mRNA was elevated by 4-fold and significantly associated with stage III (5/7), lymph node-positive (7/8) and estrogen receptor-positive breast cancers (7/9). GCS expression was significantly and selectively elevated in breast cancer, in particular in metastatic disease. GCS overexpression was highly associated with ER-positive and HER2-positive breast cancer with metastasis. Although a small study, these data suggest that GCS may be a prognostic indicator and potential target for the treatment of chemotherapy-refractory breast cancer.
Keywords: glucosylceramide synthase, drug resistance, breast cancer, metastasis
Introduction
Chemotherapy remains the standard treatment for more than 80% of patients with metastatic breast cancer (1–3). A myriad of antineoplastic agents are currently utilized in the clinic; however, once drug resistance appears during the course of treatment, most solid tumors including breast cancer are no longer responsive to these therapeutic agents. In general, systemic agents are active early on in 90% of primary breast cancers, but in only 50% of cancers with metastasis (2,3). Multidrug resistance (MDR) occurs in more than 50% of cancer patients given chemotherapy and ultimately results in malignant progression and treatment failure (2,3). Although important therapeutic advances have been made since the late 1980s, the overall prognosis for patients with metastatic breast cancer remains poor, with a median survival of 2–3 years and a 5-year survival rate of 26.7% (4). Increased expression of genes associated with drug action and cell proliferation is the corner-stone of MDR. Drug resistance genes such as MDR1 and Bcl-2 are highly expressed in tumors and cancer cell lines which respond poorly to chemotherapy (1,5–7). However, reversal of drug resistance in breast cancer by targeting drug resistance genes including MDR1 and Bcl-2 has not produced satisfactory results in clinic (2,8). This problem serves to highlight the biochemical sophistication of the cellular resistance process and challenges researchers to identify novel target, rather than drug resistance markers to improve chemotherapy.
Recent studies have shown that glucosylceramide synthase (GCS) is associated with drug resistance in cancer cells (9–13). GCS transfers a glucose residue from UDP-glucose to ceramide for the synthesis of glucosylceramide and this glycosylation mainly occurs on the surface of the Golgi (14,15). Ceramide, a lipid second messenger, induces growth arrest and/or apoptosis in cancer cells; ceramide-induced apoptosis contributes to the therapeutic efficacies of anthracyclines, taxanes, Vinca alkaloids, and radiation therapy (10,16–19). In prior studies we and others have shown that overexpression of GCS in cancer cells conferred resistance to doxorubicin, daunorubicin, and tumor necrosis factor-α (20–22), and GCS overexpression has been characterized as a resistance mechanism in MDR cell lines of breast, ovarian, cervical, and colorectal cancer (23,24). Suppression of GCS expression by siRNA or antisense oligonucleotide sensitizes cancer cells and tumor xenografts to chemotherapy (9,25–27). Other studies have reported that GCS is overexpressed in leukemia patients with poor response to chemotherapy (28,29), and results of gene-expression profiling indicate that GCS overexpression is a genetic signature for the progression and metastasis of renal cell cancer and penile carcinoma (30,31). Retrospective analyses of microarray data in clinical trials indicate that GCS expression is associated with certain types of breast cancer and is one of the metagene predicting pathological response to neoadjuvant paclitaxel in breast cancer patients (32,33). The present study is an initial inquiry using tumor specimens to assess whether GCS expression is highly associated with breast cancer.
Materials and methods
GCS gene expression analysis on cDNA filter array
A filter array containing normalized cDNA from 19 different types of cancers and corresponding normal tissues as well as from 9 human cancer cell lines (Cancer Profiling Array II; BD Biosciences Clontech, Palo Alto, CA) was hybridized with [32P]-labeled cDNA probes for human GCS following methods recommended by the manufacturer. The 19 types of tissues included ten tumor samples in breast, ovary, colon, stomach, lung, kidney, uterus cervix, rectum, thyroid gland, testis and skin. Provided were seven tumor samples in small intestine and pancreas, six in bladder and vulva, four in prostate, and three in trachea and liver. The nine cancer cell lines included G361 metastatic melanoma cells, SW480 metastatic colon adenocarcinoma, A549 lung carcinoma, K562 chronic myelogenous leukemia, Daudi Burkitt’s lymphoma, HeLa cervical carcinoma, Raji Burkitt’s lymphoma, HL-60 acute promyelocytic leukemia, and MOLT4 human T-cell leukemia. The cDNA probe (1.1 bp) recognizing human GCS was excised with the EcoRI from pcDNA 3.1-GCS plasmid (9). Purified GCS probes (50 ng) were labeled by random primed DNA labeling using [α-32P]dCTP following the manufacturer’s protocol (Roche Diagnostics). Labeled cDNA probe was purified on a BD chroma spin+STE-100 column (BD Biosciences Clontech). Images were acquired using a Storm phosphorImager (GE Healthcare, Piscataway, NJ), and subsequent data analysis was performed using an Array-Pro Analyzer program (Media Cybernetics, Bethesda, MD). A tumor/normal ratio of two or higher in each individual was considered to be significant.
GCS and HER2 expression in breast cancer histo-array
Histoarray slides of breast cancer (IMH-304) were purchased from Imgenex (San Diego, CA). Each slide included 60 specimens: normal breast tissue (8 cases), nipple (2 cases), infiltrating ductal carcinoma (35 cases), and metastatic carcinoma in lymph node (10 cases) from patients ages 28–66. For immunostaining, antigens were retrieved in steaming sodium citrate buffer (10 mM, 0.05% Tween-20, pH 6.0; for 10 min). After blocking with 2% block solution (Vector Laboratories, Burlingame, CA), the slides were incubated with primary antibody against GCS (1:100) or HER2, overnight at 4°C. The GCS-antibody cells on slides were recognized by Alexa Fluor® 488 goat anti-rabbit IgG (Invitrogen). Cell nuclei were counterstained with propidium iodide in mounting solution (Vector Laboratories). Anti-human GCS rabbit serum (GCS 6.2) was kindly provided by Drs D.L. Marks and R.E. Pagano (Mayo Clinic and Foundation, Rochester, MN). A rabbit anti-human HER2/Neu polyclonal antibody (C-18) was purchased from Santa Cruz Biotech (Santa Cruz, CA). After mounting, the slides were scanned using ArrayWoR biochip reader (Applied Precision, Issaquah, Washington) and analyzed with Array-Pro analyzer.
GCS gene expression analyses in mammary tissues
All human tumor and normal tissue samples were collected from patients who were admitted to the Wuxi People’s Hospital (Wuxi, China), and the John Wayne Cancer Institute (Santa Monica, CA) for standard treatment of breast diseases. Informed consent was obtained for inclusion in the study which had been approved by local Institutional Review Board (IRB), following NIH regulations. Patient ages were 39–70; the diagnosis for each was identified by pathologists. The mammary tissues were collected during treatment procedure and stored in a tissue bank. RNA was extracted using RNeasy protect mini kit (Qiagen, Valencia, CA) and quantified by spectrometry and an RNA 6000 Nano LabChip kit in a 2100 Bioanalyzer (Agilent Technologies, Santa Clara, CA). Equal amounts of RNA (100 ng) were used to amplify GCS. Primers and probe sequences for GCS were chosen as follows: GCS forward 5′-GACCTGGCCTTGGAGGGAAT-3′, GCS reverse 5′-GAG ACACCTGGGAGCTTGCT-3′, and GCS probe 5′ FAM CCG TCTTCGGGTTCGTCCTCTTCTTGGT Tamar 3′ (Applied Biosystems, Foster City, CA). A fragment of 149-bp in the region of the GCS gene (303–451; GenBank accession no. NM_003358) was produced using SuperScript III Platinium one-step quantitative RT-PCR system (Invitrogen, Chicago, IL) in a Rotor-Gene 3000 (Corbett Research, Sydney, Australia). Quantization was carried out using human GCS DNA standard curves generated by serial dilution of pcDNA 3.1-GCS plasmid (9). Human β-actin was used as endogenous control.
Statistical analysis
All data represent the mean ± SD. Student’s t-test (for 2 groups) and ANOVA (for more than 3 groups) were used to calculate statistical significance using a Prism 4 program (GraphPad software, San Diego, CA). Statistical significance was defined as P<0.001. Overexpression was defined as the difference >2-fold in an individual or as more than the mean ± 2SD in a group.
Results
GCS is elevated in hormone-relevant tumors
In order to examine whether GCS is associated with tumor status, we assessed GCS gene expression in human tumors paired with normal tissues (from the same individuals). Using a cancer gene array, we measured GCS mRNA levels in 19 different types of tumors (154 cases), compared to paired normal tissues (Fig. 1A). The overall levels of GCS mRNA in tumors (right columns) was higher than in normal tissue (left columns), but the difference was found not significant (31.72±8.53 vs. 29.09±5.73 ROD) (Fig. 1A). The levels of GCS mRNA (ROD) in normal tissues from high to low were kidney (43.6), vulva (39.14), stomach (38.4), pancreas (38.3), colon (32.9), bladder (31), prostate (29.8), lung (29.4), skin (29.1), cervix (27.3), rectum (26.2), thyroid gland (22), breast (21.7), uterus (21.4), ovary (20.3) and testis (16.6). Among nine human cancer cell lines tested (see single column, designed as cell lines, Fig. 1A), GCS levels in aggressive cancers were substantially higher than in normal tissue. GCS mRNA levels were 238% in G361 metastatic melanoma, 187% in SW480 colon adenocarcinoma, and 144% in A549 lung carcinoma cells, respectively, as compared to corresponding normal tissues. The cell lines with GCS mRNA levels (ROD) from high to low were G361 metastatic melanoma cells (70.5), SW480 metastatic colon adenocarcinoma (61.4), A549 lung carcinoma (42.3), K562 chronic myelogenous leukemia (35.6), Daudi Burkitt’s lymphoma (24.6), HeLa cervical carcinoma (24.2), Raji Burkitt’s lymphoma (22.9), HL-60 acute promyelocytic leukemia (22.2) and MOLT4 human T-cell leukemia (19.6) (Fig. 1A). GCS levels were found to be significantly higher in tumors of cervix, rectum, small intestine, and breast, as compared with paired normal tissues from the same individuals. More interestingly, we found in breast cancer that the GCS mRNA in metastatic disease was 2-fold higher than in primary tumor (Fig. 1C). Furthermore, GCS was overexpressed in six of ten breast cancer subjects (>2-fold), and all of these six tumors were metastatic disease.
Figure 1.

GCS mRNA levels in normal tissues and paired tumors. (A) GCS cDNA tissue array. The cancer profiling Array II was hybridized with [32P]-labeled GCS probe. Left column, normal tissue; right column, tumor tissue paired with normal tissue of left column. †, trachea; ¶, liver; n. ctrl, negative control including the yeast total RNA, yeast total tRNA, E. coli DNA, poly(A) and ubiquitin cDNA undetectable; p. ctrl, positive control including human C0t-1 repetitive DNA (top spot) and genomic DNA (bottom spot) detected in the far right column; (B) GCS mRNA levels in normal tissues. GCS expression levels were normalized against average optical density of positive control (human genomic DNA), and presented as mean ± SD of relative OD (ROD) for each group. (C) GCS mRNA expression and tumors. *p<0.001 compared with nonmetastatic breast tumors.
GCS is overexpressed in metastatic breast cancer and associated with HER2 in ER-negative breast cancers
We further examined GCS protein expression by breast cancer histo-array. The CB2 breast cancer histo-arrays included 40 cases of infiltrating ductal carcinomas, 10 cases of carcinoma metastatic to lymph node, and 10 cases of normal mammary tissues. These sections were collected from patients ages 28–80. We found that the GCS protein levels in breast carcinoma and carcinoma metastatic to lymph node were significantly greater than normal tissues (0.0453±0.0265 vs. 0.0276±0.0154 RFU; 0.0415±0.0361 vs. 0.0276±0.0154 RFU) (Fig. 2A). Among the cases that overexpressed GCS (> mean ± 2SD of normal), 8 out of 10 breast carcinomas were metastatic. Furthermore, we tested the association of GCS and HER2. It was found that GCS expression was associated with HER2 in ER-negative cancers (γ2 = 0.84), rather than ER-positive cancer (γ2 = 0.64). Among the metastatic carcinoma cases, 9 of 25 overexpressed GCS and 6 of 25 overexpressed HER2 (> 0.295, mean ± 2SD of normal), and 5 of 25 coincidently overexpressed GCS and HER2 (Fig. 2B). These results confirmed that GCS overexpression is highly associated with metastatic breast cancer.
Figure 2.

GCS and HER2 expression in breast cancers. (A) GCS protein levels in breast carcinoma, metastasis to lymph node (LN-Met), and normal tissues. GCS protein was normalized against PI (propidium iodide) and plotted in each group. The solid bar (-) represents mean for each group; the dotted line (--) represents GCS overexpression (> mean ± 2SD of normal). (B) GCS and HER2 protein expression in ER-negative breast cancer. Normalized levels of GCS and HER2 (relative fluorescence unit, RFU) for each ER-negative infiltrated ductal carcinoma case were plotted (N=22). The dotted line (--) represents the value of mean ± 2SD of GCS (0.027±0.005) or HER2 (0.194±0.049) in the normal group.
GCS overexpression is associated with the progression of breast carcinoma
To confirm the association of GCS with metastatic breast cancer, we further employed quantitative RT-PCR to assess GCS expression in patient specimens. As shown in Fig. 3A and B, GCS mRNA levels in specimens of breast cancer were higher than in normal mammary tissues (504±396 vs. 93±107 copies; p=0.03). GCS mRNA levels were elevated in specimens of fibroadenoma (155±145 vs. 93±107; p=0.39) and primary tumors (210±167 vs. 93±107 copies; p=0.28), compared to normal (Fig. 4A); however, these differences were not significant (Fig. 4A). GCS was overexpressed (> mean ± 2SD of normal) in 4 of 6 metastatic subjects and 2 of 6 nonmetastatic subjects, respectively. This difference was also detected by immunostaining of GCS in specimens and representative images are shown in Fig. 4B. Furthermore, we analyzed GCS expression in specimens from patients with Stage I–III cancer. As summarized in Table I, GCS levels in Stage III were significantly higher than Stage I or Stage II, and 5 of 7 cases in Stage III overexpressed GCS. In the lymph node-positive (LN-positive) group, GCS level were 3-fold (408±37 vs. 138±12 copies) greater than LN-negative; 88% of LN-positive (7/8 cases) demonstrated GCS overexpression compared with 25% (2/8 cases) in LN-negative. GCS levels in the ER-positive group were dramatically elevated and 7-fold (367±38 vs. 49±8 copies) greater than in ER-negative. GCS was overexpressed in 78% (7/9 cases) of ER-positive tumors, but was not overexpressed in the ER-negative group.
Figure 3.

GCS expression in tumors. (A) GCS quantitative RT-PCR. Plasmid GCS cDNA was used as standard to quantitative GCS mRNA expression in specimens. NTC, distilled water was used as non-template control; Pt, patient; N, normal breast tissue; T, tumor. (B) GCS mRNA in patient specimens. RT-PCR products were resolved on 1% agarose gel and stained with ethidium bromide. β-actin was used as endogenous control.
Figure 4.
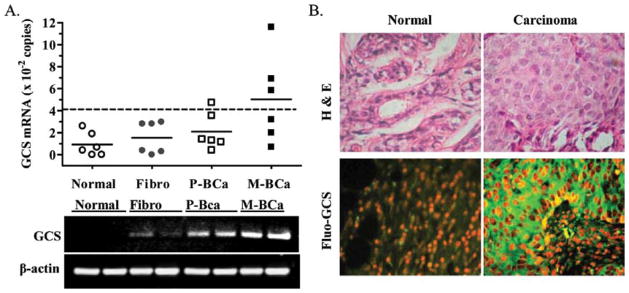
GCS expression and metastasis. (A) GCS expression in breast tissues from patients with disease. Fibro, fibroadenoma; P-BCa, primary breast cancer; M-BCa, metastatic breast cancer. The bar (–) represents mean in each group, from triplicate assays that were repeated at least two times; dotted line (--) represents GCS overexpression (> mean ± 2SD of normal). (B) GCS immunostaining in normal mammary tissue and breast adenocarcinoma.
Table I.
GCS expression in human breast cancer.
| Tumors | GCS mRNA levels (mean ± SD, copies) | Overexpressed/total cases (>307 copies) |
|---|---|---|
| Stage I | 243±56 | 1/3 |
| Stage II | 222±41 | 3/6 |
| Stage III | 325±48 | 5/7 |
| LN-negative | 138±12 | 2/8 |
| LN-positive | 408±37a | 7/8 |
| ER-negative | 49±8 | 0/7 |
| ER-positive | 367±38a | 7/9 |
The value of mean ± 2SD in normal breast tissues (307 copies) was used to evaluate the overexpression of GCS mRNA in specimens. LN, lymph node; ER, estrogen receptor.
p<0.001 compared with LN-negative or ER-negative.
Discussion
In the present study we profiled GCS expression in human tumors paired with normal tissues. The work demonstrates that GCS is characteristically overexpressed in metastatic breast carcinoma, disease that requires chemotherapy.
GCS overexpression is associated with cancer. Recent microarray studies from other groups indicate that GCS is a genetic signature for the progression and metastasis of renal cell cancer (30) and associated with lymphatic metastasis in penile carcinoma (31). GCS expression was shown to be associated with ER-positive breast cancer (32). GCS overexpression is associated with poor response to paclitaxel in breast cancer patients (33). In bladder cancers, GCS overexpression is associated with lymph node metastasis; the overall 5-year survival and disease-free survival rates are reduced to 74.79% (45.1 vs. 60.3 months) and 75.41% (27.3 vs. 36.2 months) in tumors with high levels of GCS (34). The status of GCS expression in other tumors compared with normal tissues is less understood. Here, we show that GCS was expressed at low levels in 19 tested human tissues, which is consistent with the role of GCS in ceramide homeostasis and glycosphingolipid synthesis (35). In most tissues, tumor GCS mRNA levels were not significantly higher than the normal, except in tumors of cervix, rectum, and breast (Fig. 1A and C). Interestingly, GCS levels were substantially elevated in metastatic breast cancer, as compared with nonmetastatic breast cancer (Fig. 1C). This finding has been confirmed with detection of GCS protein by breast cancer histo-array (Fig. 2A) and in tumor specimens (Fig. 4A and Table I).
GCS overexpression appears to be a characteristic of metastatic breast carcinoma. GCS overexpression (> normal mean ± 2SD) could be detected in most metastatic cases (approximately 54%; 9/25 cases in histo-array; 4/6 cases of Stage II, 5/7 cases of Stage III, and 7/8 cases of LN-positive). Although GCS overexpression was detected in approximately 25% of cases of non-metastatic breast carcinoma, it was not detected in benign fibroadenoma or normal breast tissues (Figs. 2A and 4A). Consistent with a previous microarray study (32), we found that GCS was overexpressed in ER-positive breast cancer (Table I). GCS expression was also highly associated HER2 in ER-negative breast carcinoma and possibly is more sensitive than HER2 in detection of metastases (Fig. 2B). GCS confers cancer cell resistance to anticancer drugs (9,20,21,26), and glucosylceramide, the product of GCS, is characteristically elevated in drug resistant cancers (29,36,37). These data strongly suggest that GCS overexpression could be a marker of drug resistance in breast cancer. This finding requires to be examined in large scale clinical samples of breast cancer treated with chemotherapy.
Ceramide glycosylation by GCS protects cancer cells from the challenges of chemotherapy. In addition to eliminating ceramide-induced cell death, elevated glycosphingolipids can activate the cSrc-β catenin pathway and upregulate MDR1 expression (26). Glycosphingolipids promote cancer metastasis via increased cell invasion, cell migration, matrix metallo-proteinases and vascular epithelial growth factor-induced angiogenesis (38–40). Inhibition of GCS by oligonucleotide, small interference RNA, and chemotherapy compounds can sensitize MDR cancer cells to anticancer drugs in tumor-bearing mice (9,25,26,41,42). Further investigation of GCS expression in metastatic cancers may define GCS is a therapeutic target to improve breast cancer treatment.
GCS expression was significantly and selectively elevated in breast cancer, in particular in metastatic disease. GCS overexpression was highly associated with ER-positive and HER2-positive metastatic breast cancer. Although a small study, these data suggest that GCS may be a prognostic indicator and potential target for the treatment of chemotherapy-refractory breast cancer.
Acknowledgments
This work was supported by United States Public Health Service/NIGMS grant GM77391 (M.C.C), United State Public Health Service/NIH grant P20 RR16456 from the NCRR (Y.Y.L), and Department of Defense Breast Cancer Research Program DAMD17-01-1-0536 (Y.Y.L.). This work was partially supported by the Associates for Breast and Prostate Cancer Studies (Los Angeles), and the Fashion Footwear Association of New York Charitable Foundation (FFANY).
Abbreviations
- ER
estrogen receptor
- GCS
glucosylceramide synthase
- HER2
epidermal growth factor receptor 2
- MDR
multidrug resistance
- MDR1
multidrug resistance gene
- OD
optical density
- RT-PCR
reverse transcription polymerase chain reaction
References
- 1.Gottesman MM, Fojo T, Bates SE. Multidrug resistance in cancer: role of ATP-dependent transporters. Nat Rev Cancer. 2002;2:48–58. doi: 10.1038/nrc706. [DOI] [PubMed] [Google Scholar]
- 2.Gonzalez-Angulo AM, Morales-Vasquez F, Hortobagyi GN. Overview of resistance to systemic therapy in patients with breast cancer. Adv Exp Med Biol. 2007;608:1–22. doi: 10.1007/978-0-387-74039-3_1. [DOI] [PubMed] [Google Scholar]
- 3.Moreno-Aspitia A, Perez EA. Anthracycline- and/or taxane-resistant breast cancer: results of a literature review to determine the clinical challenges and current treatment trends. Clin Ther. 2009;31:1619–1640. doi: 10.1016/j.clinthera.2009.08.005. [DOI] [PubMed] [Google Scholar]
- 4.SEER. [accessed 2009];Cancer Statistics Review, 1975–2006. http://seer.cancer.gov/csr/1975_2006.
- 5.Bradley G, Ling V. P-glycoprotein, multidrug resistance and tumor progression. Cancer Metastasis Rev. 1994;13:223–233. doi: 10.1007/BF00689638. [DOI] [PubMed] [Google Scholar]
- 6.Shabbits JA, Krishna R, Mayer LD. Molecular and pharmacological strategies to overcome multidrug resistance. Expert Rev Anticancer Ther. 2001;1:585–594. doi: 10.1586/14737140.1.4.585. [DOI] [PubMed] [Google Scholar]
- 7.Makin G, Dive C. Apoptosis and cancer chemotherapy. Trends Cell Biol. 2001;11:S22–S26. doi: 10.1016/s0962-8924(01)02124-9. [DOI] [PubMed] [Google Scholar]
- 8.Modok S, Mellor HR, Callaghan R. Modulation of multidrug resistance efflux pump activity to overcome chemoresistance in cancer. Curr Opin Pharmacol. 2006;6:350–354. doi: 10.1016/j.coph.2006.01.009. [DOI] [PubMed] [Google Scholar]
- 9.Liu YY, Han TY, Giuliano AE, Cabot MC. Ceramide glycosylation potentiates cellular multidrug resistance. FASEB J. 2001;15:719–730. doi: 10.1096/fj.00-0223com. [DOI] [PubMed] [Google Scholar]
- 10.Senchenkov A, Litvak DA, Cabot MC. Targeting ceramide metabolism - a strategy for overcoming drug resistance. J Natl Cancer Inst. 2001;93:347–357. doi: 10.1093/jnci/93.5.347. [DOI] [PubMed] [Google Scholar]
- 11.Reynolds CP, Maurer BJ, Kolesnick RN. Ceramide synthesis and metabolism as a target for cancer therapy. Cancer Lett. 2004;206:169–180. doi: 10.1016/j.canlet.2003.08.034. [DOI] [PubMed] [Google Scholar]
- 12.Ogretmen B, Hannun YA. Biologically active sphingolipids in cancer pathogenesis and treatment. Nat Rev Cancer. 2004;4:604–616. doi: 10.1038/nrc1411. [DOI] [PubMed] [Google Scholar]
- 13.Kok JW, Sietsma H. Sphingolipid metabolism enzymes as targets for anticancer therapy. Curr Drug Targets. 2004;5:375–382. doi: 10.2174/1389450043345452. [DOI] [PubMed] [Google Scholar]
- 14.Hannun YA. The sphingomyelin cycle and the second messenger function of ceramide. J Biol Chem. 1994;269:3125–3128. [PubMed] [Google Scholar]
- 15.Jeckel D, Karrenbauer A, Burger KN, van Meer G, Wieland F. Glucosylceramide is synthesized at the cytosolic surface of various Golgi subfractions. J Cell Biol. 1992;117:259–267. doi: 10.1083/jcb.117.2.259. [DOI] [PMC free article] [PubMed] [Google Scholar]
- 16.Kolesnick R, Hannun YA. Ceramide and apoptosis. Trends Biochem Sci. 24:224–225. doi: 10.1016/s0968-0004(99)01408-5. author reply 227, 1999. [DOI] [PubMed] [Google Scholar]
- 17.Ogretmen B, Hannun YA. Updates on functions of ceramide in chemotherapy-induced cell death and in multidrug resistance. Drug Resist Updat. 2001;4:368–377. doi: 10.1054/drup.2001.0225. [DOI] [PubMed] [Google Scholar]
- 18.Kolesnick R, Fuks Z. Radiation and ceramide-induced apoptosis. Oncogene. 2003;22:5897–5906. doi: 10.1038/sj.onc.1206702. [DOI] [PubMed] [Google Scholar]
- 19.Kolesnick R, Altieri D, Fuks Z. A CERTain role for ceramide in taxane-induced cell death. Cancer Cell. 2007;11:473–475. doi: 10.1016/j.ccr.2007.05.003. [DOI] [PubMed] [Google Scholar]
- 20.Liu YY, Han TY, Giuliano AE, Cabot MC. Expression of glucosyl-ceramide synthase, converting ceramide to glucosylceramide, confers adriamycin resistance in human breast cancer cells. J Biol Chem. 1999;274:1140–1146. doi: 10.1074/jbc.274.2.1140. [DOI] [PubMed] [Google Scholar]
- 21.Ogretmen B, Schady D, Usta J, et al. Role of ceramide in mediating the inhibition of telomerase activity in A549 human lung adenocarcinoma cells. J Biol Chem. 2001;276:24901–24910. doi: 10.1074/jbc.M100314200. [DOI] [PubMed] [Google Scholar]
- 22.Liu YY, Han TY, Giuliano AE, Ichikawa S, Hirabayashi Y, Cabot MC. Glycosylation of ceramide potentiates cellular resistance to tumor necrosis factor-alpha-induced apoptosis. Exp Cell Res. 1999;252:464–470. doi: 10.1006/excr.1999.4649. [DOI] [PubMed] [Google Scholar]
- 23.Gouaze V, Yu JY, Bleicher RJ, et al. Overexpression of glucosylceramide synthase and P-glycoprotein in cancer cells selected for resistance to natural product chemotherapy. Mol Cancer Ther. 2004;3:633–639. [PubMed] [Google Scholar]
- 24.Liu YY, Yu JY, Yin D, et al. A role for ceramide in driving cancer cell resistance to doxorubicin. FASEB J. 2008;22:2541–2551. doi: 10.1096/fj.07-092981. [DOI] [PubMed] [Google Scholar]
- 25.Patwardhan GA, Zhang QJ, Yin D, et al. A new mixed-backbone oligonucleotide against glucosylceramide synthase sensitizes multidrug-resistant tumors to apoptosis. PLoS One. 2009;4:e6938. doi: 10.1371/journal.pone.0006938. [DOI] [PMC free article] [PubMed] [Google Scholar]
- 26.Liu YY, Gupta V, Patwardhan GA, et al. Glucosylceramide synthase upregulates MDR1 expression in the regulation of cancer drug resistance through cSrc and beta-catenin signaling. Mol Cancer. 2010;9:145. doi: 10.1186/1476-4598-9-145. [DOI] [PMC free article] [PubMed] [Google Scholar]
- 27.Liu YY, Patwardhan GA, Bhinge K, Gupta V, Gu X, Jazwinski SM. Suppression of glucosylceramide synthase restores p53-dependent apoptosis in mutant p53 cancer cells. Cancer Res. 2011;71:2276–2285. doi: 10.1158/0008-5472.CAN-10-3107. [DOI] [PMC free article] [PubMed] [Google Scholar]
- 28.Itoh M, Kitano T, Watanabe M, et al. Possible role of ceramide as an indicator of chemoresistance: decrease of the ceramide content via activation of glucosylceramide synthase and sphingomyelin synthase in chemoresistant leukemia. Clin Cancer Res. 2003;9:415–423. [PubMed] [Google Scholar]
- 29.Xie P, Shen YF, Shi YP, et al. Overexpression of glucosylceramide synthase in associated with multidrug resistance of leukemia cells. Leuk Res. 2008;32:475–480. doi: 10.1016/j.leukres.2007.07.006. [DOI] [PubMed] [Google Scholar]
- 30.Jones J, Otu H, Spentzos D, et al. Gene signatures of progression and metastasis in renal cell cancer. Clin Cancer Res. 2005;11:5730–5739. doi: 10.1158/1078-0432.CCR-04-2225. [DOI] [PubMed] [Google Scholar]
- 31.Kroon BK, Leijte JA, van Boven H, et al. Microarray gene-expression profiling to predict lymph node metastasis in penile carcinoma. BJU Int. 2008;102:510–515. doi: 10.1111/j.1464-410X.2008.07697.x. [DOI] [PubMed] [Google Scholar]
- 32.Ruckhaberle E, Karn T, Hanker L, et al. Prognostic relevance of glucosylceramide synthase (GCS) expression in breast cancer. J Cancer Res Clin Oncol. 2009;135:81–90. doi: 10.1007/s00432-008-0436-9. [DOI] [PMC free article] [PubMed] [Google Scholar]
- 33.Juul N, Szallasi Z, Eklund AC, et al. Assessment of an RNA interference screen-derived mitotic and ceramide pathway metagene as a predictor of response to neoadjuvant paclitaxel for primary triple-negative breast cancer: a retrospective analysis of five clinical trials. Lancet Oncol. 2010;11:358–365. doi: 10.1016/S1470-2045(10)70018-8. [DOI] [PubMed] [Google Scholar]
- 34.Sun CC, Zhang Z, Zhang SY, Li J, Li ZL, Kong CZ. Up-regulation of glucosylceramide synthase in urinary bladder neoplasms. Urol Oncol. doi: 10.1016/j.urolonc.2010.04.012. (In press) [DOI] [PubMed] [Google Scholar]
- 35.Hannun YA, Obeid LM. Principles of bioactive lipid signalling: lessons from sphingolipids. Nat Rev Mol Cell Biol. 2008;9:139–150. doi: 10.1038/nrm2329. [DOI] [PubMed] [Google Scholar]
- 36.Lucci A, Cho WI, Han TY, Giuliano AE, Morton DL, Cabot MC. Glucosylceramide: a marker for multiple-drug resistant cancers. Anticancer Res. 1998;18:475–480. [PubMed] [Google Scholar]
- 37.Lavie Y, Cao H, Bursten SL, Giuliano AE, Cabot MC. Accumulation of glucosylceramides in multidrug-resistant cancer cells. J Biol Chem. 1996;271:19530–19536. doi: 10.1074/jbc.271.32.19530. [DOI] [PubMed] [Google Scholar]
- 38.Taki T, Ishikawa D, Ogura M, Nakajima M, Handa S. Ganglioside GD1alpha functions in the adhesion of metastatic tumor cells to endothelial cells of the target tissue. Cancer Res. 1997;57:1882–1888. [PubMed] [Google Scholar]
- 39.Kovbasnjuk O, Mourtazina R, Baibakov B, et al. The glycosphingo-lipid globotriaosylceramide in the metastatic transformation of colon cancer. Proc Natl Acad Sci USA. 2005;102:19087–19092. doi: 10.1073/pnas.0506474102. [DOI] [PMC free article] [PubMed] [Google Scholar]
- 40.Kolmakova A, Rajesh M, Zang D, Pili R, Chatterjee S. VEGF recruits lactosylceramide to induce endothelial cell adhesion molecule expression and angiogenesis in vitro and in vivo. Glycoconj J. 2009;26:547–558. doi: 10.1007/s10719-008-9206-9. [DOI] [PubMed] [Google Scholar]
- 41.Patwardhan G, Gupta V, Huang J, Gu X, Liu YY. Direct assessment of P-glycoprotein efflux to determine tumor response to chemotherapy. Biochem Pharmacol. 2010;80:72–79. doi: 10.1016/j.bcp.2010.03.010. [DOI] [PMC free article] [PubMed] [Google Scholar]
- 42.Zhang X, Li J, Qiu Z, Gao P, Wu X, Zhou G. Co-suppression of MDR1 (multidrug resistance 1) and GCS (glucosylceramide synthase) restores sensitivity to multidrug resistance breast cancer cells by RNA interference (RNAi) Cancer Biol Ther. 2009;8:1117–1121. doi: 10.4161/cbt.8.12.8374. [DOI] [PubMed] [Google Scholar]