

Abstract
Near-infrared spectroscopy (NIRS)-derived measurement of oxidized cytochrome c oxidase concentration ([oxCCO]) has been used as an assessment of the adequacy of cerebral oxygen delivery. We report a case in which a reduction in conscious level was associated with a reduction in [oxCCO]. Hypoxaemia was induced in a 31-year-old, healthy male subject as part of an ongoing clinical study. Midway through the hypoxaemic challenge, the subject experienced an unexpected vasovagal event with bradycardia, hypotension and reduced cerebral blood flow (middle cerebral artery blood flow velocity decrease from 70 to 30 cm s−1) that induced a brief reduction in conscious level. An associated decrease in [oxCCO] was observed at 35 mm (−1.6 μM) but only minimal change (−0.1 μM) at 20-mm source-detector separation. A change in optical scattering was observed, but path length remained unchanged. This unexpected physiological event provides an unusual example of a severe reduction in cerebral oxygen delivery and is the first report correlating change in clinical status with changes in [oxCCO].
Keywords: Conscious Level, Moderate Hypoxia, Artery Flow Velocity, Discrete Wavelength, Middle Cerebral Artery Blood Flow
Introduction
Cytochrome c oxidase is the final electron acceptor in the mitochondrial electron transport chain, and its oxidation state, measured by NIRS as [oxCCO], has thus been proposed as a marker of the adequacy of cerebral oxygen delivery (DO2) [1]. However, prior studies of moderate hypoxia achieved only modest reductions in DO2, leaving the relationship between DO2 and ∆[oxCCO] unclear [2]. Furthermore, interpretation of [oxCCO] measurements is difficult as there are no adult human data regarding its total concentration or resting oxidation state.
We aimed to address some of these concerns with studies using a hybrid NIR spectrometer, the pHOS, to measure [oxCCO] and other optical parameters whilst modulating DO2 in a cohort of healthy volunteers [3]. We report the case of a vasovagal event that occurred during one such study and explore the insights into cerebral physiology gleaned from this unexpected event.
Methods
A single case was selected from a larger group study. This study was approved by the Institutional Research Ethics Committee, and written informed consent was provided by the subject, a 31-year-old male who had been screened for pre-existing medical conditions, was selected as he suffered from vasovagal pre-syncope during a challenge that comprised induction of isocapnic hypoxia with a target arterial oxygen saturation (SpO2) of 80 % [3].
The pHOS, described in more detail elsewhere [4], combines frequency domain (FD) and broadband (BB) components. Changes in chromophore concentration were estimated by using the changes in light attenuation as measured by the BB spectrometer, using the UCLn algorithm to resolve for three chromophores – oxyhaemoglobin (HbO2), deoxyhaemoglobin (HHb) and oxCCO – between 780 and 900 nm. A fixed differential path length factor (DPF) of 6.26 [5] was used to enable comparison with previous studies. The FD component measured the absolute absorption and scattering coefficients (μa and μs, respectively) at discrete wavelengths 690, 750, 790 and 850 nm, allowing the estimation of DPF at each of these wavelengths using the diffusion approximation [6]. The pHOS optode was placed over the FP1 point on the right side of the forehead.
Other monitoring included beat-to-beat SpO2, continuous non-invasive arterial blood pressure, and transcranial Doppler (TCD) ultrasonography was used to measure middle cerebral artery flow velocity (Vmca), insonating through the right temporal window, ipsilateral to pHOS monitoring. Estimated relative cerebral oxygen delivery (ecDO2) was calculated as the product of changes in SpO2 and Vmca (relative to their initial values) [2]. Synchronization between the pHOS and other monitors was performed by means of a signal voltage output by the frequency domain spectrometer for the length of recording; all data were resampled to a sample period of 3.2 s across the length of recording. Twenty-second data windows were selected for the reporting of summary data. Changes in hemoglobin species concentration are expressed as total hemoglobin (∆[HbT] = ∆[HbO2] + ∆[HHb]) and hemoglobin difference (∆[HbDiff] = ∆[HbO2] − ∆[HHb]). All analysis was carried out in Matlab® 2011b.
Results
Approximately 600 s after the commencement of recording, during the nadir of hypoxia, the subject suffered from sudden-onset bradycardia and hypotension (a typical vasovagal episode), resulting in a reduction in ecDO2 to 41.5 % of baseline values (Table 4.1 and Fig. 4.1). During this time, the subject became briefly unresponsive. When this occurred, he was laid flat and the breathing circuit replaced with a Mapleson C circuit delivering high-flow oxygen.
Table 4.1.
Mean values of systemic and cerebral physiological parameters observed during four observed phases
| Baseline | Hypoxia | Hypoxia-ischemia | Recovery | ||
|---|---|---|---|---|---|
| ABP (mmHg) | 85.4 | 88.9 | 32.1 | 83.5 | |
| HR | 78.0 | 117 | 41.3 | 101 | |
| Vmca (cm s −1 ) | 70.4 | 73.9 | 34.1 | 57.8 | |
| SpO 2 (%) | 100 | 72.6 | 86.3 | 99.4 | |
| ecDO 2 (%) | 99.8 | 75.8 | 41.5 | 81.2 | |
| ∆[oxCCO] (μM) | 3.5 cm | 0 | −0.74 | −1.56 | −0.13 |
| 3.0 cm | 0 | −0.38 | −0.62 | 0.008 | |
| 2.5 cm | 0 | −0.30 | −0.55 | 0.045 | |
| 2.0 cm | 0 | −0.14 | −0.16 | 0.23 | |
Fig. 4.1.
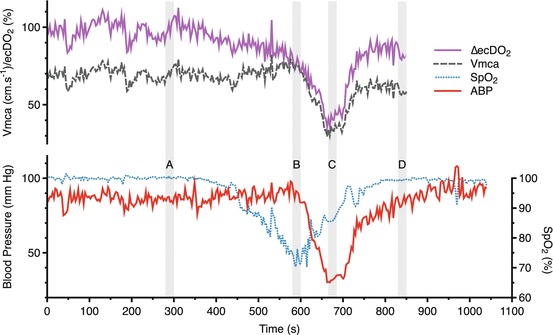
Changes in systemic and physiological parameters. Data averaging periods A baseline, B hypoxia, C hypoxia-ischemia, D recovery
Hemoglobin species showed a consistent pattern of change with a decrease in both [HbT] and [HbDiff] seen at all source-detector separations (Fig. 4.2). By contrast, [oxCCO] showed a source-detector separation-dependent decrease (∆[oxCCO] −1.6 μM at 3.5 cm c.f. −0.1 μM at 2.0-cm source-detector separation), with larger decreases seen at further source-detector separations (Fig. 4.3). Comparison of ∆[oxCCO] (observed at the 3.5-cm detector) with ∆ecDO2 suggests a linear relationship (Fig. 4.4) between the two variables (r 2 = 0.81, p < 0.001). There appeared to be a roughly 10 % decrease in the μs observed at all four discrete wavelengths, but this did not translate into an apparent change in DPF (Fig. 4.5).
Fig. 4.2.
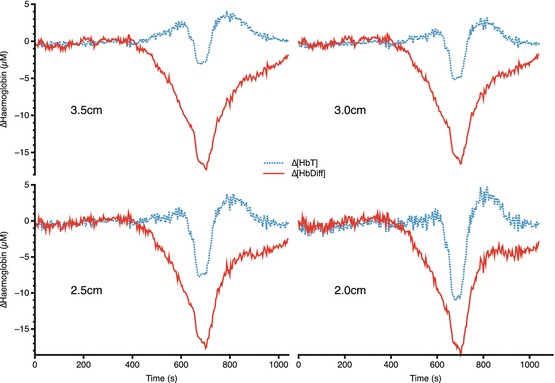
Changes in hemoglobin concentrations at four source-detector separations
Fig. 4.3.
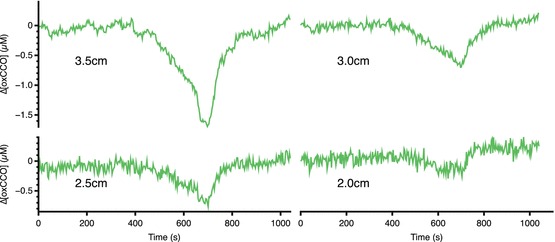
Changes in [oxCCO] at four source-detector separations
Fig. 4.4.
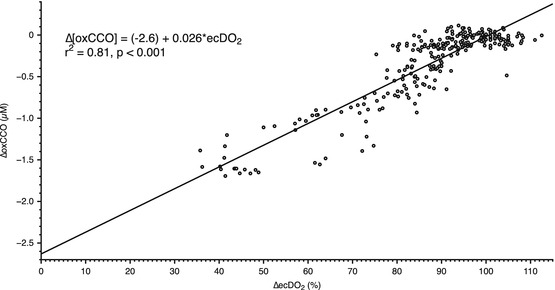
Relationship between ecDO2 and ∆[oxCCO] at 3.5 cm source-detector separation
Fig. 4.5.
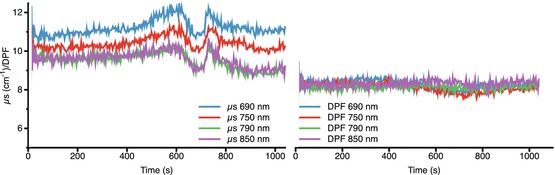
Changes in μs and DPF
Discussion
We report a reduction in cranial [oxCCO] measured with the pHOS during a vasovagal pre-syncope in a healthy adult volunteer. This reduction was larger in further (3.5 cm) than closer (2.0 cm) source-detector separations. The pattern of [oxCCO] reduction has been related to neurological outcome following cardiopulmonary bypass [7], and asymptomatic reductions in [oxCCO] have been reported during moderate hypoxia [2], but this is the first change in [oxCCO] to be correlated to changes in conscious level and the largest change to be reported in humans.
Whilst hypoxia is a recognized cause of syncope, the occurrence of bradycardia and hypotension indicates a vasovagal etiology [8], in this case, provoked by – as the subject reported – the shock of seeing his reduced SpO2 reading. This vasovagal response resulted in a profound reduction in cerebral blood flow (observed by both NIRS and TCD), and this led to a significant reduction in DO2.
Prior experiments have achieved only modest reductions in DO2, leaving questions unanswered about the relationship between DO2 and ∆[oxCCO] [2]. In particular, it was unclear whether the relationship between DO2 and ∆[oxCCO] was linear or whether there was a DO2 threshold below which rapid CCO reduction occurs. However, our data (Fig. 4.4) suggest a linear relationship between ∆[oxCCO] and ∆ecDO2 (r 2 = 0.81, p < 0.001). From this, the extrapolated value of ∆[oxCCO] of −2.6 μM with zero cerebral oxygen delivery is suggestive of a resting oxidized CCO concentration of around 2.6 μM. Although no reduction of this size has been reported in humans – understandably as a reduction in DO2 to nothing is impractical in humans – these values are consistent with animal anoxia models [9, 10].
Given the distance dependence of the [oxCCO] but not hemoglobin changes, we consider spectral crosstalk to be unlikely. Similarly, the modest μs changes that were observed appeared consistent in their spectral expression across 690–850 nm and thus are unlikely to account for the [oxCCO] changes seen. DPF showed no significant qualitative change during the hypoxic or ischaemic phases of the study, although the absolute values were larger than those that were previously reported [5]; using the measured values of DPF rather than the fixed value of 6.26 would thus change the magnitude, but not the qualitative profile of our observed chromophore changes.
Whilst we are aware of the limitations of extrapolating from a single case report, these data, especially when considered in conjunction with the results of the larger cohort of (uncomplicated!) hypoxia and hypercapnia studies [3], further underline confidence in the ability to use NIRS to measure [oxCCO] as a marker of cellular energy status.
Acknowledgments
This work was undertaken at University College London Hospitals and partially funded by the Department of Health’s National Institute for Health Research Centers funding scheme, the Medical Research Council and Wellcome Trust.
Footnotes
The original version of this chapter was revised. An erratum to this chapter can be found at https://doi.org/10.1007/978-1-4614-7411-1_63
References
- 1.Smith M, Elwell C. Near-infrared spectroscopy: shedding light on the injured brain. Anesth Analg. 2009;108(4):1055–1057. doi: 10.1213/ane.0b013e31819a0301. [DOI] [PubMed] [Google Scholar]
- 2.Tisdall MM, Tachtsidis I, Leung TS, Elwell CE, Smith M. Near-infrared spectroscopic quantification of changes in the concentration of oxidized cytochrome c oxidase in the healthy human brain during hypoxemia. J Biomed Opt. 2007;12(2):024002. doi: 10.1117/1.2718541. [DOI] [PubMed] [Google Scholar]
- 3.Kolyva Christina, Ghosh Arnab, Tachtsidis Ilias, Highton David, Smith Martin, Elwell Clare E. Oxygen Transport to Tissue XXXV. New York, NY: Springer New York; 2013. Dependence on NIRS Source-Detector Spacing of Cytochrome c Oxidase Response to Hypoxia and Hypercapnia in the Adult Brain; pp. 353–359. [DOI] [PMC free article] [PubMed] [Google Scholar]
- 4.Kolyva C, Tachtsidis I, Ghosh A, et al. Systematic investigation of changes in oxidized cerebral cytochrome c oxidase concentration during frontal lobe activation in healthy adults. Biomed Opt Express. 2012;3(10):2550–2566. doi: 10.1364/BOE.3.002550. [DOI] [PMC free article] [PubMed] [Google Scholar]
- 5.Duncan A, Meek JH, Clemence M, et al. Optical pathlength measurements on adult head, calf and forearm and the head of the newborn infant using phase resolved optical spectroscopy. Phys Med Biol. 1995;40(2):295–304. doi: 10.1088/0031-9155/40/2/007. [DOI] [PubMed] [Google Scholar]
- 6.Arridge SR, Cope M, Delpy DT. The theoretical basis for the determination of optical pathlengths in tissue: temporal and frequency analysis. Phys Med Biol. 1992;37(7):1531–1560. doi: 10.1088/0031-9155/37/7/005. [DOI] [PubMed] [Google Scholar]
- 7.Kakihana Y, Matsunaga A, Yasuda T, Imabayashi T, Kanmura Y, Tamura M. Brain oxymetry in the operating room: current status and future directions with particular regard to cytochrome oxidase. J Biomed Opt. 2008;13(3):033001. doi: 10.1117/1.2940583. [DOI] [PubMed] [Google Scholar]
- 8.Chen-Scarabelli C, Scarabelli TM. Neurocardiogenic syncope. Br Med J. 2004;329(7461):336–341. doi: 10.1136/bmj.329.7461.336. [DOI] [PMC free article] [PubMed] [Google Scholar]
- 9.Cooper CE, Cope M, Springett R, et al. Use of mitochondrial inhibitors to demonstrate that cytochrome oxidase near-infrared spectroscopy can measure mitochondrial dysfunction noninvasively in the brain. J Cereb Blood Flow Metab. 1999;19(1):27–38. doi: 10.1097/00004647-199901000-00003. [DOI] [PubMed] [Google Scholar]
- 10.Cooper CE, Springett R. Measurement of cytochrome oxidase and mitochondrial energetics by near-infrared spectroscopy. Philos Trans R Soc Lond B Biol Sci. 1997;352(1354):669–676. doi: 10.1098/rstb.1997.0048. [DOI] [PMC free article] [PubMed] [Google Scholar]