Abstract
Extracorporeal membrane oxygenation (ECMO) is a rescue therapy for patients with cardio-respiratory failure which exposes the patient to the risk for intracranial injury. We used a 12-channel optical topography system to monitor cerebral oxygenation in a venoarterial (VA) ECMO patient during alterations in the ECMO flows. Changes in oxy-(HbO2), deoxy-(HHb) and total-(HbT) haemoglobin concentrations were measured simultaneously with systemic and ECMO circuit parameters. Decreasing the flows resulted in a decrease in venous (SvO2) and arterial (SpO2) saturations. These were reflected in the haemoglobin data by a significant increase in HHb of varying magnitude across the 12 channels and moderate changes in HbO2 suggestive of cerebral arterial dilation to compensate for the lack of oxygen delivery. In the patient studied here ECMO flows appear to present a significant haemodynamic challenge to cerebral circulation.
1. Introduction
Extracorporeal membrane oxygenation (ECMO) is a life support system incorporating cardiopulmonary bypass in infants and children with intractable cardio-respiratory failure. Establishing ECMO involves cannulation of major vessels in the neck–right common carotid artery (RCCA) and internal jugular vein (IJV). Maintaining and weaning from ECMO requires manipulation of ECMO flows, which can affect cerebral blood flow and potentially lead to neurologic complications. Reports show that about 28–52% of ECMO survivors show abnormal neuro-imaging related both to pre-ECMO events and to the ECMO procedure itself [1].
Near infrared spectroscopy (NIRS) has the advantage of monitoring cerebral oxygenation non-invasively and continuously by the bedside. NIRS was used on ECMO patients to study the effect of cannulation on cerebral oxygenation. Ligation of RCCA was associated with a decrease in HbO2, an increase in HHb [2] and a decrease in tissue oxygen saturation (TOS) [3] while no changes were seen during IJV ligation. Also, an increase in HbO2, a decrease in HHb and an increase in TOS was reported after ECMO was established compared to pre-cannulation values. In a previous study we used spectral analysis on HbO2 and identified vasomotion, respiratory, cardiac and ECMO circuit roller pump oscillations in cerebral and peripheral circulation during ECMO flow changes [4]. To date, conventional NIRS uses single or dual channel systems with the optodes usually placed on the forehead of the patients providing information related to perfusion of only a small area of the anterior cerebrum and therefore do not allow evaluation of the status of the cerebral circulation and oxygenation in the extended cerebral regions.
The aim of this study is to use optical topography (OT) to monitor multisite brain oxygenation responses during manipulations in the ECMO circuit flows.
2. Methods
In this pilot study OT data were obtained from a one-month-old veno-arterial (VA) ECMO patient undergoing changes in the ECMO circuit flows. Flow in the ECMO circuit was successively decreased by 10% from initial flow every 10–15 minutes, down to 70% of the initial flow and it was then gradually brought back to initial flow. During this procedure ETG-100 OT system (Hitachi Medical Ltd.) was used to measure changes in HbO2, HHb and HbT (HbO2 + HHb) haemoglobin concentrations using the modified Beer-Lambert Law. A novel neonatal cap was designed and constructed to accommodate the optical fibres in a 3×3 array (inter-optode distance = 3cm) utilizing spring-loaded optical fibre holders. The probe array was positioned on the patient’s head with the middle optode corresponding to Cz of the 10–20 EEG electrode placement system [5]. This optode configuration allows for optical data to be collected from 12 channels distributed symmetrically around Cz and covering an area of 6×6 cm2. Optical data collected at a sampling frequency of 5Hz were resampled at 1Hz and low pass filtered at 0.05Hz to remove physiological noise. For the conversion of the optical attenuation changes to chromophore concentration changes a differential pathlength factor (DPF) of 4.99 was applied [6]. Multimodal data were collected synchronously with the optical data that included systemic parameters: arterial blood pressure (ABP), heart rate (HR), respiration rate (RR), end-tidal CO2, temperature and arterial saturation (SpO2); and ECMO circuit parameters: venous saturation (SvO2), arterial saturation measured at the arterial cannula side (SaO2), haematocrit and ECMO flow.
Changes in HbO2, HHb and HbT between phase I [from baseline flow (100%) to minimum flow (70%)] and phase II [from 70% flow back to baseline flow] were calculated from the differences in mean values over a 60-s period just before changing the flow. The results were analysed using a paired t-test (p<0.05).
3. Results
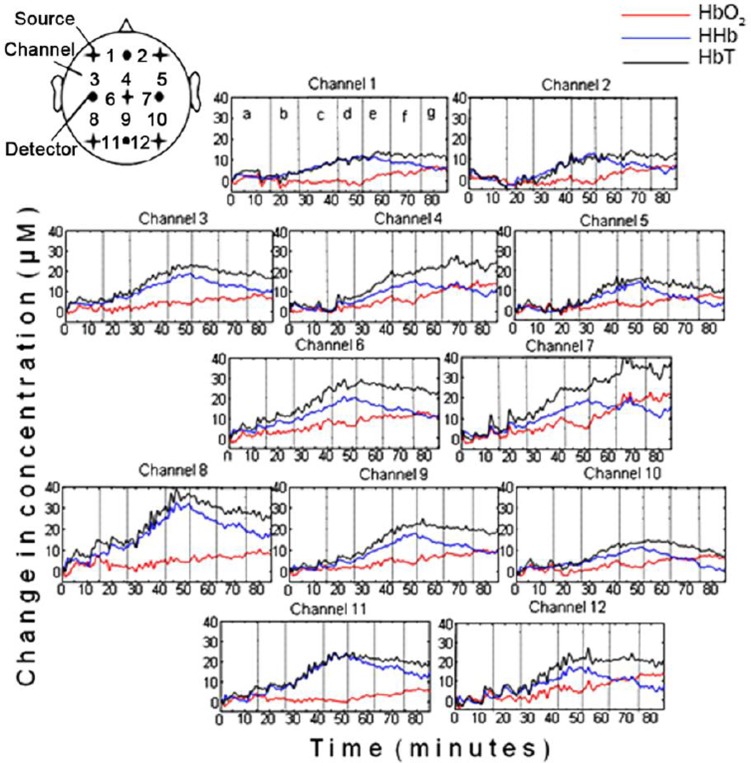
Figure 1 shows concentration changes in HbO2 (red), HHb (blue) and HbT (black) collected from the 12 channels during changes in ECMO flows. The channel configuration is shown by the schematic at the top left of the figure. As annotated in the haemoglobin plots of channel 1, the vertical dotted lines represent the time at which a change in flow was induced so that each section in the plots corresponds to a specific flow. Sequential reduction in ECMO flows resulted in considerable increase in HHb and HbT in all 12 channels, with moderate increases seen in HbO2. Table 1 lists the responses in HHb, HbO2 and HbT during phase I and phase II. The range in the change of HHb concentration during phase I was from 9.7µM (channel 8) to 25.1µM (channel 10). Regional variations in cerebral oxygenation can be seen, particularly interhemispheric differences, e.g. comparing channel 10 (right parietal lobe) with channel 8 (left parietal lobe).
Fig. 1. HbO2, HHb and HbT concentration changes from 12 channels during ECMO circuit flow changes.
Each vertical line in the figures denotes where the ECMO circuit flow change occurred as annotated on channel 1 [a=baseline (100% flow), b=90% flow, c=80% flow, d=70% flow, e=80% flow, f=90% flow, g=100% flow].
Table 1. Mean changes in HHb, HbO2 and HbT during phases I [between baseline flow (100%) and minimum flow (70%)] and II (between minimum flow and return to baseline).
| Channel | HHb (µM) | HbO2 (µM) | HbT (µM) | |||
|---|---|---|---|---|---|---|
| I | II | I | II | I | II | |
| 1 | 11.2 | −6.1 | −2.9 | 7.0 | 8.3 | 1.0 |
| 2 | 15.9 | −6.5 | −1.2 | 8.2 | 14.7 | 1.7 |
| 3 | 15.2 | −8.7 | 1.4 | 2.8 | 16.5 | −5.9 |
| 4 | 14.8 | −4.7 | 3.8 | 9.2 | 18.6 | 4.5 |
| 5 | 14.9 | −10.8 | −0.3 | 4.2 | 11.8 | −6.6 |
| 6 | 15.0 | −9.2 | 1.9 | 4.8 | 14.6 | −4.5 |
| 7 | 16.2 | −4.4 | 3.1 | 15.8 | 16.9 | 11.4 |
| 8 | 25.1 | −14.7 | −2.8 | 3.7 | 19.4 | −11.1 |
| 9 | 16.1 | −8.7 | 1.3 | 5.2 | 22.3 | −3.5 |
| 10 | 9.7 | −10.8 | −0.6 | 4.3 | 17.4 | −6.5 |
| 11 | 20.6 | −10.7 | −4.3 | 5.8 | 16.3 | −5.0 |
| 12 | 15.7 | −11.0 | 0.5 | 9.2 | 16.2 | −1.8 |
Note: Bold letters indicate that changes are statistically significant (p<0.05)
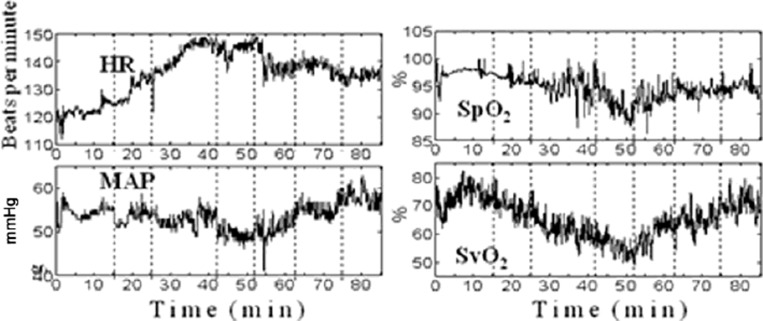
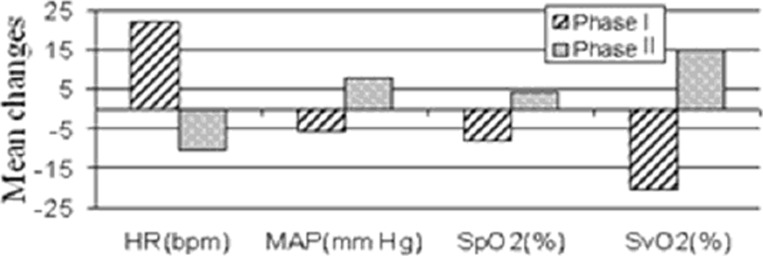
The variation in HR, MAP, SpO2 and SvO2 during flow changes are shown in Figure 2. Figure 3 shows the responses of these parameters during phase I and phase II. In this patient a decrease in ECMO flow is associated with a decrease in SvO2 and SpO2 and an increase in HR and MAP. The effect is reversed when the flow is gradually increased back to baseline. Similar to the haemoglobin concentration data, these systemic and ECMO circuit parameters do not return to their baseline values by the end of the monitoring period.
Fig. 2. HR, MAP, SpO2 and SvO2 during ECMO circuit flow changes.
Fig. 3. Mean changes in systemic and ECMO parameters during phases I and II.
4. Discussion
This single patient study showed significant changes in systemic oxygenation parameters and cerebral haemoglobin concentration in response to changes in ECMO flows. Reduction in flows was associated with a decrease in SvO2 and SpO2 and a significant increase in HHb but in the absence of a decrease in HbO2.
A decrease in ECMO flow is associated with a decrease in oxygen delivery especially in the early course of ECMO treatment when the heart and lungs have not fully recovered. If ECMO flow is inadequate, there is a reduction in SvO2 and a subsequent decrease in SpO2. Consequently, in an effort to increase cardiac out-put, there is a compensatory increase in HR. The decrease in SpO2 and SvO2 seen in this patient suggest that the lowering ECMO flows has a similar effect to a hypoxemic challenge and the absence of decrease in HbO2 in relation to increase in HHb could be explained by arterial dilation as a compensatory response to decreased blood flow due to decreased ECMO flows [7].
The changes seen in the total haemoglobin during this challenge in this patient are relatively large compared to the suggested total cerebral blood volume in an infant of 2.2mL/100g (50µM) [8]. Van Heijst et al. [2] report changes in HbO2 and HHb in the order of 1µmol/100g (10µM) 60 min after ECMO induction and suggest no interhemispheric differences. EIjike et al. [3] report no relationship between ECMO flow and tissue oxygen saturation but changes in the individual HbO2 and HHb parameters were not reported.
We noted significant differences between channel 10 and 8 which are difficult to explain and could be related to alterations in cerebral blood flow related to ligation of the RCCA and IJV; however, we need further data to support this. In addition, regional variations in cerebral oxygenation could be related both to the procedure itself and to inhomogeneous differential pathlength factor [9]. The changes associated with ECMO flows did not return to baseline as the flow changes were reversed in the time period of the study. This might have been seen if we had extended the duration of the monitoring which we plan to do with further studies.
5. Conclusions
Multichannel optical topography can provide information on regional cerebral haemodynamics and oxygenation in ECMO patients. Simultaneous measurement of systemic and cerebral parameters can be used to characterise the response to changes in ECMO flows. In the patient studied here ECMO flows appear to present a significant haemodynamic challenge to cerebral circulation. ECMO flow changes may have the potential to inform on cerebral autoregulation but further studies are required to more fully explore the relationship between regional variations in cerebral oxygenation during different ECMO phases.
Acknowledgment
This work is supported by Hitachi Medical Ltd.
References
- 1.Bulas D, Glass P. Neonatal ECMO: Neuroimaging and neurodevelopmental outcome. Seminars in Perinatology. 2005;29:58–65. doi: 10.1053/j.semperi.2005.02.009. [DOI] [PubMed] [Google Scholar]
- 2.Van Heijst A, Liem D, Hopman J, Van der Staak F, Sengers R. Oxygenation and hemodynamics in the left and right cerebral hemispheres during induction of veno-arterial extracorporeal membrane oxygenation. J Pediatr. 2004;144:223–228. doi: 10.1016/j.jpeds.2003.11.006. [DOI] [PubMed] [Google Scholar]
- 3.Ejike JC, Schenkeman KA, Seidel K, Ramamoothy C, Roberts JS. Cerebral oxygenation in neonatal and pediatric patients during veno-arterial extracorporeal life support. Pediatr Crit Care Med. 2006;7:154–158. doi: 10.1097/01.PCC.0000200969.65438.83. [DOI] [PubMed] [Google Scholar]
- 4.Papademetriou MD, Tachtsidis I, Leung TE, Elliott MJ, Hoskote A, Elwell CE. Cerebral and Peripheral tissue oxygenation in Infants and Children supported on ECMO for Cardio-Respiratory failure. Adv Exp Med Biol. 2010;662:447–453. doi: 10.1007/978-1-4419-1241-1_64. [DOI] [PMC free article] [PubMed] [Google Scholar]
- 5.Jasper H. Report to the committee on methods and clinical examination in Electroencephalography. Electroencephalogr Clin Neurophysiol. 1958;10:371–375. [Google Scholar]
- 6.Duncan A, Meek JH, Clemence M, Elwell CE, Tyszczuk L, Cope M, Delpy DT. Optical pathlength measurements on adults head, calf and forearm and the head of the newborn infant using phase resolved optical spectroscopy. Phys Med Biol. 1995;40:295–304. doi: 10.1088/0031-9155/40/2/007. [DOI] [PubMed] [Google Scholar]
- 7.Hurn PD, Traystman RJ. Changes in arterial gas tension. In: Edvinsson L, Krause DN, editors. Cerebral Blood Flow and Metabolism. Philadelphia: Lippincott Williams & Wilkins; 2002. pp. 384–394. [Google Scholar]
- 8.Wyatt JS, Cope M, Delpy DT, Richardson CE, Edwards AD, Wray S, Reynolds EOR. Quantitation of cerebral blood volume in human infants by near-infrared spectroscopy. J Appl Physiol. 1990;68:1086–1091. doi: 10.1152/jappl.1990.68.3.1086. [DOI] [PubMed] [Google Scholar]
- 9.Katagiri A, Dan I, Tuzuki D, Okamoto M, Yokose N, Igarashi K, Hoshino T, Fujiwara T, Katayama Y, Yamaguchi Y, Sakatani K. Mapping of the optical pathlength of human adult head at multi-wavelengths in near infrared spectroscopy. Adv Exp Med Biol. 2010;662:213. doi: 10.1007/978-1-4419-1241-1_29. [DOI] [PubMed] [Google Scholar]


