Abstract
Functional near-infrared optical topography (OT) is used to non-invasively measure the changes in oxygenated and deoxygenated haemoglobin (Δ[HbO2], Δ[HHb]) and hence investigate the brain haemodynamic changes, which occur in response to functional activation at specific regions of the cerebral cortex. However, when analysing functional OT data the task-related systemic changes should be taken into account. Here we used an independent component analysis (ICA) method on the OT [HbO2] signal, to determine the task related independent components and then compared them with the systemic measurements (blood pressure, heart rate, scalp blood flow) to assess whether the components are due to systemic noise or neuronal activation. This analysis can therefore extract the true OT haemodynamic neuronal response and hence discriminate between regional activated cortical areas and global haemodynamic changes.
1. Introduction
Functional optical topography (OT) uses near-infrared light to non-invasively measure the changes in oxygenated and deoxygenated haemoglobin (Δ[HbO2], Δ[HHb]) across multiple brain sites during brain neuronal activation. The OT functional haemodynamic changes should occur at specific locations that overlay the cortical activated areas and should be closely coupled to the task-related timing periods. This assumes that the functional haemodynamic task-related changes are occurring on top of an unchanged global systemic and brain resting state. However in certain functional OT experiments these assumptions are not accurate. Using two channels near-infrared spectroscopy (NIRS) Leung and colleagues found a relatively high correlation between Δ[HbO2] signals over the frontal cortex (FC) and motor cortex (MC) during finger tapping while also observing a significant increase in heart rate (HR)[1]. In a study in 2008, we have observed significant task related changes in mean blood pressure (MBP) and HR during anagram solving and in some volunteers the Δ[HbO2] and Δ[HHb] signals measured over the activated FC were correlated with the MBP signal [2]. In a subsequent study we have observed significant changes in the NIRS signals over the FC and a control area, the MC; we also observed task-related changes in MBP and scalp blood flow (scalp flux) that appear to contribute to the changes in the NIRS signals over both the activated and control regions of the cortex [3]. Finally recently in a study on 22 adult subjects using OT to produce maps of the haemodynamic response of both FC and MC during anagram solving, while simultaneously monitoring the systemic physiology (HR, MBP, scalp flux), we observed that during the task, half of the subjects demonstrated a significant change in at least one systemic variable and certain OT channels were highly correlated with these systemic changes [4]. These systemic changes are thus ‘global noise components’ and any analysis of functional OT signals must take this effect into account.
Recent work using independent component analysis (ICA) allowed extraction of the task-related independent components (TR-IC) from OT signals and separation of these signals into activation related and noise related components [5]. Here we use the same ICA methodology and expanded to assess whether the TR-ICs is due to systemic noise (TR-NIC) or neuronal activation (TR-AIC) by carrying out correlation analysis with measured systemic variables.
2. Methods
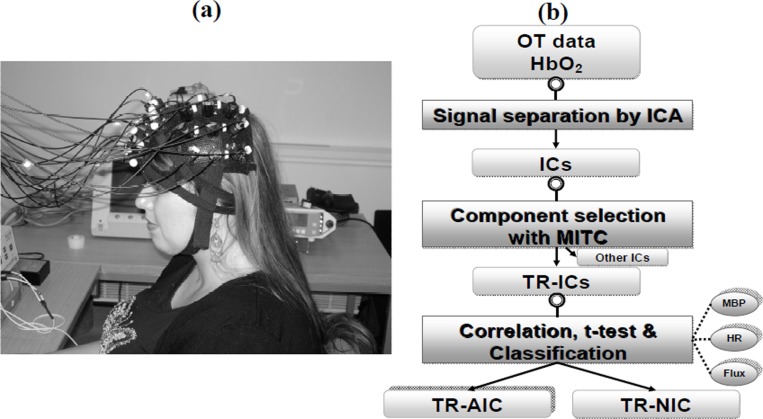
We studied a 20 year old right handed female, with English as her first language (this study was approved by the UCL Research Ethics Committee). NIRS measurements were conducted with the ETG-100 Optical Topography System (Hitachi Medical Co., Japan) using two 12-channel arrays. Each optode array consisted of 5 source optodes (each delivering light at 780 and 830 nm) and 4 detector optodes. The source-detector interoptode spacing was 30mm and data was acquired at 10Hz. The optodes were placed over the subject’s left frontal cortex and positioned according to the International 10-20 system of electrode placement such that channels 1-12 were centred approximately over the frontopolar region (Fp) and channels 13-24 were centred approximately over the left motor cortex (C3) (see Figure 1(a)). A Portapres® system (TNO Institute of Applied Physics) was used to continuously and non-invasively measure MBP and HR from the finger. A laser Doppler probe (FloLab, Moore Instruments) was placed over the forehead to monitor the changes in scalp blood flow (scalp flux).
Fig. 1. (a) Picture of a volunteer with the OT system showing channels 1-12 placed over the frontal lobe and channels 13-24 placed over the motor cortex. (b) Block diagram of analysis steps.
Data was recorded during 1 minute of the subject at rest (baseline), followed by 45 seconds of the subject solving anagrams (a mixture of 4-letter, 6-letter and 8-letter anagrams), followed by 30 seconds of rest, followed by 30 seconds of finger tapping. In this study solving an anagram was defined as producing one coherent word using only the letters from another word (e.g. kitchen – thicken). Each anagram-solving and finger-tapping period was repeated a total of eight times, with the study ending after a 60 second rest period (total study time 19.5 minutes). During this functional paradigm the participants were asked to be still and silent; and no response to anagram solving was requested.
Pre-processing of the OT signals and the ICA for the Δ[HbO2] signal were done with a software platform developed by Hitachi called Platform for Optical Topography Analysis Tools or POTATo (ver P3_UCL0810, Hitachi 2009). This involved a moving average with a period of 3s to filter the data followed by a polyfit difference function of 8 degrees to reduce the effect of low frequency noise. The method of ICA used is similar to that carried out by Katura and colleagues [5] and involves using principle component analysis (PCA) to reduce the noise in the data and reduce the number of components. Whether a component is used or discarded is determined by the component’s contribution to the total energy. In this analysis, the threshold for truncation was set at 99% such that components contributing less than 1% of the total energy were not used. The next step was using a ‘time-delayed decorrelation algorithm (TDD) to separate the different independent components[6,7,8]. The TDD was based on the assumption that the various components that make up the [HbO2] data are independent and if these components are independent of each other, their cross-correlations will be zero with any time delays; so any dependence is removed by the time delay. The time delay used in this procedure was between 0 and 15s with steps of 1.5s. To find the components of the signal that were due to the activation tasks or TR-ICs (see Fig. 1(b)) we selected them from the separated ICs based on mean inter-trial cross-correlation (MITC), which is a measure of reproducibility of a given IC over repeated trials, those that are equal or larger than 0.2. To assess whether the TR-IC is due to systemic noise or neuronal activation we carried out correlation analysis with the systemic measurements and a t-test between the baseline and activation period. The TR-AIC is identified as the TR-IC with the lowest correlation with the systemic variables and a positive significant (p<0.05) increase during the activation period.
3. Results
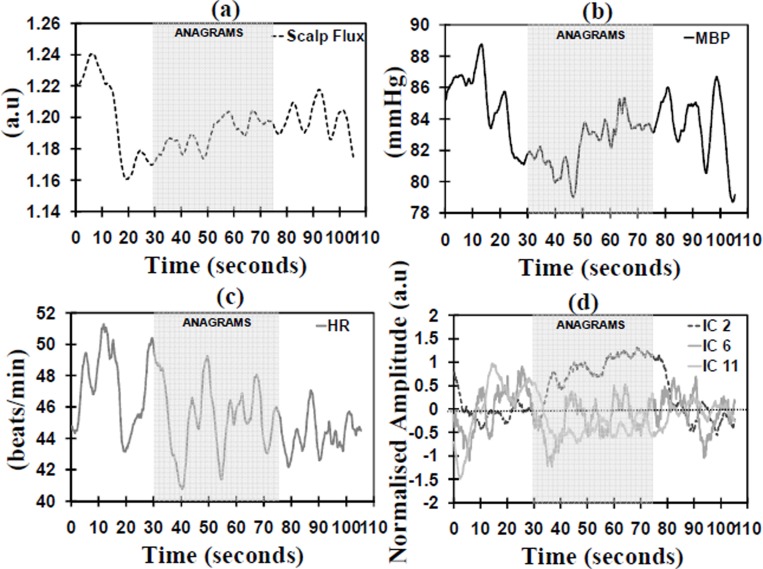
Figure 2 shows the MITC distribution and Table 1 shows the correlation coefficients between the systemic measurements and the ICs with MITC≥0.2 for both anagrams and finger tapping. During the anagram activation ICs 2, 6 and 11 had an MITC of 0.2 or higher (see Figure 3(d)). IC 2 was identified as the TR-AIC as it demonstrated a significant positive increase during the activation (p=0.008) and it was not correlated with any of the systemic variables. ICs 6 and 11 were identified as TR-NICs as they did not demonstrate a positive increase during activation and also IC 11 demonstrated a positive correlation with HR.
Fig. 2. Bar graphs show MITC distributions for [HbO2] for (a) anagrams and (b) finger tapping.
Table 1. Correlations values between systemic variables and ICs with MITC≥0.2 for †Anagrams and ☼ Finger Tapping.
| Anagrams |
Finger Tapping |
|||||
|---|---|---|---|---|---|---|
| ICs | Scalp Flux | MBP | HR | Scalp Flux | MBP | HR |
| 2† ☼ | −0.10 | −0.23 | −0.21 | 0.39 | 0.26 | 0.06 |
| 5☼ | −0.33 | −0.45 | 0.09 | −0.40 | −0.40 | −0.06 |
| 6† | −0.26 | 0.04 | 0.01 | −0.28 | 0.01 | −0.29 |
| 8☼ | −0.59 | −0.46 | −0.17 | −0.36 | −0.05 | −0.08 |
| 11† | −0.28 | 0.10 | 0.31 | −0.30 | −0.08 | −0.02 |
| 13☼ | −0.07 | −0.04 | −0.03 | −0.37 | −0.31 | −0.23 |
Fig. 3. Traces are the block averaged time courses during the anagram activation for the (a) scalp flux; (b) MBP; (c) HR; and (d) the independent components with MITC ≥ 0.2.
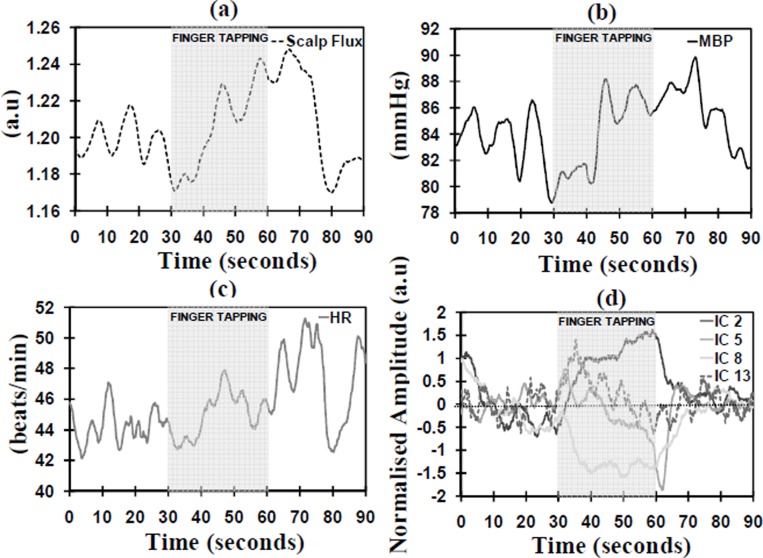
During the finger tapping activation ICs 2, 5, 8 and 13 had an MITC of 0.2 or higher (see Figure 4(d)). ICs 2 and 13 demonstrated a significant positive increase during the activation (p=0.038 and p=0.034); however IC 13 was identified as the TR-AIC as it was not positively correlated with any of the systemic variables. ICs 2, 5 and 8 were identified as TR-NICs; IC 2 was correlated with the scalp flux and ICs 5 and 8 did not demonstrate an increase during the finger tapping.
Fig. 4. Traces are the block averaged time courses during the finger tapping activation for the (a) scalp flux; (b) MBP; (c) HR; and (d) the independent components with MITC ≥ 0.2.
4. Discussion
It is often necessary when analysing functional OT signals to use appropriate methods and statistical tests that incorporate the systemic changes that can occur during brain activation. Here we describe a methodology based on ICA that allows identifying both the neuronal haemodynamic signal and the systemic interference in the functional OT data. This analysis can therefore extract the true OT haemodynamic neuronal response from the systemic haemodynamic changes and hence discriminate between regional activated cortical areas and global changes.
To account for the systemic physiological noise we have previously used Statistical Parametric Mapping (SPM) [4]; while others have used Principal Component Analysis [9,10] and Independent Component Analysis[5,8]. Now we detail an ICA based method for OT data that expands on previous work [5] by incorporating systemic measurements in the identification process of the TR-AIC. This method can be used both at the intra and inter subject level and can possible enhance the interpretation of the task related OT response.
Acknowledgments
The authors would like to thank the EPSRC (EP/D060982/1).
References
- 1.Leung TS, Elwell CE, Henty JR, et al. Simultaneous measurement of cerebral tissue oxygenation over the adult frontal and motor cortex during rest and functional activation. Adv.Exp.Med.Biol. 2003;510:385–389. doi: 10.1007/978-1-4615-0205-0_64. [DOI] [PubMed] [Google Scholar]
- 2.Tachtsidis I, Leung TS, Devoto L, et al. Measurement of frontal lobe functional activation and related systemic effects: a near-infrared spectroscopy investigation. Adv.Exp.Med.Biol. 2008;614:397–403. doi: 10.1007/978-0-387-74911-2_44. [DOI] [PubMed] [Google Scholar]
- 3.Tachtsidis I, Leung TS, Tisdall MM, et al. Investigation of frontal cortex, motor cortex and systemic haemodynamic changes during anagram solving. Adv.Exp.Med.Biol. 2008;614:21–28. doi: 10.1007/978-0-387-74911-2_3. [DOI] [PubMed] [Google Scholar]
- 4.Tachtsidis I, Leung TS, Chopra A, et al. False positives in functional near-infrared topography. Adv.Exp.Med.Biol. 2009;645:307–314. doi: 10.1007/978-0-387-85998-9_46. [DOI] [PubMed] [Google Scholar]
- 5.Katura T, Sato H, Fuchino Y, et al. Extracting task-related activation components from optical topography measurement using independent components analysis. J.Biomed.Opt. 2008;13:054008. doi: 10.1117/1.2981829. [DOI] [PubMed] [Google Scholar]
- 6.Cardoso JF, Souloumiac A. Jacobi angles for simultaneous diagonalization. SIAM J.Matrix Anal.Appl. 1996;17:161–164. [Google Scholar]
- 7.Ziehe A, Muller KR. Proc.ICANN98. Berlin: Springer; 1998. TDSEP an efficient algorithm for blind separation using time structure; pp. 675–680. [Google Scholar]
- 8.Hirosaka R, Katura T, Kawaguchi H, et al. Noisy time-delayed decorrelation and its application to extraction of neural activity from single optical recordings in guinea pigs. Physica D.: Nonlinear.Phenomena. 2004 Jul 15;194:320–332. [Google Scholar]
- 9.Huppert TJ, Diamond SG, Franceschini MA, et al. HomER: a review of time-series analysis methods for near-infrared spectroscopy of the brain. Appl.Opt. 2009 Apr 1;48:D280–D298. doi: 10.1364/ao.48.00d280. [DOI] [PMC free article] [PubMed] [Google Scholar]
- 10.Franceschini MA, Joseph DK, Huppert TJ, et al. Diffuse optical imaging of the whole head. J.Biomed.Opt. 2006;11:054007. doi: 10.1117/1.2363365. [DOI] [PMC free article] [PubMed] [Google Scholar]


