Abstract
Resolving for changes in concentration of tissue chromophores in the human adult brain with near-infrared spectroscopy has generally been based on the assumption that optical scattering and pathlength remain constant. We have used a novel hybrid optical spectrometer that combines multi-distance frequency and broadband systems to investigate the changes in scattering and pathlength during a Valsalva manoeuvre in 8 adult volunteers. Results show a significant increase in the reduced scattering coefficient of 17% at 790nm and 850nm in 4 volunteers during the peak of the Valsalva. However, these scattering changes do not appear to significantly affect the differential pathlength factor and the tissue haemoglobin concentration measurements.
1. Introduction
In near-infrared spectroscopy (NIRS) of biological tissue, the mean optical path-length depends on the differential pathlength factor (DPF), a parameter that takes into account the increased photon pathlength caused by multiple light scattering in the illuminated tissue. From the diffusion theory, the relationship between the DPF and absorption coefficient (μa) and reduced scattering coefficient (μs’) in an infinite turbid medium has been shown to be [1]:
| (1.1) |
In differential continuous-wave NIRS, the assumption is made that changes in concentration are due only to changes in absorption, and that the DPF remains constant, enabling the quantification of chromophore concentration changes from an arbitrary baseline, using the modified Beer-Lambert law [2]:
| ΔA = ε · ΔC · d · DPF | (1.2) |
where ΔA is change in attenuation, ε is the extinction coefficient, ΔC is the change in chromophore concentration, d is the source-detector spacing.
However, there is experimental evidence to suggest reduced scattering coefficient (μs’) is altered in animal brains during asphyxia and death [3], as well as in exercising human muscle [4]. The aims of this study were to monitor the μs’ changes during increases in total cerebral haemoglobin concentration (Δ[HbT]) in adult volunteers during a Valsalva manoeuvre, and to investigate the influence of changes in DPF on the measurement of Δ[HbT].
2. Methods
Following ethical approval, 8 adult volunteers (4 females and 4 males) with a mean age of 26 years (range 21–31 years) were studied. To monitor the brain we used the hybrid optical spectrometer details of which have been described elsewhere [5]; briefly the instrument consists of a multi-distance broadband spectrometer (MDBBS) and a multi-distance frequency domain (110 MHz) spectrometer (MDFD). The MDBBS measures changes in light attenuation across a broadband spectrum (504–1068nm) at optode distances of 2, 2.5, 3 and 3.5cm. The MDFD measures absolute values for μa and μs’ at four discrete wavelengths (690, 750, 790 and 850nm) at 3 and 3.5cm. The optodes from each system were fused together and attached to the left temporal region of the head. Ambient light was minimised with black cloth. All volunteers were seated throughout the experiment. After 2 minutes of baseline measurements, the Valsalva was performed (forced expiration against a closed glottis) for 40s followed by 2 minutes of recovery.
3. Analysis
Data was filtered to remove obvious movement artefacts, and 6 seconds time-averaging was employed. We calculated a time-variant DPF (calculate DPF for each data point every 6s), and a time-invariant DPF (calculate mean DPF over the first 10 data points from 0–60s) using the MDFD μa and μs’ at 690, 750, 790 and 850nm from Eq. (1.1). The modified Beer-Lambert law (MBL) (Eq. (2.2)) was used to derive oxyhaemoglobin (Δ[HbO2]), and deoxyhaemoglobin concentration changes (Δ[HHb]) from the MDBBS multi-wavelength data from the furthest detector (3.5cm) using both the time-variant DPF and the time-invariant DPF for the 790nm. In addition correction factors for the wavelength dependency of optical pathlength were applied to the chromophore absorption coefficient [6]. Separately using the MDFD μa and assuming a brain tissue water percentage concentration of 70% we estimated Δ[HbO2] and Δ[HHb]. Δ[HbT] could then be derived from the sum of Δ[HbO2] and Δ[HHb]. The peak change in Δ[HbT] during the Valsalva was used to identify the maximum response in all subjects. Using the ‘Student t-test’ (significance at p<0.05), within subjects we compared the differences for μs’ and time-variant DPF at all four MDFD wavelengths between their value during Valsalva (maximum response) versus baseline (the first 10 data points). For group analysis, we calculated the percentage change in μs’ and time-variant DPF from baseline to Valsalva.
4. Results
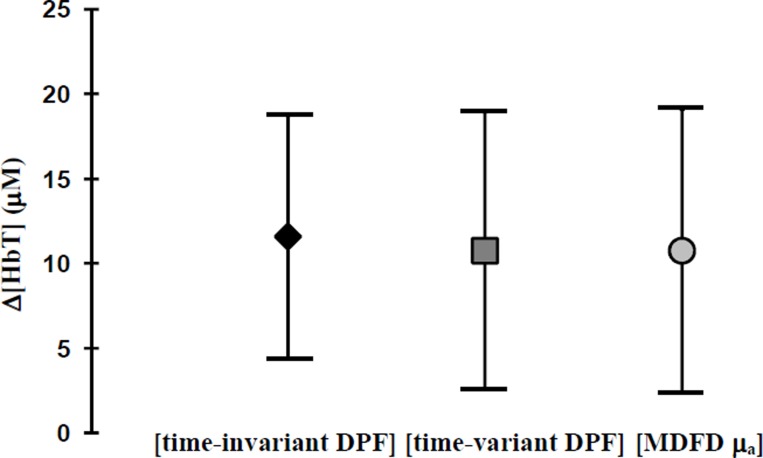
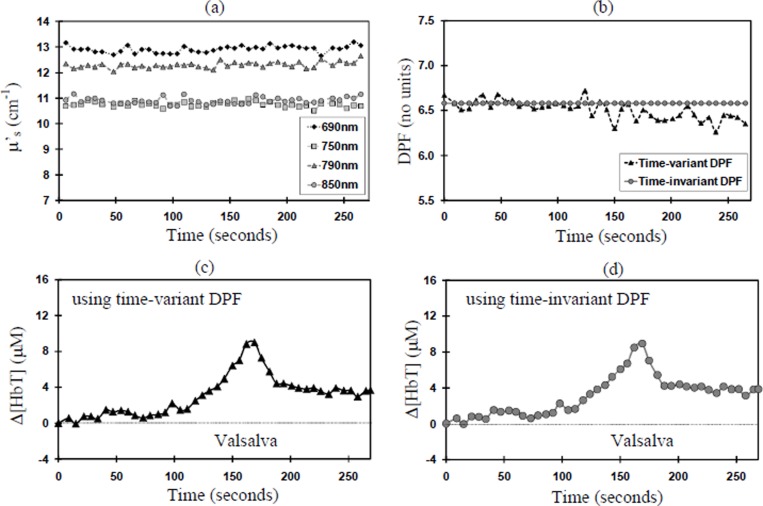
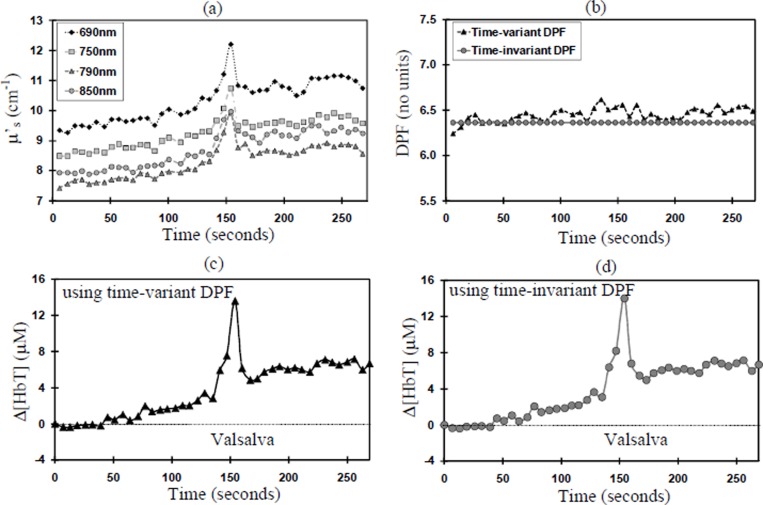
Analysis of the Δ[HbT] mean response for all 8 volunteers as calculated using the time-variant DPF, time-invariant DPF and the MDFD four wavelengths μa show no significant differences at Valsalva (see Fig. 1). Analysis of changes in μs’ for all 8 subjects reveal 4 volunteers with no change (Group A), and 4 volunteers showing a significant increase (Group B) during Valsalva. Figures 2(a) and 3(a) show an example from each group. In Group B, significant increases in μs’ (up to 30% in one subject) were seen across all four MDFD wavelengths. Table 1.1 and Table 1.2 show the results for μs’ and time-variant DPF (group mean ± SD) for Group A and B respectively.
Fig. 1. Group Δ[HbT] mean changes ±SD during Valsalva using the time-invariant DPF, the time-variant DPF and the MDFD four wavelengths μa.
Fig. 2. Group A, Subject 4 (a) change in μS’; (b) Time-variant DPF versus Time-invariant DPF at 790nm; (c) Δ[HbT] using time-variant DPF; (d) Δ[HbT] using time-invariant DPF.
Fig. 3. Group B, Subject 1 (a) change in μS’; (b) Time-variant DPF versus Time-invariant DPF at 790nm; (c) Δ[HbT] using time-variant DPF; (d) Δ[HbT] using time-invariant DPF.
Table 1.1. Group A, μ’s and time-variant DPF (mean ±SD) at baseline and Valsalva.
| Group A - μ’s (cm−1) | Group A - DPF (no units) | |||||
|---|---|---|---|---|---|---|
| λ(nm) | Baseline | Valsalva | change | Baseline | Valsalva | change |
| 690 | 11.7 ± 3.1 | 11.9 ± 3.2 | +2% | 7.6 ± 1.1 | 7.5 ± 1.3 | −1% |
| 750 | 9.4 ± 2.0 | 9.4 ± 1.9 | 0% | 6.3 ± 0.8 | 6.3 ± 0.9 | 0% |
| 790 | 10.5 ± 3.1 | 10.6 ± 3.3 | +1% | 7.4 ± 1.0 | 7.2 ± 1.1 | −3% |
| 850 | 9.7 ± 2.4 | 9.5 ± 2.6 | −2% | 6.4 ± 0.9 | 6.4 ± 0.9 | 0% |
Table 1.2. Group B, μ’s and time-variant DPF (mean ±SD) at baseline and Valsalva.
| Group B - μ’s (cm−1) | Group B - DPF (no units) | |||||
|---|---|---|---|---|---|---|
| λ(nm) | Baseline | Valsalva | change | Baseline | Valsalva | change |
| 690 | 10.5 ± 1.1 | 11.8 ± 1.6 | +12% | 7.1 ± 0.5 | 7.2 ± 0.7 | +1% |
| 750 | 9.1 ± 0.8 | 10.3 ± 1.3 | +13% | 6.1 ± 0.2 | 6.0 ± 0.5 | −1% |
| 790 | 9.0 ± 1.2 | 10.5 ± 1.3 | +17%* | 6.5 ± 0.6 | 6.5 ± 0.9 | 0% |
| 850 | 9.0 ± 1.0 | 10.5 ± 1.1 | +17% * | 6.1 ± 0.2 | 6.1 ± 0.4 | 0% |
Student’s t-test significance p<0.05.
In Group B, μs’ summary analysis shows a significant mean increase of 17% at 790nm and 850nm; no significant increases were seen in the other wavelengths. In both groups there was no significant change in the time-variant DPF during the Valsalva at any of the four wavelengths. Figures 2(b) and 3(b) show an example from each group. Since Δ[HbT] is inversely proportional to DPF (Eq. 1.2) there was no significant effect on measured Δ[HbT], whether a time-variant (see Fig. 2(c) and 3(c)) or a time-invariant DPF was used (see Fig. 2(d) and 3(d)).
5. Discussion
Studies with our hybrid optical spectrometer have allowed measurement of optical scattering and absorption on the adult head during a Valsalva manoeuvre. A statistically significant increase in μs’ that corresponded well to the Valsalva peak was seen in half of the subjects studied.
The general physiological response during the Valsalva is an increase in intra-abdominal and thoracic pressure, resulting in a decrease in venous return which causes pooling of blood within the brain [7]. The increases in measured μs’ during the Valsalva are unlikely to be due to structural changes in tissue cellular level. However, the effects of changes in blood flow [8] and cerebrospinal fluid volume [9] within the optical field of view are potential explanations. There was no correlation between measured Δ[HbT] and μs’ change (data not shown) as was also the case in exercising human muscle [3]. Thus, it is unlikely the consistent increase in total haemoglobin is solely responsible for the large μs’ increases seen in some subjects.
Although μs’ did show significant changes in some subjects, time-variant DPF remained relatively stable in all subjects during the Valsalva and hence, the effects on measured O[HbT] were not significant whether a time-variant or time-invariant DPF was used in the calculation. In addition no differences were seen in the calculation of O[HbT] using the MDFD μa and using the MDBBS measurements with either the time-variant or the time-invariant DPF.
Further work is needed to determine the origin of the observed changes in μs’ to establish whether similar changes may occur in other physiological (eg. functional activation), or pathophysiological (eg. sleep apnoea) states. Further algorithm development may be necessary to correct for measured changes in μs’ in the calculation of changes in NIRS chromophores.
Acknowledgments
The authors would like to thank the EPSRC (EP/D060982/1) and the Department of Health's National Institute for Health Research Centres funding scheme for the financial support of this work.
References
- 1.Fantini S, Hueber D, Franceschini MA, et al. Non-invasive optical monitoring of the newborn piglet brain using continuous-wave and frequency-domain spectroscopy. Phys. Med. Biol. 1999;44:1543–1563. doi: 10.1088/0031-9155/44/6/308. [DOI] [PubMed] [Google Scholar]
- 2.Delpy DT, Cope M. Quantification in tissue near-infrared spectroscopy. Phil. Trans. Roy. Soc. Lond. Series B-Biological Sciences. 1997;352(1354):649–659. [Google Scholar]
- 3.Zhang G, Katz A, Alfano RR, et al. Brain perfusion monitoring with frequency-domain and continuous-wave near-infrared spectroscopy: a cross-correlation study in newborn piglets. Phys. Med. Bio. 2000;45:3143–3158. doi: 10.1088/0031-9155/45/11/303. [DOI] [PubMed] [Google Scholar]
- 4.Ferreira L, Hueber D, Barstow TJ, et al. Effects of assuming constant optical scattering on measurements of muscle oxygenation by near-infrared spectroscopy during exercise. J. Appl. Physiol. 2007;102:358–367. doi: 10.1152/japplphysiol.00920.2005. [DOI] [PubMed] [Google Scholar]
- 5.Tachtsidis I, Kohl-Bareis M, Leung TS, et al. A hybrid multi-distance phase and broadband spatially resolved algorithm for resolving absolute concentrations of chromophores in the near-infrared light spectrum: application on to dynamic phantoms. Biomedical Topical Meetings (The Optical Society of America), BSuE76, Florida, USA. 2008 [Google Scholar]
- 6.Essenpreis M, Elwell CE, Cope M, et al. Spectral dependence of temporal point spread functions in human tissues. Applied Optics. 1993;32(4):418–425. doi: 10.1364/AO.32.000418. [DOI] [PubMed] [Google Scholar]
- 7.Matta B, Lam J, Smielewiski P, et al. The Effect of the VM on Cerebral Haemodynamics: A Near Infrared Spectroscopy Study. J. Neuro. Anesthes. 1996;8(4):336. [Google Scholar]
- 8.Tomita M, Ohtomo M, Suzuki N, et al. Contribution of the flow effect caused by shear-dependent RBC aggregation to NIR spectroscopic signals. NeuroImage. 2006;33:1–10. doi: 10.1016/j.neuroimage.2006.05.042. [DOI] [PubMed] [Google Scholar]
- 9.Okada E, Delpy DT. Near-infrared light propagation in an adult head model. I. Modeling of low-level scattering in the cerebrospinal fluid layer. Applied Optics. 2003;42(16):2906–2914. doi: 10.1364/ao.42.002906. [DOI] [PubMed] [Google Scholar]


