Abstract
Extracorporeal membrane oxygenation (ECMO) is a rescue therapy for patients with cardio-respiratory failure. Establishing, maintaining and weaning from ECMO may increase the risk for intracranial injury. We used a dual channel near infrared system to monitor cerebral and peripheral tissue oxygenation in 3 venoarterial (VA) and 1 venovenous (VV) ECMO patients undergoing manipulations in the ECMO circuit flows. Spectral analysis was performed on the oxyhaemoglobin data collected from these patients with the aim of comparing oscillations at range of frequencies appearing in the two measurement sites.
1. Introduction
Extracorporeal membrane oxygenation (ECMO) is a life support system in children with intractable cardio-respiratory failure. It is aimed at supporting the heart and lungs temporarily whilst giving them a chance to recover. As ECMO is used in patients who are otherwise likely to die, the results focus on survival. However, 28–52% of these patients show abnormal neuro-imaging related both to pre-ECMO events and to the ECMO procedure itself [1]. There are 2 forms of ECMO support–venoarterial (VA) ECMO and venovenous (VV) ECMO. Establishing VA ECMO involves cannulation of major vessels in the neck–right common carotid artery (RCCA) and internal jugular vein–and supports both heart and lungs. VV ECMO involves supporting only the lungs and does not involve cannulation of the RCCA. The ECMO system can operate using 2 types of blood pumps: 1) A centrifugal pump which uses a high speed rotating device that pulls the blood into the pump and then accelerates it radially outwards and 2) a roller pump which compresses the cannula, thereby pushing the blood through the circuit. Maintaining and weaning from ECMO requires manipulation of ECMO flows, which can affect cerebral blood flow and potentially lead to neurologic complications.
Near infrared spectroscopy (NIRS) offers a continuous, non invasive means of monitoring cerebral oxygenation. Ejike et al. [2] report the use of NIRS on ECMO patients during ligation of the RCCA and during variations in the ECMO circuit flows. They concluded that regional cerebral oxygenation is not primarily affected by alterations in flows but did demonstrate a significant decrease in right sided cerebral oxygenation during ligation. Previous studies using NIRS to evaluate the effects of vessel ligation showed a decrease in oxy-(HbO2) and increase in deoxy-(HHb) haemoglobin in the right hemisphere [3] and in both hemispheres [4].
The long-term aim is to use an optical topography system to investigate topographic cerebral oxygenation changes in patients undergoing ECMO. However initially we are monitoring regional cerebral and peripheral tissue oxygenation using a dual channel system, with the aim of investigating the relationship between brain and peripheral tissue oxygenation during changes in ECMO related variables.
2. Methods
Studies were performed on 4 ECMO patients, aged between 1 day and 5 years. The patient group in this pilot study is a rather inhomogeneous group consisting of 2 VA ECMO cases operating on centrifugal pumps, 1 VA ECMO and 1 VV ECMO operating on roller pumps.
A dual channel near infrared system (NIRO 200, Hamamatsu Photonics KK) was used to measure changes in HbO2 and HHb haemoglobin concentrations using the modified Beer-Lambert Law, and tissue oxygenation index (TOI) using spatially resolved spectroscopy. Channel 1 was placed on the forehead (cerebral) and channel 2 on the calf (peripheral) of the patients. The optodes were held in place using elastic bandage to eliminate possible drifts in the signal arising from gradual loss in contact between the optode and the skin. For the conversion of the optical attenuation changes to chromophore concentration changes a differential pathlength factor (DPF) of 4.99 was applied [5]. Data were collected during manipulations in the ECMO circuit flow. Blood flow in the ECMO circuit was decreased or increased successively by 10% from the initial flow every 20–30 min.
The data were divided into sections for each specific flow. Power spectral density (PSD) and coherence analysis were performed on the HbO2 signal recorded at the two measurement sites. The PSDs were obtained in order to identify the presence of any oscillations occurring in the brain and in the leg and were estimated using Welch’s method [6]. The coherence function was used to characterise the frequency dependent correlation of the HbO2 signal in the brain with the HbO2 signal in the leg. We defined three frequency bands (very low (VLF) 0.002–0.3 Hz, low (LF) 0.3–0.5 Hz and high (HF) 0.5–1 Hz) to extract vasomotion, respiratory and cardiac oscillations. To obtain a measure of the coherence over a specific frequency band, the coherence function was averaged over that frequency band.
3. Results and Discussion
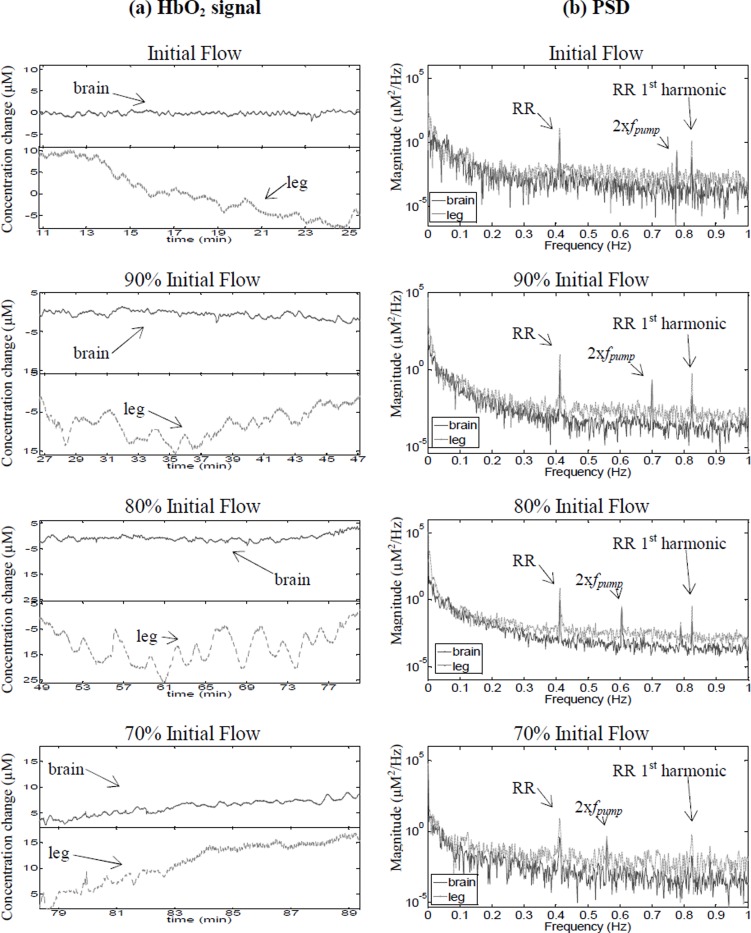
Figure 1 (a) shows the oscillatory changes in HbO2 and (b) the corresponding PSDs during weaning for Patient 1 undergoing VA ECMO. When a patient is weaned off ECMO the blood flow in the ECMO circuit is reduced by 10% approximately every 30 minutes while the heart and lungs of the patient are gradually allowed to take over. In this case, the ECMO circuit operated on a roller pump.
Fig. 1. (a) Changes in HbO2 data in the brain and leg for Patient 1, during reduction in the ECMO circuit blood flow. (b) Corresponding power spectral density.
The PSDs show the presence of a strong oscillation in the brain and leg that remains constant as the ECMO circuit flow is decreased, corresponding to the patient’s respiration rate (RR). A higher frequency appears in both the brain and leg that shifts to the left with decreasing ECMO circuit flow. This frequency is twice the frequency of the pump (fpump) in the ECMO circuit, which is consistent with the two headed roller pump. In addition, a very slow oscillation (~0.005 Hz) is present only in the leg. The strength of this oscillation appears to be increasing as the flow is reduced and can be clearly seen even in the time domain plots. This observation raises questions about the relationship between cerebral and systemic vascular vasomotion and whether cerebral autoregulation results in suppressing this oscillation in the brain. The coherence between the brain and leg at 90%, 80% and 70% initial flow in the VLF and LF bands was significantly different (p<0.05) from the coherence at initial flow in these frequency bands. Also, there was an increase in coherence in association with reduction in ECMO flows.
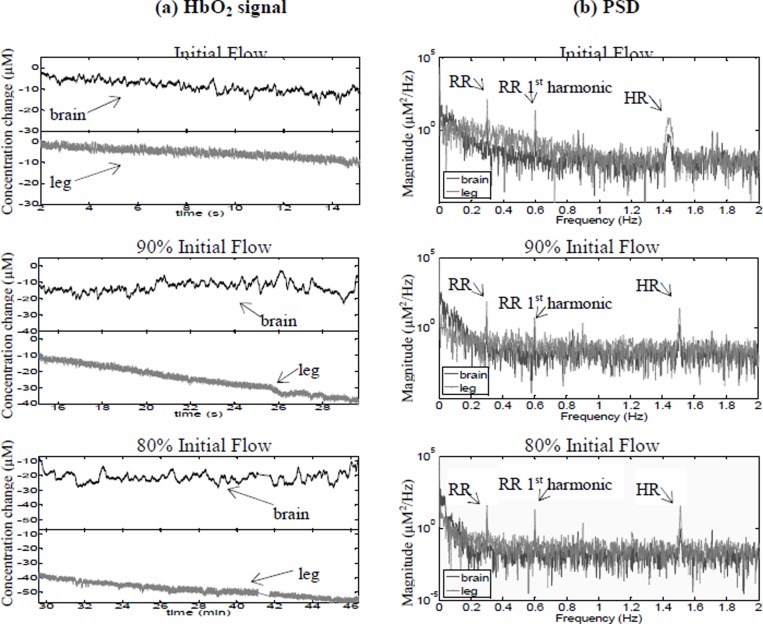
Figure 2 shows a) the changes in HbO2 data and b) the corresponding PSDs for Patient 2, undergoing VA ECMO on a centrifugal pump. The PSDs of this patient showed the presence of two oscillations, one in the LF band corresponding to the patient’s RR and the other in the HF band corresponding to the patient’s heart rate (HR). There is no indication of the pump frequency in these data. However, we can identify oscillations in the VLF band. In comparison with the previous patient these oscillations occur around 0.015 Hz and appear only in the brain and not in the leg. The coherence between the brain and leg at 90% and 80% initial flow in the VLF, LF and HF bands was significantly different (p<0.05) from the coherence at initial flow in these frequency bands. This is in contrast with Patient 1, who showed a decrease in coherence with reduction in ECMO flows.
Fig. 2. (a) Changes in HbO2 data in the brain and leg for Patient 2, during reduction in the ECMO circuit blood flow. (b) Corresponding power spectral density.
Spectral analysis was performed on another patient undergoing VA ECMO with a centrifugal pump (Patient 3). The PSDs, shown in Figure 3(b) identify the RR and the HR. Similar to the results of patient 1, the PSD of this patient showed the presence of oscillations (~0.005 Hz) in the leg and not in the brain.
Fig. 3. (a) Changes in HbO2 data in the brain and leg for Patient 3. (b) Corresponding power spectral density.
Figure 4(a) shows the changes in HbO2 data of a patient undergoing VV ECMO with a roller pump (Patient 4). The corresponding PSDs are shown in figure 4(b) with the RR and the HR present in both brain and leg. Two more oscillations were identified; ~0.005 Hz appearing in the leg only and ~0.05 Hz appearing in the brain only. The difference between the oscillations in the VLF range can be clearly seen even in the time domain plots.
Fig. 4. (a) Changes in HbO2 data in the brain and leg for Patient 4. (b) Corresponding power spectral density. (b) PSD.
4. Conclusions
NIRS is an effective technique for monitoring cerebral oxygenation in ECMO patients. We have used PSDs to identify the presence of any oscillations occurring in the brain and leg of 4 ECMO patients undergoing flow manipulations. The RR and HR can be picked up in all patients and is present in both brain and leg. In addition to these oscillations, we identified the presence of oscillations in the VLF band. It is interesting that a low frequency oscillation (0.005Hz) was present in the leg data of 3 of the 4 patients studied (2 VA ECMO patients and 1 VV ECMO patient). Kvandal et al. report the presence of skin vasomotion oscillations in the interval 0.005–0.0095 Hz [7]. Two of the patients showed slow oscillations in the brain (~0.015Hz in Patient 2 and ~0.05Hz in Patient 4), similar to those described by Obrig et al. [8]. Oscillations in the HF band appearing at twice the frequency of the ECMO pump were detected in brain and leg for Patient 1 (VA ECMO on roller pump). There was not clear relationship between the origin of the oscillation and the patients’ clinical condition.
Further studies are required to more fully explore the relationship between oscillations arising in specific frequency bands and the type of ECMO procedures used in different patients. These studied may elucidate cerebral autoregulation mechanisms in ECMO patients.
Acknowledgment
This work is supported by Hitachi Medical Ltd.
References
- 1.Bulas D, Glass P. Neonatal ECMO: Neuroimaging and neurodevelopmental outcome. Seminars in Perinatology. 2005;29:58–65. doi: 10.1053/j.semperi.2005.02.009. [DOI] [PubMed] [Google Scholar]
- 2.Ejike JC, Schenkeman KA, Seidel K, Ramamoothy C, Roberts JS. Cerebral oxygenation in neonatal and pediatric patients during veno-arterial extracorporeal life support. Pediatr Crit Care Med. 2006;7:154–158. doi: 10.1097/01.PCC.0000200969.65438.83. [DOI] [PubMed] [Google Scholar]
- 3.Liem KD, Hopman JCW, Oeseburg B, de Haan AFJ, Festen C, Kollee LAA. Cerebral Oxygenation and hemodynamics during induction of extracorporeal membrane oxygenation as investigated by near infrared spectrophotometry. Pediatrics. 1995;95:555–561. [PubMed] [Google Scholar]
- 4.Van Heijst A, Liem D, Hopman J, Van der Stakk F, Sengers R. Oxygenation and hemodynamics in left and right cerebral hemispheres during induction of veno-arterial extracorporeal membrane oxygenation. Pediatr. 2004;144:223–228. doi: 10.1016/j.jpeds.2003.11.006. [DOI] [PubMed] [Google Scholar]
- 5.Duncan A, Meek JH, Clemence M, Elwell CE, Tyszczuk L, Cope M, Delpy DT. Optical pathlength measurements on adults head, calf and forearm and the head of the newborn infant using phase resolved optical spectroscopy. Phys Med Biol. 1995;40:295–304. doi: 10.1088/0031-9155/40/2/007. [DOI] [PubMed] [Google Scholar]
- 6.Welch PD. The use of Fast Fourier Transform for the Estimation of Power Spectra: A Method Based on Time Averaging of Short, Modified Periodograms. IEEE Trans. Audio and Electroacoustics, AU. 1967;15(2):70–73. [Google Scholar]
- 7.Kvandal P, Landsverk SA, Bernjak A, Stefanovska A, Kvernmo HD, Kirkeboen KA. Low frequency oscillations of the Laser Doppler perfusion signal in human skin. Microvascular Research. 2006;72:120–127. doi: 10.1016/j.mvr.2006.05.006. [DOI] [PubMed] [Google Scholar]
- 8.Obrig H, Neufang M, Wenzel R, Kohl M, Steinbrink J, Einhaupl K, Villringer A. Spontaneous Low Frequency Oscillations of Cerebral Hemodynamics and Metabolism in Human Adults. NeuroImage. 2000;12:623–639. doi: 10.1006/nimg.2000.0657. [DOI] [PubMed] [Google Scholar]


