Abstract
For resolving absolute concentration of tissue chromophores in the human adult brain with near-infrared spectroscopy it is necessary to calculate the light scattering and absorption, at multiple wavelengths with some depth resolution. To achieve this we propose an instrumentation configuration that combines multi-distance frequency and broadband spectrometers to quantify chromophores in turbid media by using a hybrid spatially resolved algorithm. Preliminary results in solid phantoms as well as liquid dynamic homogeneous and inhomogeneous phantoms and in-vivo muscle measurements showed encouraging results.
1. Introduction
Reflectance near-infrared spectroscopy (NIRS) is a technique for characterizing turbid media that has become widely used in medical diagnostics. In particular the in-vivo determination of the optical properties of the human muscle, breast and brain is of the utmost importance.
Typically in biological tissue, the near infrared absorbers and major intrinsic chromophores which need to be quantified are hemoglobin, cytochrome-c-oxidase and water. Many researchers rely on a small number of discrete wavelengths to recover the concentrations of these constituents from non-invasive in-vivo measurements, usually above and below the isosbestic wavelength of oxygenated (HbO2) and deoxygenated (HHb) hemoglobin (near 800nm). Recovery of all intrinsic chromophores in tissue is a somewhat ill-posed problem; the measurements are often hampered by errors due to poor signal-to-noise ratio, wide range of possible chromophores concentrations, difficulties in and requirement for instrument calibration, poor depth resolution and inhomogeneous structure of the tissue being investigated. To help overcome these problems it can be useful to use multispectral and multi-distance measurements of NIR light attenuation to resolve absorption and scattering.
This paper reports on a novel approach to calculate absolute concentrations of chromophores in turbid media such as biological tissue by fusing multi-distance frequency resolved and multi-distance broadband near-infrared spectroscopy with a hybrid spatially resolved algorithm.
2. Methods
2.1. The Instrument
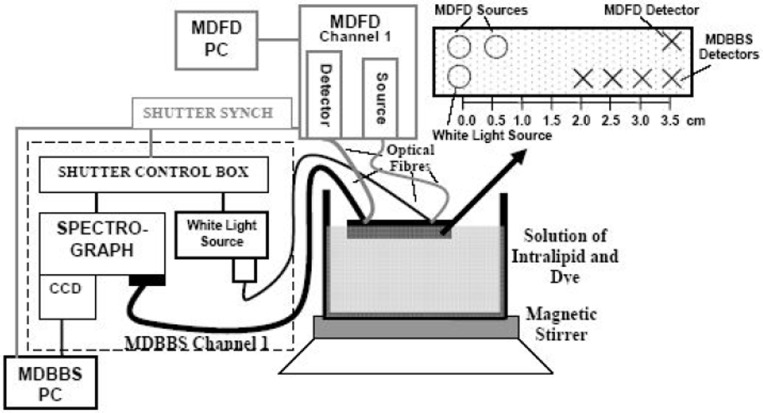
The instrumentation configuration consisted of two spectrometers (Fig. 1). The first is a four wavelength (690, 750, 790, 850nm) multi-distance frequency domain (110MHz) spectrometer (MDFD), which is a modification of the commercially available OxiplexTSTM from ISS Inc (Champaign, IL, USA). This instrument allows for the determination of the average value (dc), amplitude (ac) and phase (Φ) of the modulated intensity at two different source-detector distances (3 and 3.5cm) at each wavelength. This multi-distance method affords the quantitative assessment of the absorption (μa) and reduced scattering (μs’) coefficients by using the paired ac and Φ data [1].
Fig. 1. Instrumentation diagram and experimental set up for dynamic homogeneous phantom studies also showing the configuration of the optodes from both systems.
The second instrument is a multi-distance broadband spectrometer (MDBBS). It consists of a white light source that utilizes a 50W halogen bulb and a short pass filter to minimize temperature effects. The spectrograph is based on a configuration of lenses (rather than mirrors), and is comprised of a 50×50mm grating with 300 grooves per mm that is blazed at 1000nm (to optimize the reflection in NIR). The light spectrum is detected by a CCD camera (PIXIS:512f, Princeton Instruments), with chip dimensions of 12.3×12.3mm that corresponds to 512×512 pixels with a pixel size of 24×24 μm. In order to use most of CCD chip the current design involves four detector fibres with different diameters, where the diameter of the furthest detector (3.5cm) is 3mm, the diameter for the second detector (3cm) is 2mm and 1mm for the two closest detectors (2.5cm and 2cm). In addition to that the geometry of the fibre bundles on the distal end was changed from round to approximate oval in order to decrease the area blocked by the slit. The optical bandwidth of the MDBBS is 564nm (504-1068nm) and the mean wavelength resolution is 4nm. The MDBBS is an upgrade of an early design of a Lens Imaging Spectrograph (or LImS) developed earlier [2].
The two instruments measure sequentially with the frequency domain system providing the synchronization trigger. The measurement cycle consists of an MDBBS measurement followed by an MDFD measurement, resulting in a minimum sampling rate of 1Hz and a maximum sampling rate of 0.25Hz.
2.2. The Algorithm
The MDBBS measures light attenuation at several wavelengths (A(λn)) at four distances. From these measurements we calculate the slope of light attenuation versus distance, ρ(∂A(λn)/∂ρ). Using the MDFD derived values of scattering for the four wavelengths and assuming scattering is following a power function versus wavelength we can derive estimates of μs’(λn) at all other wavelengths. One then can calculate absorption (μa(λn) SRS) from the spatially resolved spectroscopy (SRS) methodology using Eq. (1.1) [3]. To obtain the absolute broadband hybrid absorption (μa(λn) Hybrid) we use the MDFD derived μa(MDFD) for the four wavelengths to scale the μa(λn) SRS by minimizing the mean squared difference between them.
| (1.1) |
where μa(λn) SRS is the absorption, μs’(λn) is the reduced scattering, (∂A(λn)/∂ρ) is the slope of light attenuation versus optode distance and ρ is the mean optode distance.
3. Results
3.1. Solid Homogeneous Phantoms
The instrumentation and methodology was first tested on homogeneous solid phantoms (Block A and B) with known absorption and scattering properties.
Table 1.1. Comparison of absorption and scattering between real and measured values for Block A and Block B (the percentage values inside the parenthesis show the error).
| Wavelengths (nm) | ||||||
|---|---|---|---|---|---|---|
| Real μa | Real μs ’ | μa (MDFD) | μs ’ (MDFD) | μa Hybrid | μs ’ Hybrid | |
| Block A | (cm−1) | (cm−1) | (cm−1) | (cm−1) | (cm−1) | (cm−1) |
| 690 | 0.115 | 10.9 | 0.112 (−3%) | 10.8 (−1%) | 0.109 (−5%) | 10.9 (0%) |
| 750 | 0.112 | 10.2 | 0.110 (−2%) | 10.1 (−1%) | 0.111 (−1%) | 10.3 (1%) |
| 790 | 0.109 | 9.9 | 0.107 (−2%) | 9.7 (−2%) | 0.109 (0%) | 10.0 (1%) |
| 850 | 0.106 | 9.5 | 0.106 (0%) | 9.6 (2%) | 0.104 (−2%) | 9.5 (0%) |
| Block B | ||||||
| 690 | 0.146 | 5.1 | 0.146 (0%) | 5.1 (0%) | 0.143 (−2%) | 5.0 (−1%) |
| 750 | 0.144 | 4.7 | 0.144 (0%) | 4.7 (−1%) | 0.144 (0%) | 4.7 (0%) |
| 790 | 0.143 | 4.5 | 0.143 (0%) | 4.5 (0%) | 0.143 (0%) | 4.5 (1%) |
| 850 | 0.142 | 4.3 | 0.139 (−2%) | 4.3 (0%) | 0.141 (−1%) | 4.3 (0%) |
3.2. Dynamic Homogeneous and Inhomogeneous Phantoms
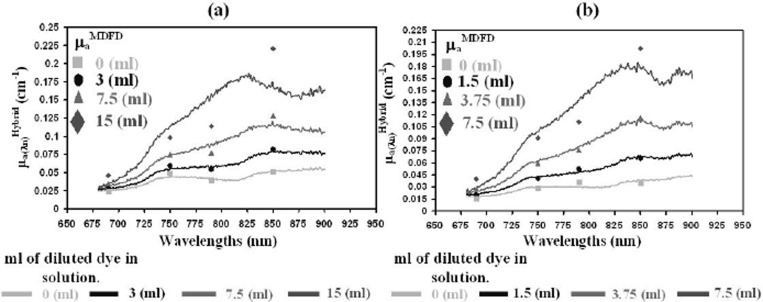
To further test the accuracy of the hybrid instrument and algorithm, measurements were performed in dynamic liquid phantoms. First a diluted absorbing dye (ADS842MC) was dissolved in steps of 3, 7.5 and 15ml in a small tank containing 2850ml of deionized water mixed with 150ml of aqueous scattering suspension (Intralipid-20%). Measurements were done (see Fig. 2(a)) with the optodes of the hybrid system slightly submerged below the surface of the solution. Second a small tank with an outside wall made of epoxy resin with thickness of 5mm and fixed absorption coefficient of 0.35cm−1 and reduced scattering 14.5cm−1 (at 780nm). Measurements were done (see Fig. 2(b)) with the optodes of the hybrid system attached to the outside of the wall and a diluted ADS842MC was dissolved in steps of 1.5, 3.75 and 7.5ml in 1425ml in deionized water mixed with 75ml of aqueous scattering suspension (Intralipid-20%).
Fig. 2. Measurements of absorption coefficient with the MDFD and hybrid instrument in the (a) homogeneous liquid phantom and (b) inhomogeneous liquid phantom.
Using the specific extinction coefficients of the dye (fitting from 680 to 900nm) and the measured absorption coefficient, the absolute concentration of the dye was calculated and compared with the theoretical expected values. The mean error and standard deviation (SD) between the measured and the expected concentrations of the dye for the homogeneous phantom was 56.4% (83.4%) for the MDFD system and 8.2% (10.2%) for the hybrid system; for the inhomogeneous phantom the errors were 35.6% (40.5%) for the MDFD system and 24.4% (8.2%) for the hybrid system. In both cases the hybrid instrument outperformed the MDFD.
3.3. In-vivo Muscle
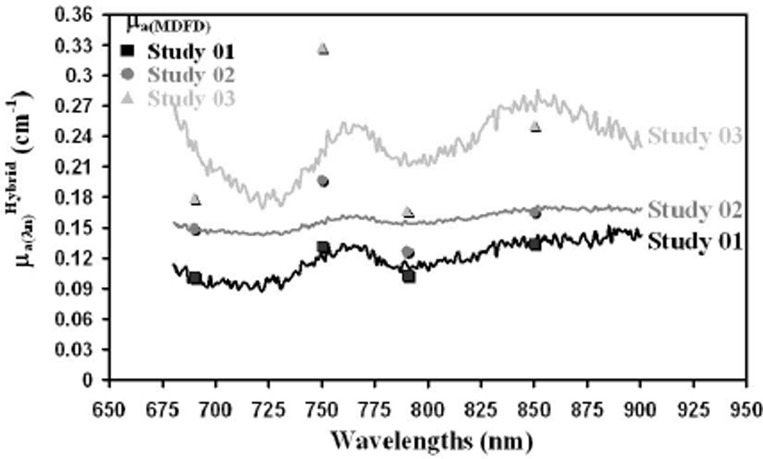
The optodes of the hybrid instrument were placed on the forearm muscle of three young volunteers (mean age 24) (see Fig. 3).
Fig. 3. Absolute broadband absorption from in-vivo muscle measurements in three volunteers during rest.
Using the absorption coefficients measured as described above we fitted the specific extinction coefficient of HbO2 and HHb and calculated the concentrations of these chromophores and from this the tissue oxygen saturation (StO2) (Table 1.2).
Table 1.2. Absolute concentrations of oxy- and deoxy- hemoglobin, total hemoglobin (HbT=HbO2 + HHb) and tissue oxygen saturation (StO2=HbO2 / HbT).
| HbO2(μM) | HHb(μM) | HbT (μM) | StO2 (%) | ||
|---|---|---|---|---|---|
| Study 01 | MDFD | 28.1 | 17.4 | 45.5 | 61.8 |
| (Female) | Hybrid | 30.3 | 18 | 48.3 | 62.7 |
| Study 02 | MDFD | 32.3 | 28.6 | 60.9 | 53 |
| (Female) | Hybrid | 35.4 | 28.1 | 63.5 | 55.8 |
| Study 03 | MDFD | 58.9 | 37.6 | 96.5 | 61 |
| (Male) | Hybrid | 60.2 | 38.5 | 98.7 | 60.9 |
4. Discussion
The central novelty and innovation of this methodology is that by using the MDFD derived μa and μs’ values we can convert the MDBBS slope measurements of attenuation to measurements of absolute μa across the NIR wavelength range. Broadband μa will allow a more accurate quantification of chromophores such as cytochrome-c-oxidase with less cross talk from HbO2 and HHb [4]. We have tested the instrumentation and methodology in solid phantoms, homogeneous and inhomogeneous dynamic liquid phantoms and human muscle. The results were encouraging and this technology will soon be used for studies in human adult volunteers and patients undergoing neurocritical care.
Acknowledgments
The authors would like to thank the EPSRC (EP/D060982/1) for the financial support of this work.
References
- 1.Hueber DM, Franceschini MA, Ma HY, et al. Non-invasive and quantitative near-infrared hemoglobin spectrometry in the piglet brain during hypoxic stress, using a frequency-domain multi-distance instrument. Phys Med Biol. 2001;46:41–62. doi: 10.1088/0031-9155/46/1/304. [DOI] [PubMed] [Google Scholar]
- 2.Soschinski J, Geraskin D, Milosavljevic B, et al. Cerebral oxygenation monitoring during cardiac bypass surgery in babies with broad band spatially resolved spectroscopy. Adv in Med Eng. 2007;114 [Google Scholar]
- 3.Suzuki S, Takasaki S, Ozaki T, et al. A tissue oxygenation monitor using NIR spatially resolved spectroscopy. Proc SPIE. 1999;3597:582–592. [Google Scholar]
- 4.Matcher SJ, Elwell CE, Cooper CE, et al. Performance comparison of several published tissue near-infrared spectroscopy algorithms. Anal Biochem. 1995;227(1):54–68. doi: 10.1006/abio.1995.1252. [DOI] [PubMed] [Google Scholar]


