Abstract
Functional optical topography (OT) measures the changes in oxygenated and deoxygenated hemoglobin (HbO2, HHb) across multiple brain sites which occur in response to neuronal activation of the cerebral cortex. However, identification of areas of cortical activation is a complex task due to intrinsic physiological noise and systemic interference and careful statistical analysis is therefore required. A total of 10 young healthy adults were studied. The activation paradigm comprised of anagrams followed by finger tapping. 12 channels of the OT system were positioned over the frontal cortex and 12 channels over the motor cortex while the systemic physiology (mean blood pressure (MBP), heart rate (HR), scalp flux) was simultaneously monitored. Analysis was done using the functional Optical Signal Analysis (fOSA) software and Statistical Parametric Mapping (SPM), where we utilized two approaches: (i) using only HbO2 as a regressor in the general linear model (GLM) and (ii) using all of the explanatory variables (HbO2, MBP, HR and scalp flux) as regressors. Group analysis using SPM showed significant correlation in a large number of OT channels between HbO2 and systemic regressors; however no differences in activation areas were seen between the two approaches.
1. Introduction
Optical topography (OT) techniques to map functional brain activation rely on making simultaneous near-infrared spectroscopy (NIRS) measurements of changes in oxygenated and deoxygenated hemoglobin (HbO2, HHb) concentration at multiple brain sites. The generated spatial maps of the hemoglobin concentration changes correspond to specific regions of the cerebral cortex. However, identification of areas of cortical activation require statistical analysis with researchers using classical statistical approaches such as “Student’s t-test” and/or more complex tools such as Principal Component Analysis, Independent Component Analysis, and more recently Statistical Parametric Mapping (SPM) [1–5]. Interpretation of the optical functional activation remains a complex task due to the intrinsic physiological noise and systemic interference [6–8]. The aim of this study is to investigate the use of SPM analysis for interpretation of functional optical topography hemoglobin changes during frontal lobe anagram activation and motor cortex finger tapping activation with and without accounting for physiological and systemic changes.
2. Methods
We studied 10 subjects (5 male and 5 female), all had English as their first language and were right handed (this study was approved by the UCL Research Ethics Committee). The age range was between 19 and 27 years with a mean age of 22 years.
NIRS measurements were conducted with the ETG-100 Optical Topography System (Hitachi Medical Co., Japan) using two 12-channel arrays. Each optode array consisted of 5 source optodes (each delivering light at 780 and 830 nm) and 4 detector optodes. The source-detector interoptode spacing was 30mm and data were acquired at 10Hz. The optodes were placed over the subject’s left frontal cortex and positioned according to the International 10–20 system of electrode placement such that channels 1–12 were centered approximately over the frontopolar region (Fp) and channels 13–24 were centered approximately over the left primary motor cortex (C3) (see Fig. 1). The Cartesian coordinates of the NIRS optodes placement were measured - in relation to known fiducial landmarks (nasion, inion, left and right ear and top of the head), using the Polhemus tracking device (Isotrak II, USA) and the inter-subject variability were calculated. For this study the x, y and z coordinates of each of the optodes did not vary between subjects by more than ±2cm of the mean position of each probe.
Fig. 1. A picture illustrating the approximate positions of the OT light sources, detectors and locations of corresponding measuring positions/channels co-registered with brain MRI using the Pholemus information (numbers represent OT channels).
A Portapres® system (TNO Institute of Applied Physics) was used to continuously and non-invasively measure mean blood pressure (MBP) and heart rate (HR) from the finger. A laser Doppler probe (FloLab, Moore Instruments) was placed over the forehead to monitor the changes in scalp blood flow (flux).
Data were recorded during 1 minute of the subject at rest (baseline), followed by 45 seconds of the subject solving anagrams (a mixture of 4-letter, 6-letter and 8-letter anagrams), followed by 30 seconds of rest, followed by 30 seconds of finger-tapping. In this study solving an anagram was defined as producing one coherent word using only the letters from another word (e.g. icon – coin). Each anagram-solving and finger-tapping period was repeated a total of eight times, with the study ending after a 60 second rest period (total study time 19.5 minutes). During this functional paradigm the participants were asked to be still and silent; and no response to anagram solving was requested.
All data were subjected to an identical preprocessing procedure using the functional Optical Signal Analysis program (fOSA) [5] (University College London, UK) to convert the relative changes in light intensities to concentration changes in HbO2 and HHb using a differential pathlength factor correction of 6.26. All the signals including MBP, HR and flux, were linear detrended, then decimated from 10Hz to 1Hz and smoothed using a 3-second moving average.
Before performing the statistical analysis using the SPM, image processing of the HbO2 data was performed using fOSA as described by Koh et al. [5]. In brief, it involves the spatial conversion of the OT maps of each measurement channel to its corresponding pixel location for each of the 24 channels. A series of two-dimensional SPM-OT maps were generated with each SPM-OT map representing a 1-second time point. To improve on the sensitivity and facilitate inter-subject comparisons, an interpolation process using nearest neighbors is used to produce a more realistic data grid.
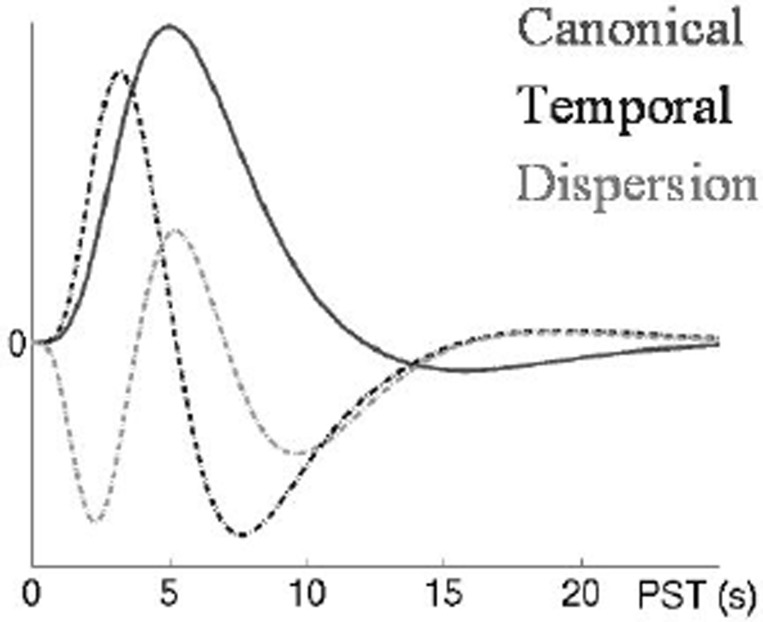
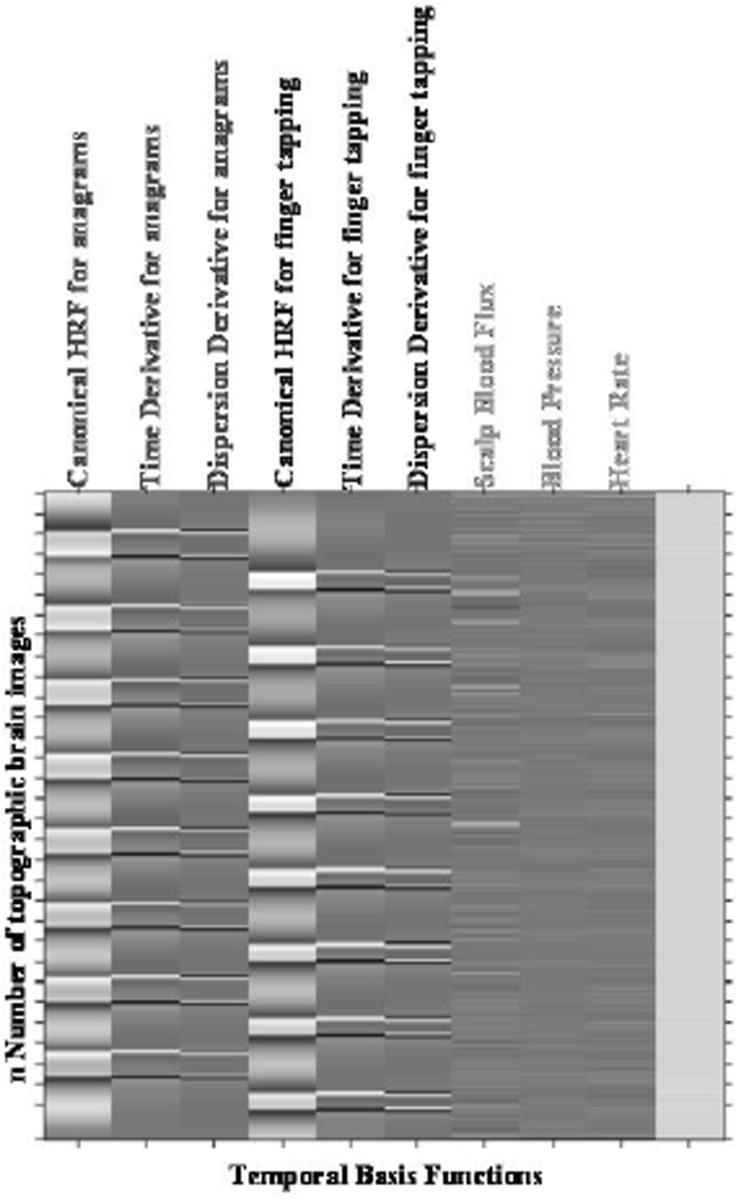
In our SPM analysis we utilized two approaches to model the OT data; in the first approach we used only the HbO2 signal in the General Linear Model (GLM) and in the second approach we incorporated the physiological measures (MBP, HR and flux) in addition to the HbO2 signal as additional regressors in our statistical model. To treat the variability of the haemodynamic response (HbO2) arising from different events between different brain pixels, we modeled both latency and dispersion derivatives as additional regressors to the canonical Haemodynamic Response Function (HRF) (see Fig. 2) in the two approaches. The design matrix is shown in Figure 3.
Fig. 2. Canonical HRF (2 gamma functions) plus Multivariate Taylor expansion in time (Temporal Derivative) and width (Dispersion Derivative) [9].
Fig. 3. Design matrix for the oxyhaemoglobin model for the anagrams (first three columns), finger tapping (next three columns) tasks followed by the three regressors (physiological confounds) and a constant error term for the design matrix. Each row represents a time slice of the topographic brain map.
The resulting statistical maps were family-wise error corrected to account for the spatial correlation between neighboring pixels in OT measurements. An F-contrast was defined in the SPM test for each subject to infer on any interaction (canonical HRF, its temporal and dispersion derivatives) in each of the two tasks. A group t-statistic was then conducted in SPM to infer on its population level.
3. Results
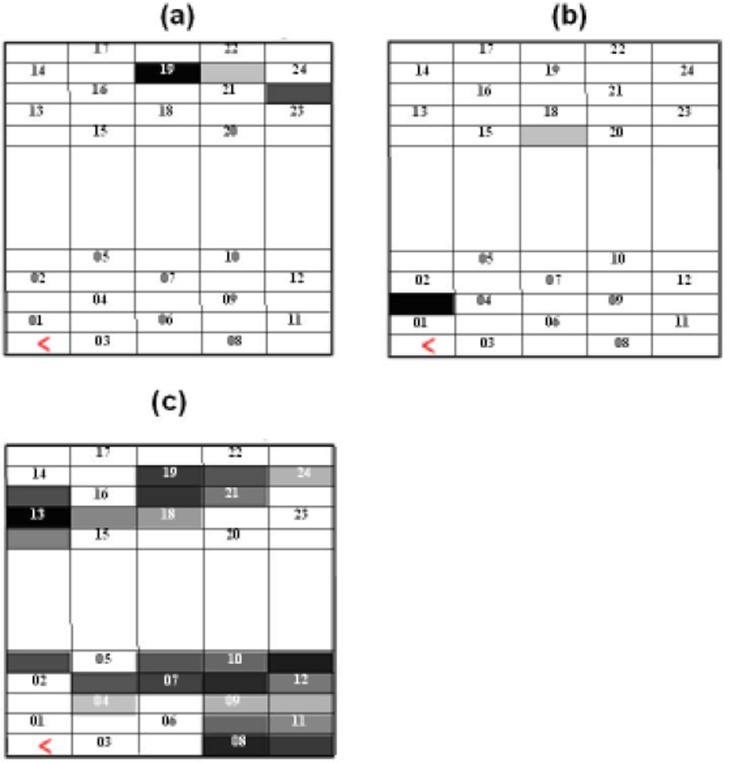
Figure 4 shows the SPM group t-results, without physiological confounds, for (a) the anagram task and (b) the finger tapping for the HbO2 signal. Figure 5 shows the SPM group t-results, with physiological confounds, for (a) the anagram and (b) the finger tapping task for the HbO2 signal. Darker pixels correspond to higher t-values, with positive t scores for HbO2 signal indicating a significant task related increase in HbO2. Figure 5(c) shows the SPM group t-results for the physiological confounds; in this map darker pixels correspond to significant correlations of one or a combination of the regressors MBP, HR and flux, with the HbO2 haemodynamic response.
Fig. 4. The SPM group t-results without physiological confounds with a threshold of t=4.29 and significance of p≤0.05; darker pixels correspond to higher significant t-values.
Fig. 5. The SPM group t-results with physiological confounds and a threshold of t=4.29 and significance of p≤0.05; darker pixels correspond to higher significant t-values.
Results from the group level analysis in the current study have demonstrated that the most significant channels (dark regions) during anagram activation are between 19, 21, 22 and 24 which are on the lower site of the temporal lobe; and during finger tapping are channels 2 and 18 which are on the upper part of the temporal lobe.
4. Discussion
There were no differences in the activation responses in the SPM group analysis with and without physiological confounds in this functional paradigm. Group level analysis on the systemic regressors shows highly significant correlation of the systemic variables in most channels in the study; however this did not make a difference in the interpretation of the task related HbO2 response.
Interpretation of the optical data during functional activation remains a complex task as there are many confounds due to different degrees of physiological noise and systemic interference both at the intra and inter subject level. A unified approach of statistical investigation for inference analysis of functional activation with optical topography is needed. We have previously compared “Student’s t-test” with SPM methods and found the SPM to be a better analysis tool [8]. Here we detail the SPM method for OT data. However further work is needed to refine the Optical SPM analysis, especially for the development of an optical response function similar to the haemodynamic response function (used in this study).
Acknowledgments
The authors would like to acknowledge the EPSRC (Grant No EP/D060982/1).
References
- 1.Hirosaka R, Katura T, Kawaguchi H, et al. Noisy time-delayed decorrelation and its application to extraction of neural activity from single optical recordings in guinea pigs. Physica D. 2004:320–332. [Google Scholar]
- 2.Yoshida T, Sakagami M, Yamazaki K, et al. Extraction of neural activity from in vivo optical recordings using multiple independent component analysis. IEEJ Trans EIS. 2007;127(10):1642–1650. [Google Scholar]
- 3.Zhang X, Toronov V, Webb A. Simultaneous integrated diffuse optical tomography and functional magnetic resonance imaging of the human brain. Opt Express. 2005;13(14):5513–5521. doi: 10.1364/opex.13.005513. [DOI] [PMC free article] [PubMed] [Google Scholar]
- 4.Schiessl I, Stetter M, Mayhew JEW, et al. Blind signal separation from optical imaging recordings with extended spatial decorrelation. IEEE Trans on Biomed Eng. 2000;47(5):573–577. doi: 10.1109/10.841327. [DOI] [PubMed] [Google Scholar]
- 5.Koh PH, Glaser DE, Flandin G, et al. Functional optical signal analysis (fOSA): a software tool for NIRS data processing incorporating statistical parametric mapping (SPM) JBO. 2007;12(6) doi: 10.1117/1.2804092. [DOI] [PubMed] [Google Scholar]
- 6.Tachtsidis I, Leung TS, Devoto L, et al. Measurement of frontal lobe functional activation and related systemic effects: a near-infrared spectroscopy investigation. Adv Exp Med Biol. 2008;614:397–403. doi: 10.1007/978-0-387-74911-2_44. [DOI] [PubMed] [Google Scholar]
- 7.Tachtsidis I, Leung TS, Tisdall MM, et al. Investigation of frontal cortex, motor cortex and systemic haemodynamic changes during anagram solving. Adv Exp Med Biol. 2008;614:21–28. doi: 10.1007/978-0-387-74911-2_3. [DOI] [PubMed] [Google Scholar]
- 8.Tachtsidis I, Leung TS, Chopra A, et al. False positives in functional near-infrared topography. Adv Exp Med Biol. 2009 doi: 10.1007/978-0-387-85998-9_46. In Press. [DOI] [PubMed] [Google Scholar]
- 9.Friston KJ, Holmes AP, Poline JB, et al. Analysis of fMRI time-series revisited. NeuroImage. 1995;2(1):45–53. doi: 10.1006/nimg.1995.1007. [DOI] [PubMed] [Google Scholar]


