Abstract
We have developed a novel, high-throughput approach to collecting randomly perturbed gene-expression profiles from the human genome.A human 293 cell library that stably expresses randomly chosen zinc-finger transcription factors was constructed, and the expression profile of each cell line was obtained using cDNA microarray technology.Gene expression profiles from a total of 132 cell lines were collected and analyzed by (1) a simple clustering method based on expression-profile similarity, and (2) the shortest-path analysis method.These analyses identified a number of gene groups, and further investigation revealed that the genes that were grouped together had close biological relationships.The artificial transcription factor-based random genome perturbation method thus provides a novel functional genomic tool for annotation and classification of genes in the human genome and those of many other organisms.
Systematic approaches to achieve rapid and accurate functional annotation of a large number of uncharacterized genes are urgently needed in this postgenomic era. Identifying the functions of gene products is also a critical step toward utilization of genomic information in the drug discovery process. A number of methods have been developed to identify the functions of novel genes. For example, methods for large-scale phenotypic analysis in yeast (Tong et al. 2001; Giaever et al. 2002) and fly (Spralding et al. 1999) have been developed for thousands of mapped mutants. Whereas these phenotype-based gene identification methods are useful, they are limited by the availability of easily scorable phenotypes of interest. In addition, large-scale mutant libraries do not exist for mammals, such as mice or humans.
Recent advances in the genome-wide gene expression-profiling technology using DNA microarrays have made this approach a powerful one for the high-throughput analysis of tens of thousands of genes. The gene expression profile of a specific gene is valuable because it is a signature of the state of the cell, such as its response to environmental stress or disease. To understand the function of a specific gene of interest, it is helpful to know the expression profile of that gene under a variety of conditions. Several studies have established that genes whose products have similar functions or are involved in different steps of the same pathway share similar expression profiles and can be grouped together on the basis of their expression signature (Eisen et al. 1998; Iyer et al. 1999). In other words, the expression of genes that function in a common process is highly coordinated in eukaryotes (Niehrs and Pollet 1999).
A pioneering study by Hughes et al. (2000) demonstrated the power of large-scale gene expression profiling to identify the functions of uncharacterized genes. They collected genome expression-profiling data from several hundreds of yeast mutants and constructed a reference database or “compendium” of expression profiles. The identification of coregulated groups of genes facilitated the functional annotation of novel genes and the identification of drug target pathways. Other studies showed that two genes that share similar expression profile are likely to constitute a functionally interacting pair (Ge et al. 2001; Kemmeren et al. 2002). To identify coregulated gene groups, large-scale gene expression analysis is required, so that one may discard background gene groups whose expression patterns are similar only under limited conditions.
Unlike for yeast, however, specific gene activation or deletion on a large scale in mammalian cells has been technically challenging. Several technologies that involve specific down-regulation of human genes have been developed, including antisense RNA (Cho et al. 2001), small interfering RNA (siRNA; Tuschl 2002), and ribozyme (Kawasaki et al. 2002) approaches. However, currently, there are no reports of these technologies being used for large-scale gene-disruption analysis in mammalian cells.
Recent advances in the field of artificial transcription-factor technology allow one to build tens of thousands of active transcription factors with ease (Segal and Barbas III 2001; Bae et al. 2003; Lee et al 2003). Zinc fingers are small DNA recognition motifs composed of ∼30 amino acid residues and a zinc ion. Each finger typically recognizes a 3-bp sequence, and three or more zinc fingers are tandemly linked to build a zinc finger protein (ZFP) that recognizes a stretch of nine or more base pairs. We built novel ZFPs by shuffling appropriate zinc fingers to match the DNA target sites of interest. Thus, unlike previous protocols, such as phage display selection, this approach is easily scalable. Thousands of highly active ZFPs can be constructed simultaneously. For example, shuffling 20 domains to make three-finger proteins would yield 8000 (= 20 × 20 × 20) ZFPs in a single step (Bae et al. 2003). ZFPs are then fused to either transcriptional activation domains, such as VP16 or p65 or repression domains such as KRAB, to build artificial transcription factors. Artificial transcription factors based upon ZFPs can regulate endogenous gene expression when introduced into cells. Use of these ZFP-based artificial transcription factors can provide efficient, high-throughput perturbation of the human genome.
In this study, we present a novel, high-throughput method with which to acquire functional genomic data. Our approach involves the building of a large-scale gene-expression profile database for the human genome. To achieve this, we have used a number of preassembled ZFP-transcription factors (ZFP-TFs). By performing large-scale microarray experiments with cell lines that express these ZFP-TFs, we demonstrate that each ZFP-TF regulates a distinct set of genes in the human genome, thus verifying that our method perturbs the gene expression program in an unbiased manner. The gene expression profiles obtained were then subjected to bioinformatic analyses to build a number of coregulated gene groups. Inspection of these groups identified a number of genes whose functional relationships were evident, proving the validity of this approach.
RESULTS
Random Genome Perturbation Using ZFP-TFs
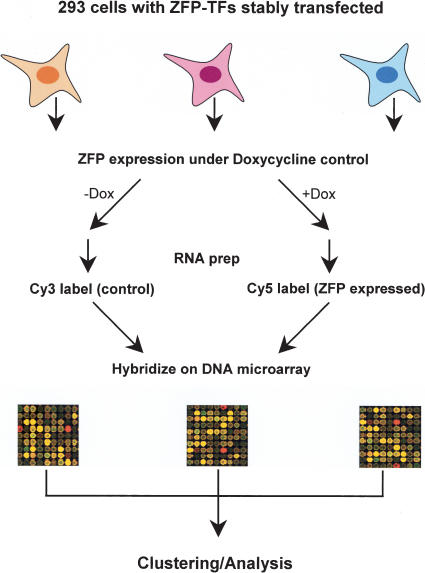
From a number of preassembled ZFP-TF collections in our laboratory, we randomly picked a group of ZFP-TFs, and then established stable HEK-293 cell lines that express each individual ZFP-TF in a Doxycycline (Dox)-dependent manner (Fig. 1). Therefore, upon the addition of Dox, a unique ZFP-TF is expressed, and in turn, it could regulate a unique set of genes. To obtain the global gene expression signature affected by each ZFP-TF, genome-scale gene analysis was performed for a total of 132 cell lines, using a cDNA microarray that contained 7458 known human genes (Fig. 1). The identities of ZFP-TFs used are shown in Supplemental Table 1, available online at www.genome.org.
Figure 1.
Experimental scheme. See the text for details.
Overall, different ZFP-TFs showed unique global gene expression signatures, in agreement with our hypothesis that random perturbation of the genome can be attained with randomly chosen ZFP-TFs (See clustergram in Supplemental Fig. 1). It should be noted that the gene expression profiles obtained by ZFP-TFs disappeared when we deleted functional domains or introduced mutations into the DNA-binding domains, which destroyed DNA-binding ability (Supplemental Fig. 2).
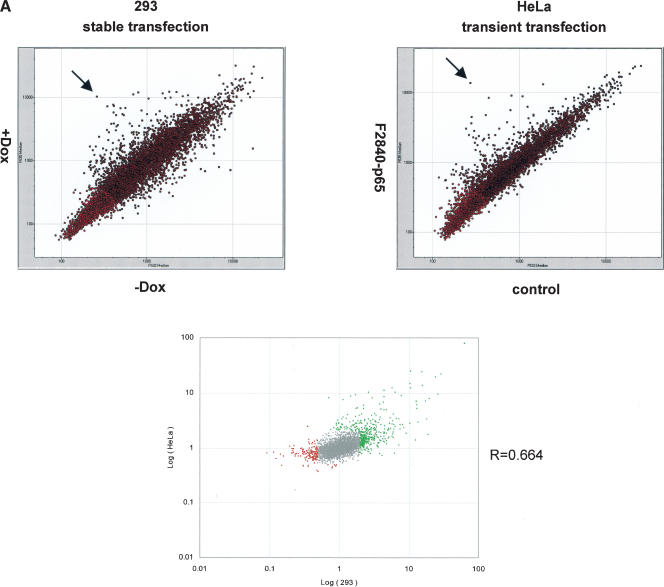
We then characterized some of the basic properties of gene regulation by several ZFP-TFs. First, we tested whether a particular transcription profile obtained with a given ZFP-TF was cell-type specific. To this end, we compared gene expression profiles generated by one ZFP-TF, F2840-p65, in the following cell types: (1) 293 cells, a noncancerous human embryonic kidney cell line that stably expressed the F2840-p65 ZFP-TF, and (2) HeLa cells, a human cervical carcinoma cell line, in which the F2840-p65 ZFP-TF was transiently transfected. Comparison of the microarray data revealed that the insulin gene was highly up-regulated in both cell lines (Fig. 2A, arrows). In addition, similar sets of genes were regulated in both cell types (Fig. 2A, bottom; Supplemental Table 2). However, we noted that there were also differences in the gene regulation pattern between 293 and HeLa cells (Supplemental Table 2), which may reflect differences in chromatin structure or DNA content (karyotype) between two cell lines. Another ZFP tested also showed similar, yet not identical expression profiles in 293 and HeLa cells (Supplemental Fig. 3). Thus, ZFP-TF appears to regulate resembling sets of genes when introduced into cell lines made from different cell types.
Figure 2.
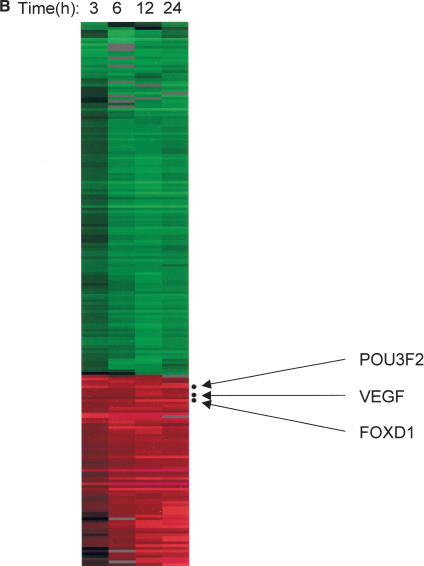
Characterization of a ZFP-TF-activated gene expression profile. (A) A gene expression profile obtained with a ZFP-TF in two different cell lines. A ZFP activator, F2840-p65, was either stably expressed in 293 cells (left) or transiently expressed in HeLa cells (right). In both experiments, insulin was highly expressed (marked by arrows). Dots colored in red were not subjected to analysis to avoid false results due to tailing. (Bottom) Plotting of the logarithmic expression ratios of each experiment and the correlation coefficient of two experiments. (B) Time-course analysis of gene expression driven by a ZFP-TF. A 293 cell line stably expressing a ZFP activator, F475-p65, was treated with Dox for the times stated. Genes identified as primary targets are marked.
Second, we performed a time-course experiment using one of our stable cell lines that expresses a ZFP transcriptional activator, F475-p65. Time-course analysis revealed induction of a few genes at early time point (Figs. 2B, 3 hrs), and an increase in the number of genes as time progresses (Fig. 2B). In addition to the time course experiment, we also performed ZFP-TF induction, followed by treatment of protein-translation inhibitor Cycloheximide (see Methods). Genes induced at all time points, and whose expression pattern is not significantly affected by Cycloheximide treatment, were considered as primary target genes. From this, we identified three genes (Fig. 2B; also see Supplemental Fig. 4). In silico analysis identified ZFP-binding sites in the proximal promoter region for all three genes analyzed (Supplemental Fig. 4). This ZFP-TF was designed originally to regulate VEGF in another study (Bae et al. 2003). In agreement with the previous study, VEGF was identified as a primary target in this analysis. Therefore, this method appears to be useful for identifying target genes of ZFP-TFs.
Figure 3.
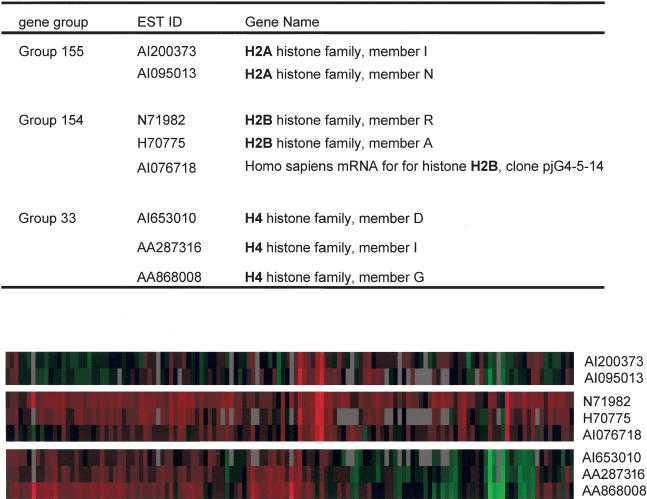
Histone gene groups. Numbers in gene groups are as in Supplemental Table 2. Clustering image of each group over 132 experiments is shown.
This result also suggests that a pathway analysis can be performed if time-course microarray experiments are performed for a number of ZFP-TF-expressing stable cell lines. Because ZFP-TF expression is tightly controlled by the addition of Dox, a rigorous time-course analysis is possible using our cell library system. This will eventually help in the building of a hierarchical map or transcriptional network of gene expression.
Analysis of ZFP-TF Expression-Profiling Data Set Reveals a Number of Gene Groups With Functional Relationships
The expression profile data set obtained from microarray experiments with 132 cell lines were analyzed to gain information on gene functions. First, we attempted to group genes with similar biological functions by clustering genes with similar expression profiles. Several clusters containing genes with similar functions, such as ribosomal genes, histone genes, or genes involved in RNA processing, were easily recognized by inspecting the Treeview images (Eisen et al. 1998; data not shown). These results were expected because of previous studies with large-scale microarray experiments (Eisen et al. 1998; Iyer et al. 1999; Niehrs and Pollet 1999; Hughes et al. 2000). To isolate novel groups of genes that showed a strong correlation in their expression profiles, we set a stringent criterion of a Pearson similarity coefficient of 0.85 or more between the genes, and only the gene groups that met this criterion were extracted (see Methods). By this approach, we were able to group 445 genes into 174 groups. The result of this analysis is shown in Supplemental Table 3. As expected, and consistent with the global clustering method (Eisen et al. 1998), several groups consisted of components of a gene family or protein complex, whose function could be easily identified. For example, cystatins C and S (Supplemental Table 3, group 11), metallothionein genes (group 107), and sulfotransferase family 1A members 2 and 3 (group 36) constituted a gene group. Gene groups that consisted of the melanoma antigen family 1A (groups 74 and 149), histone genes (groups 33, 154, and 155), and ribosomal genes (groups 61, 64, 80, and 98) were also observed.
We found that the analysis of our ZFP-TF-driven data set produced very precise groupings, as demonstrated by the histone clusters shown in Figure 3. Previous microarray studies have shown that all histone genes are grouped together, both in yeast and human cell lines (Eisen et al. 1998; Iyer et al. 1999). However, in our study, we were able to see histone genes grouped according to their subclasses (Fig. 3). The precise subgrouping of histone genes using our experimental approach combined with grouping analysis demonstrates the usefulness of this approach in categorizing genes with similar biological functions.
For the other gene groups, whose components did not, at first glance, show close functional relationships, we tried to identify any possible functional connection using an extensive search and study of the PUBMED literature database. We identified several gene groups to which we could assign putative functional relationships on the basis of their descriptions in the literature. Some of these groups are shown in Table 1. For example, ID4 and caspase 5 constitute a coregulated group with a Pearson coefficient of 0.85. From the literature search, we found that ID4 can induce apoptosis (Andres-Barquin et al. 1999). Because caspase 5 is a well-known pro-apoptotic gene, it is possible that these two genes are functionally related, playing important roles in the pro-apoptotic pathway. Another group consists of annexin A3, se20-4 tumor antigen, and myocilin (Table 1). Annexin is an inhibitor of phospholipase A2 (PLA-2) (Oh et al. 2000); se20-4 tumor antigen is the nucleolar TGF-β1 target protein (Ozbun et al. 2001); and myocilin is a trabecular meshwork-inducible glucocorticoid response protein (Polansky et al. 1997). As TGF-β1 and glucocorticoid attenuate IL1-β-induced PLA2 elevation (Muhl et al. 1992), these three genes might be common downstream targets of TGF-β or glucocorticoid signaling.
Table 1.
Coregulated Gene Groups With Functional Relationships
| EST ID | Gene name | Putative functional relationship |
|---|---|---|
| AI363200 | proenkephalin | Proenkephalin binds to G protein-coupled opioid receptors (Mansour et al. 1995). GAIP |
| AI363445 | G α interacting protein (GAIP) | is a regulator of G protein signaling (Berman et al. 1996). |
| AA464856 | inhibitor of DNA binding 4 | ID4 is known to induce apoptosis (Andres-Barquin et al. 1999). Caspase 5 is an |
| W60703 | caspase 5 | apoptosis-related cystein protease (Krippner-Heidenreich et al. 2001). |
| AI126424 | E2F-like protein | E2F-1 (Li and Baserga 1996) and Eps1 5R (Klapisz et al. 2002) are at the downstream of |
| AI92302 | eps1 5R | EGF signaling. |
| AI055825 | Low-affinity IgE Fc receptor | Fish odors or fumes cause allergic reaction through IgE-mediated hypersensitivity |
| AI251747 | odorant-binding protein 2B | (Crespo et al. 1995). |
| AA054073 | CEACAM6 | CEA/CEACAM6 and matrix metalloproteinases inhibit anoikis and enhance cell invasion |
| AA143331 | matrix metalloproteinase 1 | (Ordonez et al. 2000; Koul et al. 2001). |
| AI949576 | annexin A3 | Might be at common downstream of TGF-beta or glucocorticoid signaling. See text for |
| AI969825 | tumor antigen se20-4 | details. |
| AI971049 | myocilin | |
| AA422058 | methyltransferase-like 1 | DNA methylation inactivates metastasis suppressor genes (Lou et al. 1999). NM23B is |
| AA496628 | nonmetastatic cells 2, protein (NM23B) | found in reduced amount in tumor cells of high metastatic potential (Steeg et al. 1988) |
| AA398883 | squamous cell carcinoma antigen 1 | Cytokeratin 19 is a squamous cell carcinoma marker (Schneider et al. 2002). Therefore, |
| AA431080 | keratin, type II cytoskeletal 6A | both gene products might be markers of squamous cell carcinoma. |
The tight clustering of genes with similar function suggests that this method is successful in grouping genes with close biological relationships. It should be noted that because we set a highly stringent cut off value, many of the groups we obtained contained only a small number of genes.
Verification of Functional Relationships Using Shortest-Path Analysis
Next, we applied a recently developed shortest-path (SP) analysis method (Zhou et al. 2002) to analyze our gene expression profile data. This method considers transitive expression similarity among genes as an attribute to link genes within the same biological pathway. It has an advantage over traditional clustering approaches because it can group not only functionally related genes with similar expression profiles, but also those with different expression patterns (Zhou et al. 2002). Results of the SP analysis of our expression profile data set are shown in Supplemental Table 4. This analysis further extended the information we have obtained from simple clustering and grouping analysis.
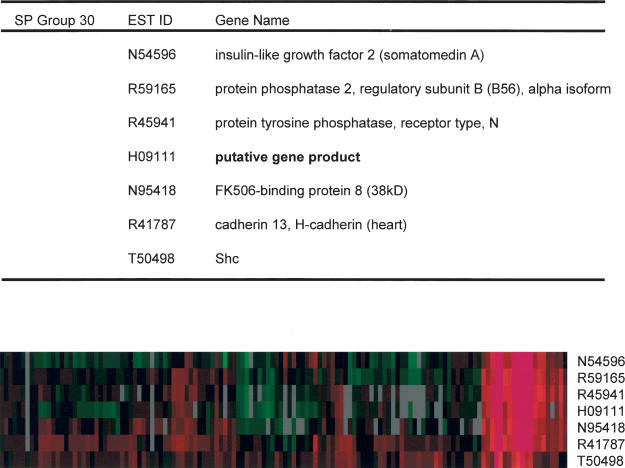
An example of SP analysis is shown in Figure 4, a gene cluster that includes insulin-like growth factor-2 (IGF-2). Although this gene cluster was also identified in the simple grouping method (Supplemental Table 3, group 17), SP analysis led to the identification of the Shc gene as a new member in this group. Thorough literature analysis revealed that the members of this gene cluster are functionally inter-related. First, it has been shown that protein phosphatase 2A (PP2A) is involved in the insulin/IGF-1 signal-transduction pathway (Ugi et al. 2002). The presence of IGF-2 and PP2A in the same SP group is consistent with the observation that PP2A participates in IGF-2 signaling. It has also been reported that the growth-factor signaling involves PP2A and an unidentified tyrosine phosphatase for MAP kinase inactivation (Alessi et al. 1995). The presence of receptor-protein tyrosine phosphatase N and PP2A in this group, along with IGF-2, is consistent with the possibility that these two phosphatases act together in the IGF-2-signaling pathway. This group also contains FKBP8, a member of FK506-binding protein (FKBP) family. In addition to FK506, FKBPs can also bind to rapamycin (Bierer et al. 1990). It has been reported recently that rapamycin can block IGF signaling by complexing with FKBP (Dilling et al. 1994). The presence of FKBP8 in the IGF-2 gene group suggests that this gene product has a potential role in mediating the effect of rapamycin in IGF-2 signaling. Physical interactions between members of this group have also been characterized. Shc is known to interact physically with PP2A (Ugi et al. 2002) and cadherin (Xu et al. 1997). Cadherins can also interact with a receptor-type protein tyrosine phosphatase (Brady-Kalnay et al. 1998), in agreement with the presence of both cadherin and receptor-type protein tyrosine phosphatase in the IGF-2 group (Fig. 4).
Figure 4.
IGF-2 cluster identified by SP analysis. SP group number is as in Supplemental Table 3.
This group also contains an uncharacterized gene (Fig. 4, putative gene product) with some similarity to the Drosophila furry gene (Cong et al. 2001). On the basis of extensive relationship among other members of this group and their role in IGF signaling, we predict that this uncharacterized gene will also play an important role in IGF signaling. Further experiments are required to determine the biological function of this protein.
Experimental Validation of Gene Groups: Spi-B-Melanoma Antigens
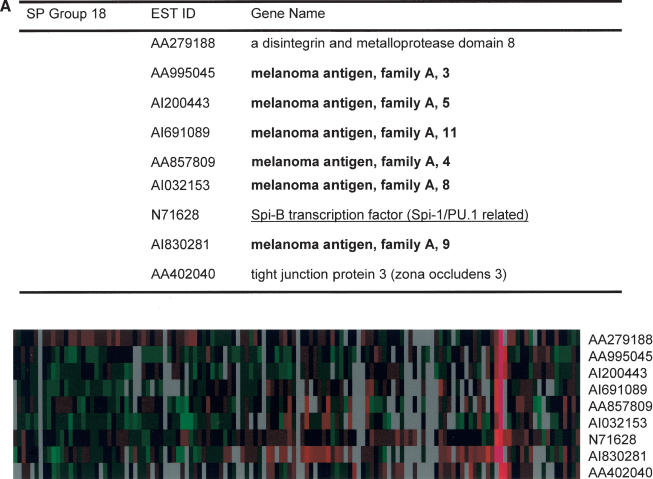
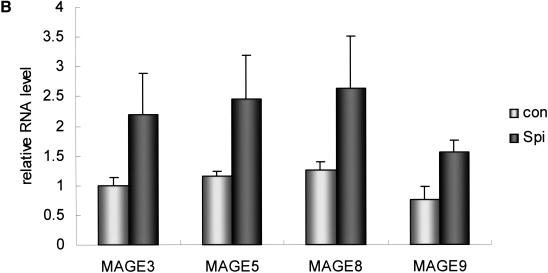
Another SP group contained members of the melanoma antigen family A (Fig. 5A), suggesting that these genes are coordinately regulated. This coordinated regulation can be explained by the existence of a common transcriptional regulator. We noticed that Spi-B, PU.1-related transcription factor, was also included in this group. Therefore, we asked whether Spi-B is the master regulator of melanoma antigen family-A expression. For this, we cloned the Spi-B gene in a pcDNA3 mammalian expression vector, then transfected this vector into 293 cells. For the melanoma antigen family genes that we analyzed (MAGE-3, MAGE-5, MAGE-8, and MAGE-9), induction of mRNA level was observed upon transfection of the Spi-B expression vector (Fig. 5B). Inspection of the promoter regions of MAGE-3, MAGE-5, MAGE-8, and MAGE-9 revealed the presence of Spi-B-binding sites (Supplemental Fig. 5). Therefore, SP analysis of a ZFP-TF-derived gene expression data set revealed a novel transcriptional regulator of the family of melanoma antigen-A genes.
Figure 5.
Activation of MAGE family by the Spi-B transcription factor. (A) MAGE cluster identified by SP analysis. (B) Up-regulation of MAGE genes by Spi-B. The 293 cells were transiently transfected with either an empty vector (con) or a vector expressing Spi-B (Spi). At 48-hour post-transfection, cells were harvested and RNAs prepared for real-time PCR analysis. Results are the average of two experiments, each performed in duplicate.
DISCUSSION
In this report, we demonstrated that the human genome can be randomly perturbed by ZFP-TFs, and that the resulting expression profiles can provide novel information about the function of genes. Using conventional clustering, on the basis of expression profile similarity and the recently introduced SP analysis, we were able to identify many groups of genes with close functional relationships. SP analysis of ZFP-TF-derived expression data sets also revealed Spi-B as a novel regulator of the melanoma antigen gene family, and this prediction was verified experimentally.
There are important advantages of using ZFP-TFs as genome-wide regulators of gene expression. First, ZFP-TFs can be used to both down-regulate and up-regulate target genes. Therefore, compared with the antisense or RNAi approach, in which only down-regulation is possible, ZFP-TFs should allow a more comprehensive analysis of coclustered genes.
Second, the number of finger domains included in the ZFP-TF can regulate the specificity of ZFP. Depending upon whether three- or six-finger ZFPs are used, the number of regulated genes in a cell varies. Three- or four-finger proteins, as used in this study, are not highly specific; they can modulate several genes when introduced into cells. Whereas this could be a disadvantage in terms of specific regulation, in cases in which a large number of gene perturbations are required, it is an advantage. For example, a gene expression profile obtained from a single ZFP-TF with broad specificity can reveal information about several genetic pathways, and this information can be easily categorized with the use of bioinformatic analyses. This is a clear advantage over the antisense or RNAi approach, in which the number of antisense or RNAi molecules required to regulate the entire genome is theoretically the same as the number of genes in the genome.
Third, the universality of transcription-factor action makes this strategy easily applicable to many other eukaryotic and prokaryotic genomes.
In addition to the multiple gene regulation by ZFP-TFs, there may be other reasons why our ZFP-TF-based random perturbation method was successful in identifying a number of coregulated gene groups with a relatively few experiments. For example, by affecting different genes in the same gene group, one would get similar patterns of gene perturbation. This would reduce the number of perturbing agents required to obtain coregulated gene groups. In fact, the work by Hughes et al (2000) in yeast clearly demonstrates that affecting different genes in the same pathway produces similar expression signatures. It is also possible that some ZFP-TFs might have targeted transcription factors, which would provide a complex gene expression signature. That would help increase the complexity of overall information to be analyzed.
We also note the limitation of our approach. As we set a highly stringent cut-off value to discard false positives, the majority of gene groups consist only of a pair of genes. Therefore, many true associations among multiple genes could have been missed.
Overall, we have shown the utility of ZFP-TF-based microarray technology in identifying novel functional relationships among genes. More array experiments, along with the use of microarray chips that cover the entire human genome, would be required for a complete functional analysis of the human genome. In addition, time-course expression experiments for each cell line will provide another level of information, which will eventually help in building pathway maps of human cellular gene expression.
METHODS
Construction of Stable Cell Lines That Express ZFP-TFs
We selected ZFP-TFs from our premade collection without any bias or preference. Human embryonic kidney (HEK) cell lines stably expressing ZFP-TFs were generated as follows: Plasmids encoding ZFP-TFs were stably introduced into FlpTRex-293 cell lines (Invitrogen) essentially as described in the manufacturer's protocol. Briefly, the HindIII-XhoI fragment from the pLFD-p65, pLFD-VP16, or pLFD-Kid vectors (Bae et al. 2003), which contain DNA segments that encode ZFP-TFs, were subcloned individually into pcDNA5/FRT/TO (Invitrogen). The resulting plasmids were cotransfected along with pOG44 (Invitrogen) into FlpTRex-293 cells to induce a site-specific integration event. Stable integrants were then screened. The resulting cell lines expressed ZFP-TFs upon the addition of Dox. A total of 132 cell lines were subjected to gene expression microarray experiments. The identities of ZFP-TFs used for the experiments are shown in Supplemental Table 1. It should be noted that for some cell lines, we isolated stable clones after random transfection. Thus, the identities of ZFP-TFs are not known.
DNA Microarray
DNA microarrays containing 7458 human EST clones, including 215 unassigned ESTs and 20 ESTs of putative genes, were provided by Genomic Tree, Inc. FlpTRex-293 cells that stably expressed ZFP-TFs were cultured with (+Dox) or without (-Dox) 1 μg/mL Dox for 48 h. The total RNA was prepared from each sample. RNA from a -Dox sample was used as the reference (Cy3), and RNA from a +Dox sample constituted the experimental (Cy5) sample. Microarray experiments were performed according to the manufacturer's protocol. For HeLa cell microarray experiments, a pLFD-p65/F2840 plasmid, which is an expression vector encoding the F2840-p65 ZFP-TF, was transiently transfected into HeLa cells using the Lipofectamine Plus (Invitrogen) reagent, and for the control, pLFD-p65 alone without the ZFP-TF was transfected.
In the Cycloheximide experiment, Dox treatment in cells was carried out for 3 h, after which they were cultured for an additional 3 h with 20 μg/mL cycloheximide. This sample was compared with the sample collected after a 6-hour culture in the presence of Dox, but without cycloheximide treatment. Also, 6 h after Dox treatment in cells, They were cultured with 20 μg/mL cycloheximide for another 6 h. Similarly, this sample was compared with the sample cultured for 12 h with Dox alone. To identify primary target genes, genes induced at all time points and whose increase were not significantly decreased by cycloheximide treatment, were considered as primary target genes. Other induced genes at any time point were considered as secondary effects.
Data Analysis
CLUSTER and TREEVIEW programs (Eisen et al. 1998) were used for global hierarchical, average-linkage clustering. Only genes that are up- or down-regulated greater than twofold in one or more experiments and present in >70% of the experiments, were subjected to further analysis.
To isolate gene groups with strong similarities in their expression profiles, we processed the data with the following algorithm.
A gene, that is not included in any group, is selected to form a temporary group T.
The Pearson similarity coefficient is calculated for all genes in the T group, as well as for the rest of genes not included in any group. If the similarity is greater than the cutoff (initially 100%), we include the compared gene in the T group.
If the T group has more than two genes, we consider it to be a new group.
Repeat 1 and 3 until there are no genes left to be included in the group.
Next, at step 2, decrease the cutoff by 5% and repeat steps 1-4 until no genes are left (that is, not included in any group).
SP analysis was performed essentially as described in Zhou et al. (2002).
The detailed information on microarray data analysis and clustergrams of individual groups are available at www.toolgen.com.
Experimental Validation
The Spi-B transcription factor was cloned using PCR and subcloned into the pcDNA3 vector (Invitrogen) to generate pcDNA3-SpiB. pcDNA3-SpiB was then transiently transfected into 293 cells, and 48 h after transfection, cells were harvested and the total RNA was prepared. Real-time PCR was performed according to the manufacturer's protocol (Corvette Research). The sequences of primers used for the real-time PCR experiments are available upon request.
Acknowledgments
We thank the members of Toolgen laboratory for their support, and Drs. H.C. Shin, K.H. Bae, W. Seol, and K.-S. Park for providing materials. We also thank K. LaMarco and C. Sohn for carefully reading our manuscript. This work was partially supported by the National Research Laboratory Program (MI-0104-00-0048).
The publication costs of this article were defrayed in part by payment of page charges. This article must therefore be hereby marked “advertisement” in accordance with 18 USC section 1734 solely to indicate this fact.
Article and publication are at http://www.genome.org/cgi/doi/10.1101/gr.1397903.
Footnotes
References
- Alessi, D.R., Gomez, N., Moorhead, G., Lewis, T., Keyse, S.M., and Cohen, P. 1995. Alternating phases of FGF receptor and NGF receptor expression in the developing chicken nervous system. Curr. Biol. 5: 283-295.7780739 [Google Scholar]
- Andres-Barquin, P.J., Hernandez, M.C., and Israel, M.A. 1999. Id4 Expression induces apoptosis in astrocytic cultures and is down-regulated by activation of the cAMP-dependent signal transduction pathway. Exp. Cell. Res. 247: 347-355. [DOI] [PubMed] [Google Scholar]
- Bae, K.H., Kwon, Y.D., Shin, H.-C., Hwang, M.-S., Ryu, E.-H., Park, K.-S., Yang, H.-Y., Lee, D.-k., Lee, Y., Park, J. et al. 2003. Use of human zinc fingers as modular building blocks in the construction of artificial transcription factors. Nat. Biotech. 21: 275-280. [DOI] [PubMed] [Google Scholar]
- Berman, D.M., Wilkie, T.M., and Gilman, A.G. 1996. GAIP and RGS4 are GTPase-activating proteins for the Gi subfamily of G protein α subunits. Cell 86: 445-452. [DOI] [PubMed] [Google Scholar]
- Bierer, B.E., Somers, P.K., Wandless, T.J., Burakoff, S.J., and Schreiber, S.L. 1990. Probing immunosuppressant action with a nonnatural immunophilin ligand. Science 250: 556-559. [DOI] [PubMed] [Google Scholar]
- Brady-Kalnay, S.M., Mourton, T., Nixon, J.P., Pietz, G.E., Kinch, M., Chen, H., Brackenbury, R., Rimm, D.L., Del Vecchio, R.L., and Tonks, N.K. 1998. Dynamic interaction of PTPμ with multiple cadherins in vivo. J. Cell. Biol. 141: 287-296. [DOI] [PMC free article] [PubMed] [Google Scholar]
- Cho, Y.S., Kim, M.-K., Cheadle, C., Neary, C., Becker, K.G., and Cho-Chung, Y.S. 2001. Antisense DNAs as multisite genomic modulators identified by DNA microarray. Proc. Natl. Acad. Sci. 98: 9819-9823. [DOI] [PMC free article] [PubMed] [Google Scholar]
- Cong, J., Geng, W., He, B., Liu, J., Charlton, J., and Adler, P.N. 2001. The furry gene of Drosophila is important for maintaining the integrity of cellular extensions during morphogenesis. Development 128: 2793-2802. [DOI] [PubMed] [Google Scholar]
- Crespo, J.F., Pascual, C., Dominguez, C., Ojeda, I., Munoz, F.M., and Esteban, M.M. 1995. Allergic reactions associated with airborne fish particles in IgE-mediated fish hypersensitive patients. Allergy 50: 257-261. [DOI] [PubMed] [Google Scholar]
- Dilling, M.B., Dias, P., Shapiro, D.N., Germain, G.S., Johnson, R.K., and Houghton, P.J. 1994. Rapamycin selectively inhibits the growth of childhood rhabdomyosarcoma cells through inhibition of signaling via the type I insulin-like growth factor receptor. Cancer Res. 54: 903-907. [PubMed] [Google Scholar]
- Eisen, M.B., Spellman, P.T., Brown, P.O., and Botstein, D. 1998. Cluster analysis and display of genome-wide expression patterns. Proc. Natl. Acad. Sci. 95: 14863-14868. [DOI] [PMC free article] [PubMed] [Google Scholar]
- Ge, H., Liu, Z., Church, G.M., and Vidal, M. 2001. Correlation between transcriptome and interactome mapping data from Saccharomyces cerevisiae. Nat. Genet. 29: 482-486. [DOI] [PubMed] [Google Scholar]
- Giaever, G., Chu, A.M., Connelly, C., Riles, L., Veronneau, S., Dow, S., Lucau-Danila, A., Anderson, K., Andre, B., et al. 2002. Functional profiling of the Saccharomyces cerevisiae genome. Nature 418: 387-391. [DOI] [PubMed] [Google Scholar]
- Hughes, T.R., Marton, M.J., Jones, A.R., Roberts, C.J., Stoughton, R., Armour, C.D., Bennet, H.A., Coffey, E., Dai, H., He, Y., et al. 2000. Functional discovery via a compendium of expression profiles. Cell 102: 109-126. [DOI] [PubMed] [Google Scholar]
- Iyer, V.R., Eisen, M.B., Ross, D.T., Schuler, G., Moore, T., Lee, J.C.F., Trent, J.M., Staudt, L.M., Hudson Jr., J., Boguski, M.S., et al. 1999. The transcriptional program in the response of human fibroblasts to serum. Science 283: 83-87. [DOI] [PubMed] [Google Scholar]
- Kawasaki, H., Onuki, R., Suyama, E., and Taira, K. 2002. Identification of genes that function in the TNF-α-mediated apoptotic pathway using randomized hybrid ribozyme libraries. Nat. Biotech. 20: 376-380. [DOI] [PubMed] [Google Scholar]
- Kemmeren, P., van Berkum, N.L., Vilo, J., Bijma, T., Donders, R., Brazma, A., and Holstege, F.C.P. 2002. Protein interaction verification and functional annotation by integrated analysis of genome-scale data. Mol. Cell 9: 1133-1143. [DOI] [PubMed] [Google Scholar]
- Klapisz, E., Sorokina, I., Lemeer, S., Pijnenburg, M., Verkleij, A.J., and van Bergen en Henegouwen, P.M. 2002. A ubiquitin-interacting motif (UIM) is essential for Eps15 and Eps15R ubiquitination. J. Biol. Chem. 277: 30746-30753. [DOI] [PubMed] [Google Scholar]
- Koul, D., Parthasarathy, R., Shen, R., Davies, M.A., Jasser, S.A., Chintala, S.K., Rao, J.S., Sun, Y., Benvenisite, E.N., Liu, T.-J., et al. 2001. Suppression of matrix metalloproteinase-2 gene expression and invasion in human glioma cells by MMAC/PTEN. Oncogene 20: 6669-6678. [DOI] [PubMed] [Google Scholar]
- Krippner-Heidenreich, A., Talanian, R.V., Sekul, R., Kraft, R., Thole, H., Ottleben, H., and Luscher, B. 2001. Targeting of the transcription factor Max during apoptosis: Phosphorylation-regulated cleavage by caspase-5 at an unusual glutamic acid residue in position P1. Biochem. J. 358: 705-715. [DOI] [PMC free article] [PubMed] [Google Scholar]
- Lee, D.-k., Seol, W., and Kim, J.-S. 2003. Custom DNA-binding proteins and artificial transcription factors. Curr. Top. Med. Chem. 3: 645-657. [DOI] [PubMed] [Google Scholar]
- Li, S. and Baserga, R. 1996. Epidermal growth factor and platelet-derived growth factor regulate the activity of the insulin-like growth factor I gene promoter. Exp. Gerontol. 31: 195-206. [DOI] [PubMed] [Google Scholar]
- Lou, W., Krill, D., Dhir, R., Becich, M.J., Dong, J.T., Frierson Jr., H.F. Isaacs, W.B., and Gao, A.C. 1999. Methylation of the CD44 metastasis suppressor gene in human prostate cancer. Cancer Res. 59: 2329-2331. [PubMed] [Google Scholar]
- Mansour, A., Hoversten, M.T., Taylor, L.P., Watson, S.J., and Akil, H. 1995. The cloned μ, δ and κ receptors and their endogenous ligands: Evidence for two opioid peptide recognition cores. Brain Res. 700: 89-98. [DOI] [PubMed] [Google Scholar]
- Muhl, H., Geiger, T., Pignat, W., Marki, F., van den Bosch, H., Cerletti, N., Cox, D., McMaster, G., Vosbeck, K., and Pfeilschifter, J. 1992. Transforming growth factors type- and dexamethasone attenuate group II phospholipase A2 gene expression by interleukin-1 and forskolin in rat mesangial cells. FEBS Lett. 301: 190-194. [DOI] [PubMed] [Google Scholar]
- Niehrs, C. and Pollet, N. 1999. Synexpression groups in eukaryotes. Nature 402: 483-487. [DOI] [PubMed] [Google Scholar]
- Oh, J., Rhee, H.J., Kim, S., Kim, S.B., You, H., Kim, J.H., and Na, D.S. 2000. Annexin-I inhibits PMA-induced c-fos SRE activation by suppressing cytosolic phospholipase A2 signal. FEBS Lett. 477: 244-248. [DOI] [PubMed] [Google Scholar]
- Ordonez, C., Screaton, R.A., Ilantzis, C., and Stanners, C.P. 2000. Human carcinoembryonic antigen functions as a general inhibitor of anoikis. Cancer Res. 60: 3419-3424. [PubMed] [Google Scholar]
- Ozbun, L.L., You, L., Kiang, S., Angdisen, J., Martinez, A., and Jakowlew, S.B. 2001. identification of differentially expressed nucleolar TGF-β1 Target (DENTT) in human lung cancer cells that is a new member of the TSPY/SET/NAP-1 superfamily. Genomics 73: 179-193. [DOI] [PubMed] [Google Scholar]
- Polansky, J.R., Fauss, D.J., Chen, P., Chen, H., Lutjen-Drecoll, E., Johnson, D., Kurtz, R.M., Ma, Z.D., Bloom, E., and Nguyen, T.D. 1997. Cellular pharmacology and molecular biology of the trabecular meshwork inducible glucocorticoid response gene product. Ophthalmologica 211: 126-139. [DOI] [PubMed] [Google Scholar]
- Schneider, J., Bitterlich, N., Velcovsky, H.G., Morr, H., Katz, N., and Eigenbrodt, E. 2002. Fuzzy logic-based tumor-marker profiles improved sensitivity in the diagnosis of lung cancer. Int. J. Clin. Oncol. 7: 145-151. [DOI] [PubMed] [Google Scholar]
- Segal, S.J. and Barbas III, C.F. 2001. Custom DNA-binding proteins come of age: Polydactyl zinc-finger proteins. Curr. Opin. Biotech. 12: 632-637. [DOI] [PubMed] [Google Scholar]
- Spralding, A.C., Stern, D., Beaton, A., Rhem, E.J., Laverty, T., Mozden, N., Misra, S., and Rubin, G.M. 1999. The Berkeley Drosophila genome project gene disruption project: Single P-element insertions mutating 25% of vital Drosophila genes. Genetics 153: 135-177. [DOI] [PMC free article] [PubMed] [Google Scholar]
- Steeg, P.S., Bevilacqua, G., Pozzatti, R., Liotta, L.A., and Sobel, M.E. 1988. Altered expression of NM23, a gene associated with low tumor metastatic potential, during adenovirus 2 Ela inhibition of experimental metastasis. Cancer Res. 48: 6550-6554. [PubMed] [Google Scholar]
- Tong, A.H.Y., Evangelista, M., Parsons, A.B., Xu, H., Bader, G.D., Page, N., Robinson, M., Raghibizadeh, S., Hogue, C.W.V., Bussey, H., et al. 2001. Science Systematic genetic analysis with ordered arrays of yeast deletion mutants. 294: 2364-2368. [DOI] [PubMed] [Google Scholar]
- Tuschl, T. 2002. Expanding small RNA interference. Nat. Biotech. 20: 446-448. [DOI] [PubMed] [Google Scholar]
- Ugi, S., Imamura, T., Ricketts, W., and Olefsky, J.M. 2002. Protein phosphatase 2A forms a molecular complex with Shc and regulates Shc tyrosine phosphorylation and downstream mitogenic signaling. Mol. Cell. Biol. 22: 2375-2387. [DOI] [PMC free article] [PubMed] [Google Scholar]
- Xu, Y., Guo, D.-F., Davidson, M., Inagami, T., and Carpenter, G. 1997. Interaction of the adaptor protein Shc and the adhesion molecule cadherin. J. Biol. Chem. 272: 13463-13466. [DOI] [PubMed] [Google Scholar]
- Zhou, X., Kao, M.-C.J., and Wong, W.H. 2002. Transitive functional annotation by shortest-path analysis of gene expression data. Proc. Natl. Acad. Sci. 99: 12783-12788. [DOI] [PMC free article] [PubMed] [Google Scholar]
WEB SITE REFERENCES
- www.toolgen.com; Detailed information on microarray data.


