

Abstract
Reduced growth hormone (GH) action is associated with extended longevity in many vertebrate species. GH receptor (GHR) null (GHR−/−) mice, which have a disruption in the GHR gene, are a well-studied example of mice that are insulin sensitive and long lived yet obese. However, unlike other mouse lines with reduced GH action, GH receptor antagonist (GHA) transgenic mice have reduced GH action yet exhibit a normal, not extended, life span. Understanding why GHA mice do not have extended life span though they share many physiological attributes with GHR−/− mice will help provide clues about how GH influences aging. For this study, we examined age- and sex-related changes in body composition, glucose homeostasis, circulating adipokines, and tissue weights in GHA mice and littermate controls. Compared with previous studies with GHR−/− mice, GHA mice had more significant increases in fat mass with advancing age. The increased obesity resulted in significant adipokine changes. Euglycemia was maintained in GHA mice; however, hyperinsulinemia developed in older male GHA mice. Overall, GHA mice experience a more substantial, generalized obesity accompanied by altered adipokine levels and glucose homeostasis than GHR−/− mice, which becomes more exaggerated with advancing age and which likely contributes to the lack of life-span extension in these mice.
Key Words: Body composition, Growth hormone, Leptin, Obesity, Aging, Adipose depots, Sex differences
THE growth hormone (GH)/insulin-like growth factor-1 axis is negatively associated with life span in many species (1). Importantly, there is emerging evidence that this axis might also be involved in human aging (2–4). Comparing and contrasting the physiological traits and molecular pathways that are altered with reductions or deficiencies in this axis will undoubtedly result in a better understanding of the aging process. Many recent reviews have attempted such comparisons or have summarized general characteristics of these long-lived animals ranging from worms to mice (1,4–10).
Mutant mouse strains have proven to be a useful tool to explore the impact of the growth hormone/insulin-like growth factor-1 axis on aging. Complete or near complete removal of GH or its receptor extends life span as demonstrated in several mouse lines. For example, Snell, Ames, Lit/Lit, and GH receptor knockout (GHR−/−) dwarf mice, which have little or no GH signaling, are viable and exhibit a notable extension in life span (11–14). As might be expected, these mice also have very low levels of circulating insulin-like growth factor-1 (IGF-1) and insulin as well as marked improvements in insulin sensitivity (7–9). Interestingly, these long-lived mice also are relatively obese (15–18), a trait more commonly associated with insulin resistance and a decreased life span. Of note, the increase in adiposity found in these animals is not uniform among fat depots. Most of these parameters have been most carefully assessed in the GHR−/− mice, which have a global disruption in the GHR gene. Although intraabdominal fat pads of GHR−/− mice are proportional or diminished in size compared with similar fat pads in control mice, the subcutaneous fat pads are significantly enlarged in both male and female GHR−/− mice (15,19–21). Thus, there appears to be a preferential accumulation of excess fat in the subcutaneous depots, which is thought to have metabolically beneficial effects in these long-lived mice and that may contribute to their counterintuitive association between obesity and life span.
Not all mouse strains with reduced GH or IGF-1 action show improvements in life span. One example is GH receptor antagonist (GHA) transgenic mice, which were generated in our laboratory more than 20 years ago (22–24). This discovery led to the development of the drug Somavert that is now used for the treatment of acromegaly (25). The GHA expressed in these mice contains a lysine in place of glycine at position 119 (22–24) in the bGH protein. This single substitution results in the production of a protein that competes with endogenous GH for GHR binding and results in a marked reduction, but not elimination, of GH-induced intracellular signaling.
Although not as fully characterized, GHA mice share some features with other GH-deficient or resistant/insensitive mice. Indeed, several reports directly compare the phenotype of GHA mice with that of GHR−/− mice, making this strain the most useful for comparison (14,15). In these studies, male GHA mice have reduced levels of IGF-1 and are dwarf although the phenotype is not as dramatic as that of GHR−/− male mice (14). Of note, although male GHA mice remain dwarf and weigh significantly less in early life, GHA mice start to catch up to littermate controls in body weight by approximately 44 weeks of age (14). The contribution of lean versus fat mass to this catch-up growth has not been assessed. Like GHR−/− mice, young adult male GHA mice are also obese with elevated leptin levels along with a specific enlargement of the subcutaneous depot (15,26,27). However, unlike the very insulin-sensitive GHR−/− mice, GHA male mice do not exhibit significant improvements in glucose homeostasis, maintaining relatively normal fasting blood glucose and serum insulin levels up to almost 1 year of age (14). These key phenotypic differences (dwarf, obese, insulin-sensitive, long-lived phenotypes in GHR−/− mice vs dwarf, obese, with normal insulin sensitivity and life span in GHA mice) likely provide clues as to the distinguishing features important for life-span extension.
GHA mice offer an interesting exception to the trend of long-lived GH-deficient or resistant/insensitive mice. Based on previous longitudinal data in GHR−/− mice (14,16), a careful assessment of body composition and glucose homeostasis in GHA mice, especially with more advanced age, may provide insight into this exception. To date, no studies have assessed these parameters in older GHA mice or in female GHA mice. Thus, the purpose of this study was to track changes in body weight, body composition, adipokine levels, and several parameters related to glucose homeostasis with advancing age in both sexes of GHA mice and, where appropriate, to compare these results to those reported previously for long-lived GHR−/− mice (16). The findings of this study will help discern the characteristics important for life-span extension.
Methods
Animal Description and Care
GHA mice have been described previously (22–24). Briefly, the transgenic mice express the bovine GHA minigene (glycine at position 119 of bGH is replaced with lysine) driven by a mouse metallothionein-I transcriptional regulatory element. The mice used in this study have been backcrossed for more than 20 generations into a C57BL/6J background. For all analyses, 11 male GHA mice, 11 male wild-type (WT) littermates, 8 female GHA mice, and 9 female WT littermate controls were used. Mice were housed 2–3 per cage, with a 10-hour light/14-hour dark cycle, temperature control at 22±2°C and had ad-libitum access to standard rodent chow (Prolab RMH 3000; PMI Nutrition International, Inc., Brentwood, NJ; 14% kcalories from fat, 16% from protein, and 60% from carbohydrates). All mice were studied from 6 weeks until 82 weeks of age. All protocols were approved by the Ohio University Institutional Animal Care and Use Committee and followed all the federal, state, and local guidelines.
Body Weight and Body Composition Analysis
Body weight and body composition measurements were conducted every 2 weeks from 6 to 24 weeks of age and every 4 weeks thereafter until Week 80. One measurement at 56 weeks was inadvertently not performed. Body composition measurements were determined on live, unanesthetized mice using Minispec mq benchtop nuclear magnetic resonance analyzer (Bruker Instruments, Billerica, MA) as previously described (16,28). Body composition for all mice was assessed in duplicate at each time point.
Measurement of Fasting Blood Glucose and Plasma Hormone Levels
Fasting blood glucose and hormone levels were measured at five time points (8, 13, 26, 52, and 72 weeks of age) in the same mice analyzed for body composition. One day after body composition measurements, mice were fasted for 12 hours, and blood was collected from the tail tip within a 2-hour time frame starting at 9 am. Fasting blood glucose levels were determined using the first drop of blood collected from the tip of the tail to minimize stress-induced changes in glucose levels. A LifeScan OneTouch glucometer and OneTouch ultra test strips (LifeScan, Inc., Milpitas, CA) were used to measure blood glucose. Blood was centrifuged at 4°C to isolate the plasma, which was then stored at −80°C until future use.
Plasma leptin concentrations were determined using R&D Systems Mouse Leptin ELISA kit (PMOB00, Minneapolis, MN). Insulin levels were measured using the Mouse Ultrasensitive Insulin ELISA kit from ALPCO Diagnostics (80-INSMSU-E01, Salem, NH). The intraassay coefficients of variation for leptin and insulin measurements were 3.8% and 4.2%, respectively. Total and high molecular weight (HMW) adiponectin levels for this same cohort of mice were measured using Adiponectin (Mouse) HMW and Total Adiponectin ELISAs distributed by ALPCO Diagnostics (catalog number 47-ADPMS-E01) (26,29) as reported previously (30).
Glucose Tolerance Test
Glucose tolerance tests were performed at 73 weeks of age. Mice were fasted for 12 hours prior to the measurements, which began at 9 am. Interperitoneal injections of 0.01mL 10% glucose in phosphate-buffered saline per gram body weight were administered. Glucose measurements were performed using a LifeScan OneTouch glucometer and test strips (LifeScan, Inc.) before glucose injection and at 30, 60, 90, and 120 minutes after injection.
Tissue Weights
All mice were sacrificed at 82 weeks of age and four fat pads (inguinal subcutaneous, retroperitoneal, mesenteric, and perigonadal) along with major organs (heart, spleen, kidney, liver, and gastrocnemius muscle) were collected and weighed. All tissues were then flash-frozen in liquid nitrogen and stored at −80°C for future analysis.
Liver Triglyceride Measurements
Liver triglyceride content was measured following triglyceride extraction using the Triglycerides-GPO reagent (Pointe Scientific, Canton, MI) as described previously (16,28,31).
Statistical Analysis
Data were analyzed using Statistical Package for the Social Sciences (SPSS version 16.0, 2008; IBM, Armonk, NY). Data are presented as mean ± SEM. Data for body weight, body composition, hormone levels, and glucose were subjected to two-way repeated measures analysis of variance (Genotype × Sex). A two-way analysis of variance (Genotype × Sex) was used for the remaining parameters (eg, liver triglycerides, tissue weights) along with t tests for select comparisons. Sphericity was tested using Mauchly’s method, and a Greenhouse–Geisser correction was applied when the assumption of sphericity was not met (p < .05). When significant differences were found between genotypes or age groups, Tukey’s HSD post hoc tests were performed. Correlations were evaluated using the Pearson test. Results were considered significant if p < .05.
Results
Body Weight
The mean body weights of GHA mice of both sexes were less than the age-matched control littermates at younger ages (Figure 1). For example, weights of male and female GHA mice were 68% and 66% of age- and sex-matched littermate controls, respectively, at the initial 8-week time point. However, a sex difference in body weights was noted with advancing age. Specifically, male GHA mice had significantly lower body weights than WT males until 52 weeks, but thereafter, no statistical difference was observed. In contrast, female GHA mice had significantly lower body weights (ranging from 66% to 81% of female littermate controls) throughout the study.
Figure 1.

Size comparison of wild-type (WT) and GH receptor antagonist (GHA) mice. (A) Shown are representative mice from the cohort of a male and female WT and dwarf GHA transgenic mice analyzed in this study. The image was taken at 76 weeks of age. (B) Body weight of GHA mice and WT mice over time is shown. Data are expressed as mean ± SEM, n = 11 (male GHA), n = 11 (male WT), n = 8 (female GHA), and n = 9 (female WT). Two-way repeated measures analysis of variance test for body weight revealed there was significant effect of genotype (F(1,36) = 63.736, p < .001) and sex (F(1,36) = 103.885, p < .001) but not for genotype–sex interaction (F(1,36) = 1.608, p > .05).
Body Composition
GHA mice of both sexes had an increase in absolute fat mass (Figure 2A). Male GHA mice showed significantly greater fat mass compared with sex-matched littermate controls, reaching a maximum of 240% of controls at 72 weeks. Like male GHA mice, female GHA mice also showed increased absolute fat mass compared with controls, but this increase was not as dramatic as observed in male GHA mice. Because the absolute fat mass can be somewhat misleading due to the dwarf size of the GHA mice, percent fat mass was also assessed by normalizing total fat mass to body weight. Male and female GHA mice had significantly greater percent fat mass than WT littermate controls throughout the study with a significant effect of genotype (F(1,35) = 63.63, p = 1.8 × 10⁻⁹). For example, 40% and 33% of the total body weight of male and female GHA mice, respectively, was attributed to fat by 68 weeks of age compared with 17% for both control males and females of the same age.
Figure 2.

Body composition of GH receptor antagonist (GHA) and wild-type (WT) mice over time. Shown is (A) fat mass, (B) lean mass, and (C) fluid mass of male and female GHA and WT mice from 6 to 80 weeks of age. Data are expressed as mean ± SEM, n = 11 (male GHA), n = 11 (male WT), n = 8 (female GHA), and n = 9 (female WT). For fat mass, two-way repeated measure analysis of variance showed a significant difference with respect to genotype (F(1,35) = 20.59, p = .6 × 10–5) and sex (F(1,35) = 10.21, p = .03). For lean mass, there was a significant impact of genotype (F(1,35) = 216.18, p = 8.6 × 10⁻¹⁷) and sex (F(1,35) = 96.76, p = 9.6 × 10⁻¹²). For fluid mass, there was a significant impact of genotype (F(1,35) = 30.21, p = 3.3 × 10⁻⁶), sex (F(1,35) = 29.39, p = 4.1 × 10⁻⁶), and the interaction of the two (F(1,35) = 5.71, p = .02).
Unlike fat mass, the absolute weight of lean mass in GHA mice was lower than the age- and sex-matched littermate controls (Figure 2B). In fact, lean mass for GHA mice remained 61%–71% of control mice for both sexes and throughout the entire study, suggesting that the catch-up weight observed in male mice is not due to significant gains in lean mass in later life. When the lean mass data were normalized to body weight, there was no difference in female GHA mice relative to WT controls at any age or in male GHA mice compared with controls at younger ages (up to 28 weeks). However, as male GHA mice became significantly more obese with advancing age, their relative proportion of lean mass decreased relative to WT mice. Female GHA mice had comparatively less absolute fluid mass than their littermate controls at all time points, whereas male GHA mice had slightly less fluid mass only at a few select ages (Figure 2C).
Glucose Homeostasis
Glucose homeostasis was established by determining fasting blood glucose (Figure 3A) and plasma insulin (Figure 3B) levels at five distinct ages (8, 13, 26, 52, and 72 weeks old). In addition, a glucose tolerance test was performed at 73 weeks of age (Figure 3C). With respect to blood glucose, there was a significant impact of sex but not of genotype with females of both genotypes having relatively lower glucose levels than males. In contrast, a significant effect of sex, genotype, and genotype–sex interaction was observed for insulin levels. Specifically, male GHA mice had a significant increase in insulin levels at 72 weeks of age (Figure 3B). Despite elevated insulin levels in male GHA mice, there was no significant difference in the glucose tolerance test performed at 73 weeks (Figure 3C). However, male GHA mice, but not female GHA mice, showed a trend toward greater glucose intolerance even though it did not reach statistical significance (p = .07).
Figure 3.
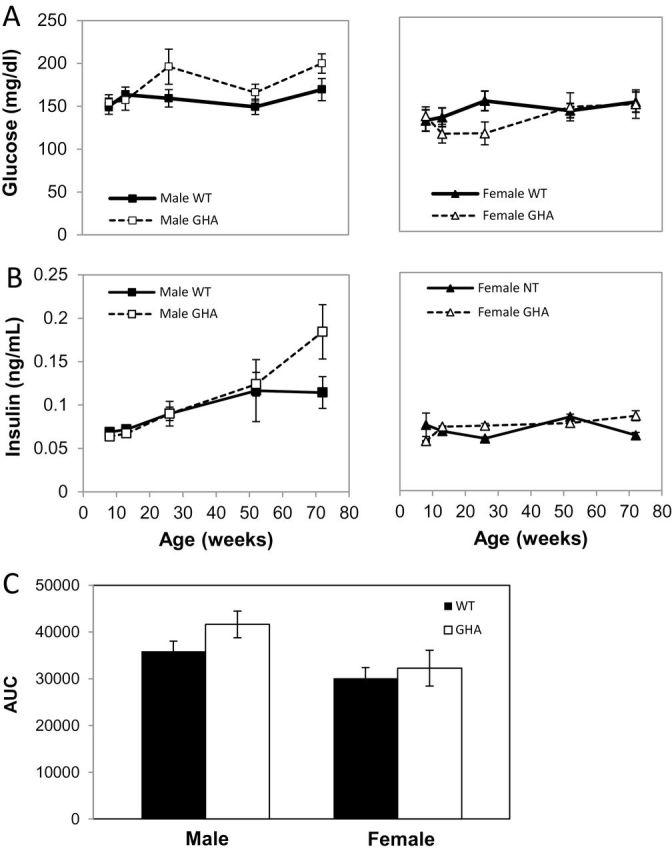
Measures of glucose homeostasis in GH receptor antagonist (GHA) and wild-type (WT) mice. Shown are (A) fasting blood glucose levels and (B) fasting insulin levels at 8, 13, 26, 52, and 72 weeks of age in male and female mice as well as area under the curve (C) from a glucose tolerance test done at 73 weeks of age. Data are expressed as mean ± SEM; n = 11 (male GHA), n = 11 (male WT), n = 8 (female GHA), and n = 9 (female WT). With respect to blood glucose, there was a significant impact of sex (F(1,35) = 24.36, p = 2.1 × 10⁻⁵) but not of genotype. For insulin, a significant effect of sex (F(1,35) = 28.74, p = 5.3 × 10⁻⁶), genotype (F(1,35) = 10.632, p = .002), and genotype–sex interaction (F(1,35) = 6.38, p = .02) was observed.
Plasma Leptin Concentrations and Leptin:Adiponectin Ratio
With the changes in adiposity, it is likely that adipokines are altered as well. Male and female GHA mice had higher leptin levels than WT mice at most ages (Figure 4A). Male GHA mice displayed an abrupt increase in plasma leptin levels at about 13 weeks of age that persisted throughout the study. Female GHA mice had a notable, though less dramatic, increase that initiated later at about 26 weeks of age. By 72 weeks of age, male and female GHA mice had leptin levels that were 6.9-fold and 5-fold higher than WT littermate controls, respectively. As might be expected, leptin levels were strongly and positively correlated with absolute (R = .84, p = 1.8 × 10–52) and percent fat mass (R = .82, p = 5.3 × 10−47). As reported previously in male mice (30), plasma adiponectin levels also increased over time though to a much smaller extent (Figure 4B) and were significantly higher in GHA mice relative to WT male mice at all time points measured. Not reported in this previous article were the values for female GHA mice (Figure 4B). For female GHA mice, adiponectin levels were significantly higher at all ages measured except for the oldest time point, 72 weeks of age. The leptin:adiponectin ratio has been suggested to be a helpful measurement to express the relative concentrations of these two adipokines and has been shown to better correlate to insulin resistance, visceral adiposity, and metabolic syndrome than either leptin or adiponectin alone (32–34). Male GHA mice had a dramatically increased leptin:adiponectin ratio compared with WT controls, as did female GHA mice, though to a lesser extent (Figure 4C). By 72 weeks of age, the leptin:adiponectin ratio was increased 4.5- and 3.3-fold in male and female GHA mice, respectively, compared with WT littermate controls.
Figure 4.
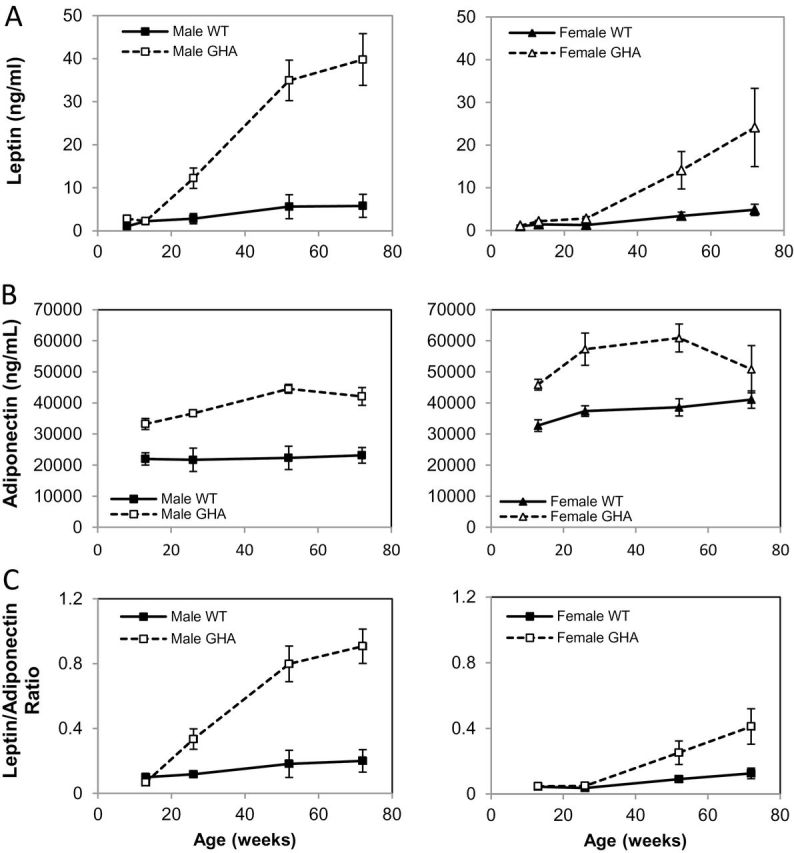
Plasma leptin levels (A), adiponectin (B), and leptin:adiponectin ratio (C) in GH receptor antagonist (GHA) and wild-type (WT) mice over time. Data are expressed as mean ± SEM; n = 11 (male GHA), n = 11 (male WT), n = 8 (female GHA), and n = 9 (female WT). There was a significant impact of genotype (F(1,35) = 57.41, p = 6.9 × 10⁻⁹), sex (F(1,36) = 15.67, p = 3.5 × 10⁻⁴), and a significant interaction (Genotype × Sex; F(1,35) = 9.11, p = .005) on plasma leptin levels. There was a significant impact of genotype (F(1,26) = 9.616, p = .005) but no significant impact of sex (F(1,26) = 1.275, p = .269) or interaction (Genotype × Sex; F(1,26) = 0.405, p = .530) on plasma total adiponectin levels. There was significant impact of genotype (F(1,30) = 41.887, p = 7.4 × 10⁻⁷), sex (F(1,30) = 29.569, p = 1.1 × 10⁻⁵), and a significant interaction (Genotype × Sex; F(1,30) = 11.180, p = .003) on the leptin:adiponectin ratio. Note that data for adiponectin in male GHA and WT mice have been reported previously (30).
Tissue Weights and Liver Triglycerides
The mass of all adipose depots was higher in male GHA mice than their littermate controls at 82 weeks of age; however, there was only a significant increase in the mass of subcutaneous and retroperitoneal fat pads (p = 1.0 × 10⁻⁶ and p = .04, respectively) (Figure 5A). In contrast to fat mass and in accordance with the body composition data, the mass of most lean tissues (kidney, liver, and muscle) was significantly less in male GHA mice than the controls (Figure 5A). Although body composition results showed that female GHA mice had higher absolute fat mass at most time points, none of the fat pads showed a significant increase in mass compared with the female WT mice (Figure 5B). Despite not reaching statistical significance, the only fat pad enlarged in the female GHA mice was the subcutaneous fat pad (Figure 5B). Like the males, the absolute weights of most organs collected (heart, kidney, liver, and muscle) of female GHA mice were significantly less than the female WT controls at 82 weeks of age (Figure 5B). Because female GHA mice had body weights that were significantly less than female WT mice, we also assessed the tissue weights normalized to total body weight. Normalized tissue weights revealed a significant increase in only the subcutaneous (p = .01) fat pad. Interestingly, normalized values for all lean tissues were not significantly different than female WT controls, suggesting that the decrease in the absolute mass of lean tissue is proportional to the dwarf size of the female GHA mice.
Figure 5.
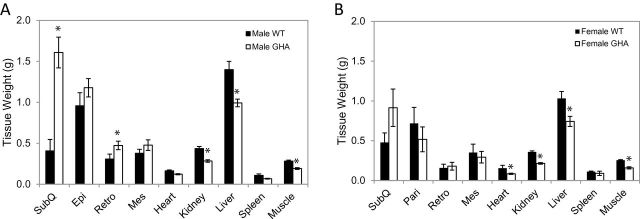
Tissue weights from GH receptor antagonist (GHA) and wild-type (WT) mice at 82 weeks of age. Data are expressed as mean ± SEM, n = 11 (male GHA), n = 11 (male WT), n = 8 (female GHA), and n = 9 (female WT). SubQ, inguinal subcutaneous; Peri, perigondal (epididymal in males and parametrial in females); Retro, retroperitoneal; and Mes, mesenteric. * indicates a significant difference from WT within a given tissue, p < .05.
Because the liver mass was significantly decreased in GHA mice compared with WT controls, we also assessed the triglyceride content of liver samples. Although male and female GHA mice tended to have lower liver triglycerides (Table 1), the difference did not reach statistical significance.
Table 1.
Liver Triacylglycerol (TAG) Values for Male and Female WT and GHA Mice
| Sex | Genotype | Liver TAG (mg/g tissue) |
|---|---|---|
| Male | WT | 54.2±6.0 |
| GHA | 46.2±3.9 | |
| Female | WT | 65.1±4.0 |
| GHA | 60.9±5.9 |
Notes. GHA = growth hormone receptor antagonist; WT = wild-type.
Discussion
Dwarf GHA transgenic mice are unusual in that they do not experience a significant extension in life span despite a significant inhibition in the growth hormone/insulin-like growth factor-1 axis (14). Because these mice are not long lived, few studies have attempted to systematically and longitudinally characterize these mice despite the fact that these mice have been available for study for more than two decades (22–24). However, GHA mice remain a valuable tool for comparison with other long-lived dwarf mice with a reduction in GH action to discern among the phenotypic and metabolic characteristics important for life-span extension. In the current study, we aimed to evaluate basic phenotypic changes in the GHA mice over time (body size, body composition, adipokine levels, glucose homeostasis, and tissue weights) that have been linked to life-span extension in other mouse lines with reduced GH signaling. Overall, our findings suggest some unique differences in GHA versus GHR−/− mice with advancing age. Specifically, with advancing age, male GHA mice become extremely obese, are hyperinsulinemic, and have an exaggerated adipokine profile, which likely prevent them from experiencing an extended life span. These differences are likely due to the reduction rather than elimination of GHR signaling in GHA mice. Although GHR−/− mice lack a functional GHR gene, and thus GHR signaling, GHA mice express an antagonist, which only reduces and does not eliminate GHR signaling. Interestingly and as will be discussed later, the pattern for female GHA mice is similar but distinct from the male GHA mice, suggesting important sex differences worthy of further exploration.
A small body size is a feature shared by mice with a reduction in GH signaling that has been suggested to influence life span (1,35). Several studies have assessed body weight in male GHA mice although no longitudinal data exist for female GHA mice. For male mice, our results are similar to what has been reported previously by Coschigano and colleagues (14), in which body weight was tracked in male GHA mice over the longest time period to date (until 44–46 weeks of age). They report that male GHA mice are dwarf and weigh less than the age-matched controls at younger ages (61% of controls) but steadily approach those of the control littermates by the final weeks of measurement (14). Our results for male GHA mice are similar to this previous report; however, we followed the mice for longer and eventually find no statistical difference in body weight after 52 weeks of age. Our data showing significant decreases in the total lean mass as well as the mass of lean tissues throughout the study are consistent with previous reports in GHA mice (14). Thus, the catch-up in body weight observed for male GHA mice is not due to a more gradual increase in lean mass, but rather increases in fat mass. Interestingly, female GHA mice, unlike males, never catch up to the body weight of their respective littermate controls. Thus, GHA mice remain relatively dwarf with respect to lean mass yet do not experience life-span extension. These data add support for small body size not being the sole factor necessary to extend life span with GH reduction.
Mice with reductions in GH action are generally obese and often show a preferential accumulation of subcutaneous fat (5); GHA mice appear to follow this trend. Several groups have shown that male GHA mice are markedly obese from 28 to 68 days (27) assessed at 10-day intervals by carcass analysis and at 4 (26) and 6 months (15) of age by dual-energy X-ray absorptiometry and nuclear magnetic resonance methods, respectively. Two of these previous studies also show a preferential accumulation of subcutaneous fat in young adult male GHA mice relative to controls (15,26) as determined by weights at dissection. The data from our study are similar at young ages and expand on these findings by revealing a dramatic increase in total fat mass and the mass of the subcutaneous depot with advancing age. Collectively, these data show that the catch-up in body weight observed for older male GHA mice compared with WT mice is due to extraordinary fat mass gains. However, it should also be noted that GHA mice develop severe obesity and do not have any decrease in life span, indicating that the adiposity in these mice is still somewhat unique and that GH antagonism may offer some protection from obesity-associated pathologies.
Most long-lived mice with a reduction in GH signaling have elevated leptin levels. For example, leptin tends to be elevated in long-lived GH receptor gene disrupted (GHR−/−) (5,36) and Snell dwarf (11) mice. Although this is consistent with their elevated fat mass, low levels of leptin, not high levels of leptin, are more commonly associated with increases in longevity (37–39). This study confirmed previous reports that GHA mice have elevated leptin levels at 4 and 6 months of age (15,26) but extends these findings to reveal that leptin levels surge with advancing age, particularly in male GHA mice, and is the first study to report that the female mice also have elevated leptin levels. These levels are also higher than what has previously been shown in our laboratory with GHR−/− mice (Sackmann-Sala et al., unpublished results). Although leptin is most commonly associated with being a lipostat, reflecting the energy status and fuel reserves of the organism, it is important to appreciate that leptin has additional functions that could affect life span. For example, leptin has a potent and complex effect on the immune system, as ob/ob mice, which lack leptin, have increased susceptibility to infections but are protected from autoimmune disorders (40). Further, leptin has a powerful impact on the proliferation of specific lymphocytes (41). Thus, some have proposed that leptin could have both a positive and negative role on immune responses, which would undoubtedly affect the health of the organism. Assessing the relationship between leptin and immune status in GHA mice with age would be of interest due to the dramatic surge in leptin levels seen with advancing age.
Unlike leptin, adiponectin is considered a beneficial adipokine as it is usually negatively associated with obesity and positively associated with insulin sensitivity and longevity (39,42). However, GHR−/− as well as Ames dwarf mice, which have a reduction in GH action, are obese yet have significantly elevated total and HMW adiponectin levels (5,30), suggesting that this adipokine is influenced more by the health status of the mice than overall adiposity. Adiponectin levels for the same cohort of male (reported recently) (30) and female GHA and WT mice reveal that total adiponectin levels are significantly increased in GHA mice, though the increase is modest in comparison with the increase in leptin. Interestingly, although HMW adiponectin is generally associated with increased insulin sensitivity and longevity, male GHA mice experienced a greater increase in HMW adiponectin than the long-lived insulin-sensitive GHR−/− mice at 12 months of age and older (30). The elevated levels of both leptin and adiponectin in GHA mice might be expected as both of these adipokines have been shown to be more highly expressed in subcutaneous fat, which is the main depot enlarged in these mice. Perhaps the ratio of these two adipokines may be more suitable to consider in the context of aging as a higher leptin:adiponectin ratio has been reported to be better correlated with insulin resistance, atherosclerosis, and cancer in humans than either leptin or adiponectin alone (32,43–45). Because of the more moderate increase in adiponectin in comparison with the large leptin increase with advancing age, the ratio of these two adipokines increases in GHA mice with advancing age. Unfortunately, similar ratio analysis has not been performed on long-lived mice with altered GH action. However, perhaps long-lived mice, some of which have been shown to have elevated leptin and adiponectin at a single time point in younger life, do not experience the sizable increases in leptin levels with advancing age, resulting in a lower leptin:adiponectin ratio and potential protection from age-related pathologies. Regardless, measuring this ratio may be of interest to pursue in other mice with varying life spans to better explain the relationship of these adipokines to aging and and may provide more insight than evaluating a single adipokine. Alternatively, other adipokines or circulating factors besides leptin and adiponectin may be important to consider.
An attribute shared among long-lived mammals is a reduction in circulating insulin and an improvement in insulin sensitivity, prompting some to consider this a central feature important for improving life span (46). Mice with a reduction in the growth hormone/insulin-like growth factor-1 axis share this feature. For example, long-lived GHR−/− mice are hypoinsulinemic and somewhat hypoglycemic and exhibit reduced insulin responses to a glucose challenge relative to control animals (7–9,14). To the best of our knowledge, measures of glucose homeostasis have only been reported for male GHA mice. In these previous studies, male GHA mice exhibit slightly lower or normal blood glucose and insulin levels (14,26). Compared with WT mice, age seems to be an important factor as younger GHA mice appear more likely to have significantly lower levels of both glucose and insulin, whereas older mice (approximately 11 months) appear to have levels not significantly different than controls (14). Our results show euglycemia in GHA mice of both sexes throughout the 18-month period of study. However, hyperinsulinemia develops with advancing age in older male GHA mice, during a time in which adiposity is dramatically increased. These data suggest that GHA mice may eventually develop glucose intolerance at ages beyond those assessed in this study. Clearly, a more thorough assessment of glucose homeostasis at different ages in these mice would be valuable in future studies. Regardless, the concept that insulin sensitivity is a necessary component for life-span extension is consistent with data for GHA mice, which do not have remarkable changes in glucose handling and no change in life span (14).
In this study, male and female GHA mice responded differently over time. Most notably, the accumulation of fat mass is more robust in male mice. In fact, male GHA mice accumulate approximately twice as much adipose tissue as GHA females by 82 weeks of age. This gender difference in WT mice, with the male mice accumulating more adipose earlier in life, has been previously reported (28). There are also several sex differences in metabolic parameters. Circulating leptin concentrations and the leptin:adiponectin ratio are more drastically increased in male GHA mice compared with females of the same genotype. This is not surprising, as circulating leptin concentrations generally parallel total adipose tissue mass (47), and male GHA mice are more obese. Additionally, only males at advanced ages appear to show signs of impairments in glucose homeostasis with hyperinsulinemia in the final weeks of measurement. Recent reports have examined the potential molecular mechanisms responsible for the sexually dimorphic response to adiposity and glucose metabolism. Many molecular mechanisms have been implicated including autocrine function of aldehyde dehydrogenase 1 for depot- and sex-specific responses in adiposity (48), reduced suppressor of cytokine signaling 3 expression in adipose tissue of female mice (49), increased uncoupling protein 1 expression in female mice as well as differential expression of cyclic guanosine monophosphate-dependent protein kinase I (50). Regardless of the exact molecular mechanism, estrogen appears central to differences observed as ovariectomy of female mice eliminates the sex difference in adipose mass and glucose homeostasis (51).
Generally, this article sought to answer the question, “Why do GHA mice not experience the extended longevity seen in other mouse models of reduced GH action, such as GHR−/− mice?” After all, the primary differences between GHR−/− and GHA mice would reveal the relevant traits associated with reduced GH action that are most important to extend life span. Male, and to a lesser extent female, GHA mice exhibit a sizable increase in fat mass with advancing age. For male GHA mice, this fat mass gain is sufficient to result in a body weight that equals that of WT male mice during later adult life. In comparison, female GHR−/− mice have a less dramatic accumulation of fat mass and never catch up to WT mice in total body weight (16). The increase in fat mass in both male and female GHA mice is mainly subcutaneous and is accompanied by a markedly altered adipokine profile with elevated total adiponectin, as has been reported in male GHA mice (30) and here in female GHA mice, suggesting that this is not the life-extending feature of these mice. However, GHA mice experience dramatic increase in levels of circulating leptin and dramatic increases in the weight of other fat pads with advancing age, which have not been reported previously in GHR−/− mice. Despite the adiposity, both male and female antagonist mice have normal liver triglycerides, as do GHR−/− mice at 2 years of age (16). Fasting blood glucose levels remain normal in GHA mice throughout life span, though there are signs of hyperinsulinemia in older male GHA mice. These findings are in contrast to the preservation of insulin sensitivity with obesity and advancing age with GHR−/− mice (9). These differences between GHA and GHR−/− mice are likely due to the differences in GH signaling or IGF-1 signaling. Although GHR−/− mice lack the GH receptor and have essentially no GH action, the antagonist produced in the GHA mice reduces, but does not eliminate GH and subsequent IGF-1 signaling. In conclusion, the accumulation of fat mass in GHA mice differs from that of long-lived GHR−/− mice as GHA mice show a much greater increase in nonsubcutaneous depots and a unique adipokine profile. In addition, GHA mice do not have notable improvements in glucose homeostasis with advancing ages unlike GHR−/− mice. These differences may account for the absence of life-span extension observed in this dwarf mouse line.
Funding
This work was supported by the State of Ohio’s Eminent Scholar Program that includes a gift from Milton and Lawrence Goll (J.J.K.); National Institutes of Health (DK075436 and AG019899 to J.J.K; AG031736 to J.J.K., D.E.B., E.O.L.); the Diabetes Institute at Ohio University (D.E.B., E.O.L.); and the American Veterans (J.J.K., E.R.L.).
References
- 1. Berryman DE, Christiansen JS, Johannsson G, Thorner MO, Kopchick JJ. Role of the GH/IGF-1 axis in lifespan and healthspan: lessons from animal models. Growth Horm IGF Res. 2008; 18: 455–471 [DOI] [PMC free article] [PubMed] [Google Scholar]
- 2. Guevara-Aguirre J, Balasubramanian P, Guevara-Aguirre M, et al. Growth hormone receptor deficiency is associated with a major reduction in pro-aging signaling, cancer, and diabetes in humans. Sci Transl Med. 2011; 3: 70ra13 [DOI] [PMC free article] [PubMed] [Google Scholar]
- 3. Laron Z. Do deficiencies in growth hormone and insulin-like growth factor-1 (IGF-1) shorten or prolong longevity? Mech Ageing Dev. 2005; 126: 305–307 [DOI] [PubMed] [Google Scholar]
- 4. Laron Z. The GH-IGF1 axis and longevity. The paradigm of IGF1 deficiency. Hormones (Athens). 2008; 7: 24–27 [DOI] [PubMed] [Google Scholar]
- 5. Berryman DE, List EO, Sackmann-Sala L, Lubbers E, Munn R, Kopchick JJ. Growth hormone and adipose tissue: beyond the adipocyte. Growth Horm IGF Res. 2011; 21: 113–123 [DOI] [PMC free article] [PubMed] [Google Scholar]
- 6. Ding J, Sackmann-Sala L, Kopchick JJ. Mouse models of growth hormone action and aging: a proteomic perspective. Proteomics. 2013;13: 674–685 [DOI] [PMC free article] [PubMed] [Google Scholar]
- 7. Bartke A. Pleiotropic effects of growth hormone signaling in aging. Trends Endocrinol Metab. 2011; 22: 437–442 [DOI] [PMC free article] [PubMed] [Google Scholar]
- 8. Bartke A. Growth hormone, insulin and aging: the benefits of endocrine defects. Exp Gerontol. 2011; 46: 108–111 [DOI] [PMC free article] [PubMed] [Google Scholar]
- 9. List EO, Sackmann-Sala L, Berryman DE, et al. Endocrine parameters and phenotypes of the growth hormone receptor gene disrupted (GHR-/-) mouse. Endocr Rev. 2011; 32: 356–386 [DOI] [PMC free article] [PubMed] [Google Scholar]
- 10. Brown-Borg HM, Bartke A. GH and IGF1: roles in energy metabolism of long-living GH mutant mice. J Gerontol A Biol Sci Med Sci. 2012; 67: 652–660 [DOI] [PMC free article] [PubMed] [Google Scholar]
- 11. Flurkey K, Papaconstantinou J, Miller RA, Harrison DE. Lifespan extension and delayed immune and collagen aging in mutant mice with defects in growth hormone production. Proc Natl Acad Sci U S A. 2001; 98: 6736–6741 [DOI] [PMC free article] [PubMed] [Google Scholar]
- 12. Brown-Borg HM, Borg KE, Meliska CJ, Bartke A. Dwarf mice and the ageing process. Nature. 1996; 384: 33 [DOI] [PubMed] [Google Scholar]
- 13. Flurkey K, Papaconstantinou J, Harrison DE. The Snell dwarf mutation Pit1(dw) can increase life span in mice. Mech Ageing Dev. 2002; 123: 121–130 [DOI] [PubMed] [Google Scholar]
- 14. Coschigano KT, Holland AN, Riders ME, List EO, Flyvbjerg A, Kopchick JJ. Deletion, but not antagonism, of the mouse growth hormone receptor results in severely decreased body weights, insulin, and insulin-like growth factor I levels and increased life span. Endocrinology. 2003; 144: 3799–3810 [DOI] [PubMed] [Google Scholar]
- 15. Berryman DE, List EO, Coschigano KT, Behar K, Kim JK, Kopchick JJ. Comparing adiposity profiles in three mouse models with altered GH signaling. Growth Horm IGF Res. 2004; 14: 309–318 [DOI] [PubMed] [Google Scholar]
- 16. Berryman DE, List EO, Palmer AJ, et al. Two-year body composition analyses of long-lived GHR null mice. J Gerontol A Biol Sci Med Sci. 2010; 65: 31–40 [DOI] [PMC free article] [PubMed] [Google Scholar]
- 17. Donahue LR, Beamer WG. Growth hormone deficiency in ‘little’ mice results in aberrant body composition, reduced insulin-like growth factor-I and insulin-like growth factor-binding protein-3 (IGFBP-3), but does not affect IGFBP-2, -1 or -4. J Endocrinol. 1993; 136: 91–104 [DOI] [PubMed] [Google Scholar]
- 18. Heiman ML, Tinsley FC, Mattison JA, Hauck S, Bartke A. Body composition of prolactin-, growth hormone, and thyrotropin-deficient Ames dwarf mice. Endocrine. 2003; 20: 149–154 [DOI] [PubMed] [Google Scholar]
- 19. Meyer CW, Korthaus D, Jagla W, et al. A novel missense mutation in the mouse growth hormone gene causes semidominant dwarfism, hyperghrelinemia, and obesity. Endocrinology. 2004; 145: 2531–2541 [DOI] [PubMed] [Google Scholar]
- 20. Flint DJ, Binart N, Kopchick J, Kelly P. Effects of growth hormone and prolactin on adipose tissue development and function. Pituitary. 2003; 6: 97–102 [DOI] [PubMed] [Google Scholar]
- 21. Berryman DE, List EO, Kohn DT, Coschigano KT, Seeley RJ, Kopchick JJ. Effect of growth hormone on susceptibility to diet-induced obesity. Endocrinology. 2006; 147: 2801–2808 [DOI] [PubMed] [Google Scholar]
- 22. Chen WY, Wight DC, Mehta BV, Wagner TE, Kopchick JJ. Glycine 119 of bovine growth hormone is critical for growth-promoting activity. Mol Endocrinol. 1991; 5: 1845–1852 [DOI] [PubMed] [Google Scholar]
- 23. Chen WY, White ME, Wagner TE, Kopchick JJ. Functional antagonism between endogenous mouse growth hormone (GH) and a GH analog results in dwarf transgenic mice. Endocrinology. 1991; 129: 1402–1408 [DOI] [PubMed] [Google Scholar]
- 24. Chen WY, Wight DC, Chen NY, Coleman TA, Wagner TE, Kopchick JJ. Mutations in the third alpha-helix of bovine growth hormone dramatically affect its distribution in vitro and growth enhancement in transgenic mice. J Biol Chem. 1991; 266: 2252–2258 [PubMed] [Google Scholar]
- 25. Kopchick JJ, Parkinson C, Stevens EC, Trainer PJ. Growth hormone receptor antagonists: discovery, development, and use in patients with acromegaly. Endocr Rev. 2002; 23: 623–646 [DOI] [PubMed] [Google Scholar]
- 26. Yakar S, Setser J, Zhao H, et al. Inhibition of growth hormone action improves insulin sensitivity in liver IGF-1-deficient mice. J Clin Invest. 2004; 113: 96–105 [DOI] [PMC free article] [PubMed] [Google Scholar]
- 27. Knapp JR, Chen WY, Turner ND, Byers FM, Kopchick JJ. Growth patterns and body composition of transgenic mice expressing mutated bovine somatotropin genes. J Anim Sci. 1994; 72: 2812–2819 [DOI] [PubMed] [Google Scholar]
- 28. Palmer AJ, Chung MY, List EO, et al. Age-related changes in body composition of bovine growth hormone transgenic mice. Endocrinology. 2009; 150: 1353–1360 [DOI] [PMC free article] [PubMed] [Google Scholar]
- 29. Ebinuma H, Matsuo M. Protease-based ELISA for selective quantification of mouse high-molecular-weight adiponectin. Clin Chim Acta. 2009; 401: 181–183 [DOI] [PubMed] [Google Scholar]
- 30. Lubbers ER, List EO, Jara A, Sackman-Sala L, Cordoba-Chacon J, Gahete MD, Kineman RD, Boparai R, Bartke A, Kopchick JJ, Berryman DE., et al. Adiponectin in mice with altered GH action: links to insulin sensitivity and longevity? J Endocrinol. 2013;216:363–374; [DOI] [PMC free article] [PubMed] [Google Scholar]
- 31. Salmon DM, Flatt JP. Effect of dietary fat content on the incidence of obesity among ad libitum fed mice. Int J Obes. 1985; 9: 443–449 [PubMed] [Google Scholar]
- 32. Inoue M, Maehata E, Yano M, Taniyama M, Suzuki S. Correlation between the adiponectin-leptin ratio and parameters of insulin resistance in patients with type 2 diabetes. Metabolism. 2005; 54: 281–286 [DOI] [PubMed] [Google Scholar]
- 33. Lim U, Turner SD, Franke AA, et al. Predicting total, abdominal, visceral and hepatic adiposity with circulating biomarkers in Caucasian and Japanese American women. PLoS One. 2012; 7: e43502 [DOI] [PMC free article] [PubMed] [Google Scholar]
- 34. Cicero AF, Magni P, Moré M, et al. Adipokines and sexual hormones associated with the components of the metabolic syndrome in pharmacologically untreated subjects: data from the brisighella heart study. Int J Endocrinol. 2011; 2011: 724816 [DOI] [PMC free article] [PubMed] [Google Scholar]
- 35. Rollo CD. Growth negatively impacts the life span of mammals. Evol Dev. 2002; 4: 55–61 [DOI] [PubMed] [Google Scholar]
- 36. Egecioglu E, Bjursell M, Ljungberg A, et al. Growth hormone receptor deficiency results in blunted ghrelin feeding response, obesity, and hypolipidemia in mice. Am J Physiol Endocrinol Metab. 2006; 290: E317–E325 [DOI] [PubMed] [Google Scholar]
- 37. Meazza C, Vitale G, Pagani S, et al. Common adipokine features of neonates and centenarians. J Pediatr Endocrinol Metab. 2011; 24: 953–957 [DOI] [PubMed] [Google Scholar]
- 38. Stenholm S, Metter EJ, Roth GS, et al. Relationship between plasma ghrelin, insulin, leptin, interleukin 6, adiponectin, testosterone and longevity in the Baltimore Longitudinal Study of Aging. Aging Clin Exp Res. 2011; 23: 153–158 [DOI] [PMC free article] [PubMed] [Google Scholar]
- 39. Arai Y, Takayama M, Abe Y, Hirose N. Adipokines and aging. J Atheroscler Thromb. 2011; 18: 545–550 [DOI] [PubMed] [Google Scholar]
- 40. Stofkova A. Leptin and adiponectin: from energy and metabolic dysbalance to inflammation and autoimmunity. Endocr Regul. 2009; 43: 157–168 [PubMed] [Google Scholar]
- 41. La Cava A, Matarese G. The weight of leptin in immunity. Nat Rev Immunol. 2004; 4: 371–379 [DOI] [PubMed] [Google Scholar]
- 42. McKee Alderman J, DePetrillo MA, Gluesenkamp AM, et al. Calorie restriction and dwarf mice in gerontological research. Gerontology. 2010; 56: 404–409 [DOI] [PubMed] [Google Scholar]
- 43. Kotani K, Sakane N, Saiga K, Kurozawa Y. Leptin: adiponectin ratio as an atherosclerotic index in patients with type 2 diabetes: relationship of the index to carotid intima-media thickness. Diabetologia. 2005; 48: 2684–2686 [DOI] [PubMed] [Google Scholar]
- 44. Santillán-Benítez JG, Mendieta-Zerón H, Gómez-Oliván LM, Torres-Juárez JJ, González-Bañales JM, Hernández-Peña LV, Ordóñez-Quiroz A, et al. The tetrad BMI, leptin, leptin/adiponectin (L/A) ratio and CA 15-3 are reliable biomarkers of breast cancer. J Clin Lab Anal. 2013;27:12–20 [DOI] [PMC free article] [PubMed] [Google Scholar]
- 45. Liao YC, Liang KW, Lee WJ, Lee WL, Lee IT, Wang JS, Ting CT, Sheu WH, et al. Leptin to adiponectin ratio as a useful predictor for cardiac syndrome X. Biomarkers. 2013;18:44–50 [DOI] [PubMed] [Google Scholar]
- 46. Bartke A. Impact of reduced insulin-like growth factor-1/insulin signaling on aging in mammals: novel findings. Aging Cell. 2008; 7: 285–290 [DOI] [PubMed] [Google Scholar]
- 47. Khan SM, Hamnvik OP, Brinkoetter M, Mantzoros CS. Leptin as a modulator of neuroendocrine function in humans. Yonsei Med J. 2012; 53: 671–679 [DOI] [PMC free article] [PubMed] [Google Scholar]
- 48. Yasmeen R, Reichert B, Deiuliis J, et al. Autocrine function of aldehyde dehydrogenase 1 as a determinant of diet- and sex-specific differences in visceral adiposity. Diabetes. 2013; 62: 124–136 [DOI] [PMC free article] [PubMed] [Google Scholar]
- 49. Palanivel R, Fullerton MD, Galic S, et al. Reduced Socs3 expression in adipose tissue protects female mice against obesity-induced insulin resistance. Diabetologia. 2012; 55: 3083–3093 [DOI] [PMC free article] [PubMed] [Google Scholar]
- 50. Nikolic DM, Li Y, Liu S, Wang S. Overexpression of constitutively active PKG-I protects female, but not male mice from diet-induced obesity. Obesity (Silver Spring). 2011; 19: 784–791 [DOI] [PMC free article] [PubMed] [Google Scholar]
- 51. Stubbins RE, Holcomb VB, Hong J, Núñez NP. Estrogen modulates abdominal adiposity and protects female mice from obesity and impaired glucose tolerance. Eur J Nutr. 2012; 51: 861–870 [DOI] [PubMed] [Google Scholar]