

Abstract
Lateral prefrontal and posterior parietal cortical areas exhibit task-dependent activation during working memory tasks in humans and monkeys. Neurons in these regions become synchronized during attention demanding tasks, but the contribution of these interactions to working memory is largely unknown. Using simultaneous recordings of neural activity from multiple areas in both regions, we find widespread, task-dependent and content specific synchronization of activity across the fronto-parietal network during visual working memory. The patterns of synchronization are prevalent among stimulus selective neurons and are governed by influences arising in parietal cortex. These results indicate that short-term memories are represented by large-scale patterns of synchronized activity across the fronto-parietal network.
Working memory enables the short-term representation and utilization of behaviorally relevant information when that information is no longer available from the environment. How are such representations maintained in the brain? Extensive evidence demonstrates sustained activation in frontal and parietal areas during memory delay periods (1-4). Although the specific role of these activity patterns is not fully understood, theoretical, anatomical and electrophysiological studies suggest that synchronous interactions among these cortical regions support working memory processes (5-11). While task-specific synchronization has been observed between prefrontal and parietal areas (12, 13), its contribution to working memory is largely unknown. We tested the hypothesis that neuronal synchronization across the fronto-parietal network carries content-specific information that contributes directly to visual working memory. The pattern of fronto-parietal synchronization should thus vary as a function of the object held in memory.
We performed multi-electrode recordings of broadband neuronal activity (separated into unit activity and local field potentials (LFPs)) in prefrontal (PFC) and posterior parietal (PPC) cortices in two macaque monkeys (A and B) while they performed an oculomotor, delayed match-to-sample task (Fig. 1A,B) (14). This task required the monkeys to match the identity of the sample object. Figure S1 shows the recording locations and sample sizes relative to the cortical sulci in both monkeys. We simultaneously sampled activity from up to 6 PPC and 6 PFC areas (see Fig. S2 for an example), yielding a total of 30 fronto-parietal, inter-areal comparisons. The resulting data set, consisting of LFPs and unit activity recorded over 27 and 47 days, in monkeys A and B, respectively, is given in table S1.
Fig. 1.
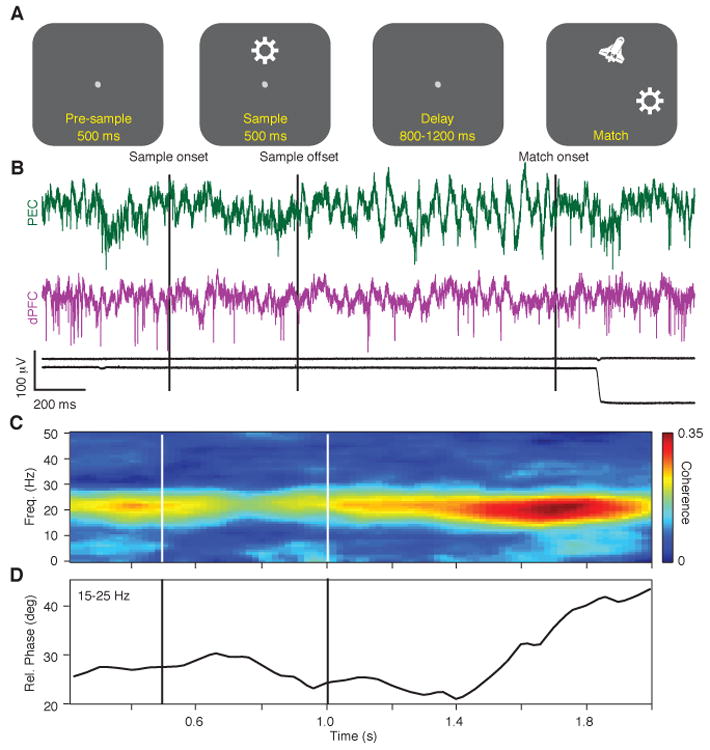
Task dependence of fronto-parietal coherence. (A) Timeline of the identity-matching task. During visual fixation, a sample stimulus, consisting of 1 of 3 possible objects positioned at 1 of 3 possible locations, was presented for 500 ms, followed by a random delay of 800-1200 ms. At the end of the delay a match stimulus was presented, consisting of the previous sample object (target) and a distracter object positioned at 2 out of 3 possible locations. A saccadic eye movement to the target was rewarded with juice (14). (B) Example of the signals recorded on a single trial in monkey A. Top two traces: broadband signals from area PEC of the parietal cortex (PEC, green) and dorsolateral prefrontal cortex (dPFC, purple). Bottom two traces: horizontal and vertical eye position. (C,D) Time-frequency coherence spectrum (C) and average relative phase between 15 and 25 Hz (D) locked to the sample presentation (all stimuli, correct trials, 400 ms window, 50 ms step). In B-D, and in all subsequent figures, the vertical lines show the onset and offset of the sample. Time-frequency distributions in this and subsequent figures are interpolated at 1 Hz and 2 ms resolution.
We first determined the time course of fronto-parietal synchronization by computing the time-frequency coherence spectrum on correct trials for all fronto-parietal LFP pairs (14). These calculations revealed a common temporal pattern of synchronization that correlated with the events of the task (Fig. 1C). In this example, coherence in the 15-25 Hz band peaked during the pre-sample period, transiently declined following the sample stimulus onset, and increased again during the delay (15) reaching a maximum prior to the match. The relative phase between the signals in this frequency range also varied over the course of the trial (Fig. 1D). During the pre-sample and sample periods, PFC showed a phase lead near 25 degrees that increased during the delay period to ∼40 degrees.
To determine how synchronization varies with the sample stimulus held in memory, we first identified pairs having significant coherence (Table 1) and then applied mutual information analysis to the LFP coherence spectra from those pairs at all time-frequency bins (14). (Since the analysis of mutual information is applied to coherence spectra, rather than individual trials, we refer to the resulting metric as the coherence selectivity index (CSI).) Because the sample stimuli differed in their location and identity, we assessed the identity selectivity at each stimulus location and the location selectivity for each identity (16). Figure 2A shows a fronto-parietal pair displaying identity specific coherence during the delay period. A band of elevated coherence (centered at ∼20 Hz) during the delay period differs in magnitude and time-course with the object held in memory. Figure 2B quantifies this effect, revealing a significant increase in CSI during the late delay period.
Table 1.
Number of fronto-parietal pairs with significant coherence and CSI between 10 to 42 Hz.
| N=2191 | PRE (0.1-0.4 s) |
SA (0.6-0.9 s) |
DE1 (1.1-1.4 s) |
DE2 (1.4-1.7 s) |
DE (DE1 and/or DE2) |
|
|---|---|---|---|---|---|---|
| Identity | Sig. Coh | 1349 | 1216 | 1369 | 1599 | 1662 |
| Sig. CSI | 51 | 199 | 244 | 290 | 438 | |
| 3.8% | 16.4% | 17.8% | 18.1% | 26.4 % | ||
| Location | Sig. Coh | 1286 | 1160 | 1274 | 1488 | 1550 |
| Sig. CSI | 41 | 194 | 223 | 263 | 409 | |
| 3.2% | 16.7% | 17.5% | 17.7% | 26.4% |
Abbreviations: PRE: presample period
SA: sample period
DE1: early delay period
DE2: late delay period
DE: the whole delay consisting of either DE1 and/or DE2
The timing of these periods is shown in parentheses.
Fig. 2.
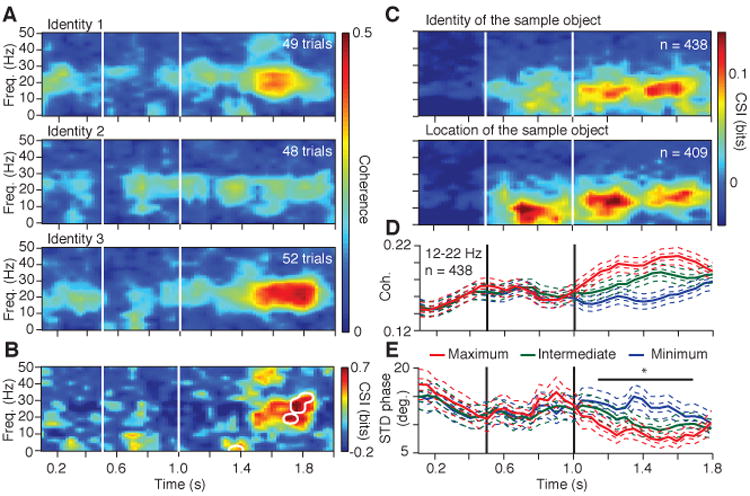
Content specific fronto-parietal synchronization during working memory. (A) Time-frequency coherence spectra for an LFP pair for the three sample objects presented at one location. (B) Coherence selectivity index as a function of time and frequency (CSI(t,f)) for the same pair showing significant selectivity (significance threshold at p < .02 indicated by white contours) during the delay period. (C) Median value of CSI(t,f) for LFP pairs showing selectivity for the sample identity (upper) and location (lower) during the delay. (D) Mean rank-ordered coherence (± SEM) in the 12-22 Hz band for the same identity selective pairs as in the upper plot of C. (E) Mean standard deviation of the relative phase (± SEM) in the 12-22 Hz band for the same identity selective pairs as in the upper plot of C. In plots D, E and Figure 3A, the two SEMs were calculated with the number of pairs or sessions as the degree of freedom.
To assess the stimulus selectivity across the entire sample, we first identified pairs with significant CSI (Table 1) and then pooled the data separately for identity and location for those pairs having significant CSI during the delay. If a pair showed selectivity for multiple locations and/or objects, the stimulus condition with the highest coherence was chosen. The median CSI value, as a function of time and frequency (CSI(t,f)), from the selected pairs is shown in Fig. 2C. (The CSI(t,f) distributions for identity are shown separately for each monkey in Fig. S3A). Several effects are notable. First, location specificity, and to a lesser extent identity specificity, appear during the sample period at frequencies less than 15 Hz. This likely reflects the spatial and identity selectivity of neuronal populations in fronto-parietal networks (17-20). Second, on average, an increase in CSI occurs throughout the delay period with a peak frequency at ∼15 Hz. Third, we found no significant differences in the CSI values between the pairs tuned for location and identity, in the frequency range of 12-22 Hz, at any time bin throughout the trial (minimum p = 0.6; KS-test, Bonferroni correction). Consistent with delay-period selectivity observed at the cellular level (16, 19-21), these findings demonstrate both identity and location specificity of fronto-parietal synchronization during the memory period.
The content specificity of delay-period coherence observed in the CSI raised the question of how coherence magnitude and phase vary as a function of time and stimuli. Since a major objective of this study was to characterize identity specific activity, using the identity matching-rule, we focused all subsequent analysis on identity specificity. For each identity-selective pair, we rank ordered the mean delay-period coherence in the 12-22 Hz range for the three identities (maximum, intermediate and minimum). Figure 2D shows the time-course of the ranked mean coherence (± SEM) for each category. The coherence values for the three objects maintain a clear difference throughout the delay. (Distributions of the maximum coherence for each monkey are shown in Fig. S3B). The mean relative phase ranged from 15 to 40 degrees throughout the trial (at 17 Hz these relative phase values correspond to time lags of 2.45 ms and 6.53 ms, respectively), showing a consistent prefrontal phase lead that gradually increased over time, but showed no apparent difference with respect to the stimuli (Fig. S4). (Interestingly, a small percentage of phase values ranged between 140-180 degrees indicating a near anti-phase relationship). To further identify the source of the coherence differences, we analyzed the mean and variance of the relative phase and power across the distributions in the 12-22 Hz range. The phase variance showed a significant difference across the population in the interval between 1.15 and 1.70 s. (p < .05, Kruskal-Wallis (KW) test, Bonferroni corrected), indicating an inverse relation between coherence magnitude and phase variance in the identity selective pairs (Fig. 2E). We found no difference in the power in the same frequency range for any of the three stimuli in either PPC or PFC (KW test; p > .05, Bonferroni corrected) (Fig. S5), suggesting that the differences in coherence were due primarily to differences in phase consistency.
To determine which cortical areas engage in the synchronous memory-related activity, we sorted the fronto-parietal pairs showing significant delay-period CSI according to their respective cortical areas. The results reveal several notable findings (Fig. S6). First, although our sample distribution was non-uniform, we found content-specific, fronto-parietal coherence among all sampled cortical areas. Second, the incidence of significant coherence selectivity varied widely (ranging from 4% to 50%) and occurred more often than expected from a uniform distribution (p < .05; randomization test) for both identity and location only among pairs involving the lateral bank of the intra-parietal sulcus (i.e. areas PG and LIP). Thus, memory-related, fronto-parietal synchronization is a widespread process distributed across multiple cortical regions (15, 22, 23).
Having demonstrated content specific synchronization during the delay period, we sought evidence for which cortical areas exert influences that might control or modulate this activity. Using Wiener-Granger Causality (WGC) in the time-frequency domain, we estimated the two directions of predictive influence within each fronto-parietal pair for the object yielding the maximum delay-period coherence (14). Figure 3A shows the time course of the mean (± SEM) WGC for the two directions in the 12-22 Hz band. On average the influence is greater from PPC to PFC and both directions of influence increase during the delay period (p < 0.001 for time and causation; two-way ANOVA). Because taking the average obscures the heterogeneity of causal influences across the population, we implemented a method to detect significant differences between the two directions of influence for each pair ((14), Fig. S7). We applied this method to the 400 ms of data preceding match onset to avoid potential nonstationarities due to the sample stimulus offset. For each pair with significant directional difference in WGC, the source of the larger value (PFC or PPC) was considered a sender and that of the smaller value the receiver. We then parsed the data according to cortical area in PFC and PPC regions, and plotted the incidence of senders and receivers of each area in the 12-22 Hz band with respect to all areas in the other cortical region (Fig. 3, B and C; areas PGM and 9L were excluded due to small sample sizes). All cortical areas displayed directional influences as senders and receivers, but the incidence of senders was greater in PPC (13.6%) than PFC (7.5%), and some PPC areas did not receive causal influence at all from some PFC areas. The area with the highest incidence of senders was LIP (25.7%) and that with the highest incidence of receivers was dPFC (17.5%).
Fig. 3.
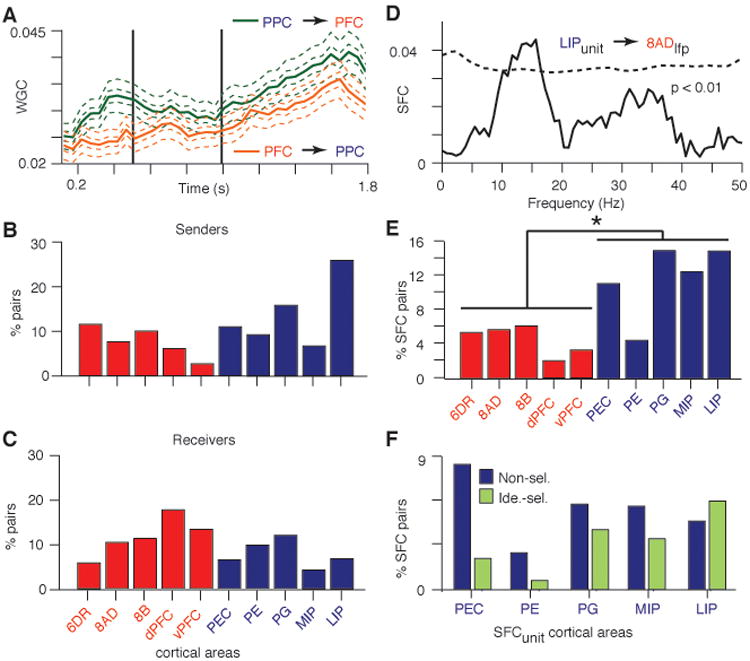
Fronto-parietal interactions are dominated by parietal-to-frontal influences. (A) Time course of WGC in the 12-22 Hz frequency range for all identity selective pairs (mean ± SEM; n = 438). (B, C) Bar charts of the incidence of significant WGC directional differences with respect to cortical area for all the signal pairs in A. (D) Example of the SFC for a LIP unit and the field recorded in area 8AD. Dashed line indicates confidence limit (p < .01, randomized surrogate). (E) Percentage of fronto-parietal pairs with significant SFC between 12 and 22 Hz. The unit activity was recorded in the labeled areas. See Tables S1 and S3 for abbreviations and sample sizes. (F) Percentage of significant PPCunit–PFClfp pairs with respect to the parietal area in which the unit activity was recorded and split according to the stimulus selectivity of the cellular responses.
Our WGC analysis suggests that fronto-parietal synchronization is governed by synaptic influences in PFC that arise in PPC. We used spike-field coherence (SFC) measurements to evaluate this prediction (14), reasoning that this measure is indicative of directed synaptic influences (13). For each fronto-parietal pair, we calculated the SFC between spikes in one region and the LFP in the other during the delay period (1.0-1.8 sec) and detected significant SFC as a function of frequency (p < 0.01). This revealed significant spectral peaks at frequencies between 10-30 Hz (see Fig. 3D for an example). We then calculated the mean incidence of significant SFC in the 12-22 Hz range for each cortical area in which the unit activity was recorded (see Table S2 for sample distribution). The results support the WGC finding of a dominant PPC to PFC influence by demonstrating that significant SFC occurred more often in PPCunit–PFClfp pairs than PFCunit–PPClfp pairs (Fig. 3E, p < 0.05, KS test). The agreement between the WGC and SFC results, supporting a dominant PPC to PFC influence, as opposed to the relative phase results showing a PFC phase lead, supports previous findings that relative phase is not a reliable index of neural influence (24).
To further evaluate the contribution of unit response selectivity, we calculated the mutual information for firing rate as a function of time (Fig. S8) and, consistent with previous reports (19, 20, 25), found widespread selectivity during the sample and/or delay across both PFC and PPC areas (Table S3). We then subdivided the SFCs according to the identity selectivity of the cellular responses. The results for the PPCunit–PFClfp pairs show that significant SFC with PFC involves both selective and non-selective parietal neurons (Fig. 3F). (PFCunit–PPClfp pairs were not included due to small sample sizes.) However, the majority of spike-field interactions involving identity selective units come from cells recorded in areas LIP, PG and to a lesser extent MIP.
Our findings demonstrate that fronto-parietal synchronization during visual working memory is widespread, task-dependent and content specific during the delay period. The patterns of synchronization are governed by influences arising in PPC (26) and are prevalent among parietal neurons that display identity selectivity (19). These findings are consistent with other reports on the relationship between synchronization and performance in working memory tasks (15, 22, 27), the presence of fronto-parietal synchronization during memory-related search (12), and the spatial attention modulation of inter-areal coherence (28). Thus, while other cognitive processes, such as attention, anticipation and motor planning, are likely to contribute to these effects, our findings demonstrate that short term memories are represented as stimulus specific patterns of synchronized activity that are widely distributed throughout the fronto-parietal network (29). This raises the question of how these patterns, their directional influences, spectral dynamics and spatial distribution are modified by other working memory processes, such as retrieval, resistance to distraction, load, manipulation and object-based attention. Other frequency bands have been associated with working memory (22, 30-32) and abundant evidence indicates that other cortical areas contribute to these representations. A major challenge will be to elucidate the neuronal mechanisms underlying memory-related, fronto-parietal interactions, and their relationship to different frequency bands and other cortical areas.
Supplementary Material
Acknowledgments
This work was supported by grants from the National Institute of Mental Health (MH069374, MH081162), the National Institute of Neurological Disorders and Stroke (NS059312) and the Swiss National Science Foundation. We thank Urs Koester for his technical support in the computational procedures. We also thank two anonymous reviewers for helpful comments on an earlier version of the manuscript.
References and Notes
- 1.Fuster JM, Alexander GE. Science. 1971;173:652. doi: 10.1126/science.173.3997.652. [DOI] [PubMed] [Google Scholar]
- 2.Gnadt JW, Andersen RA. Exp Brain Res. 1988;70:216. doi: 10.1007/BF00271862. [DOI] [PubMed] [Google Scholar]
- 3.Chafee MV, Goldman-Rakic PS. J Neurophysiol. 1998;79:2919. doi: 10.1152/jn.1998.79.6.2919. [DOI] [PubMed] [Google Scholar]
- 4.Rottschy C, et al. Neuroimage. 2011;60:830. doi: 10.1016/j.neuroimage.2011.11.050. [DOI] [PMC free article] [PubMed] [Google Scholar]
- 5.Hebb DO. New York. 1949;70:71. [Google Scholar]
- 6.Bressler SL. Brain Res Brain Res Rev. 1995;20:288. doi: 10.1016/0165-0173(94)00016-i. [DOI] [PubMed] [Google Scholar]
- 7.Fell J, Axmacher N. Nat Rev Neurosci. 2011;12:105. doi: 10.1038/nrn2979. [DOI] [PubMed] [Google Scholar]
- 8.Selemon LD, Goldman-Rakic PS. J Neurosci. 1988;8:4049. doi: 10.1523/JNEUROSCI.08-11-04049.1988. [DOI] [PMC free article] [PubMed] [Google Scholar]
- 9.Cavada C, Goldman-Rakic PS. J Comp Neurol. 1989;287:422. doi: 10.1002/cne.902870403. [DOI] [PubMed] [Google Scholar]
- 10.Chafee MV, Goldman-Rakic PS. J Neurophysiol. 2000;83:1550. doi: 10.1152/jn.2000.83.3.1550. [DOI] [PubMed] [Google Scholar]
- 11.Quintana J, Fuster JM, Yajeya J. Brain Res. 1989;503:100. doi: 10.1016/0006-8993(89)91709-5. [DOI] [PubMed] [Google Scholar]
- 12.Buschman TJ, Miller EK. Science. 2007;315:1860. doi: 10.1126/science.1138071. [DOI] [PubMed] [Google Scholar]
- 13.Pesaran B, Nelson MJ, Andersen RA. Nature. 2008;453:406. doi: 10.1038/nature06849. [DOI] [PMC free article] [PubMed] [Google Scholar]
- 14.See supporting material on Online Science.
- 15.Tallon-Baudry C, Bertrand O, Fischer C. J Neurosci. 2001;21:RC177. doi: 10.1523/JNEUROSCI.21-20-j0008.2001. [DOI] [PMC free article] [PubMed] [Google Scholar]
- 16.Rao SC, Rainer G, Miller EK. Science. 1997;276:821. doi: 10.1126/science.276.5313.821. [DOI] [PubMed] [Google Scholar]
- 17.Andersen RA, Essick GK, Siegel RM. Science. 1985;230:456. doi: 10.1126/science.4048942. [DOI] [PubMed] [Google Scholar]
- 18.Funahashi S, Bruce CJ, Goldman-Rakic PS. J Neurophysiol. 1989;61:331. doi: 10.1152/jn.1989.61.2.331. [DOI] [PubMed] [Google Scholar]
- 19.Sereno AB, Maunsell JH. Nature. 1998;395:500. doi: 10.1038/26752. [DOI] [PubMed] [Google Scholar]
- 20.Wilson FA, Scalaidhe SP, Goldman-Rakic PS. Science. 1993;260:1955. doi: 10.1126/science.8316836. [DOI] [PubMed] [Google Scholar]
- 21.Rainer G, Asaad WF, Miller EK. Proc Natl Acad Sci U S A. 1998;95:15008. doi: 10.1073/pnas.95.25.15008. [DOI] [PMC free article] [PubMed] [Google Scholar]
- 22.Liebe S, Hoerzer GM, Logothetis NK, Rainer G. Nat Neurosci. 2012 doi: 10.1038/nn.3038. [DOI] [PubMed] [Google Scholar]
- 23.Saalmann YB, Pigarev IN, Vidyasagar TR. Science. 2007;316:1612. doi: 10.1126/science.1139140. [DOI] [PubMed] [Google Scholar]
- 24.Brovelli A, et al. Proc Natl Acad Sci U S A. 2004;101:9849. doi: 10.1073/pnas.0308538101. [DOI] [PMC free article] [PubMed] [Google Scholar]
- 25.Miller EK, Erickson CA, Desimone R. J Neurosci. 1996;16:5154. doi: 10.1523/JNEUROSCI.16-16-05154.1996. [DOI] [PMC free article] [PubMed] [Google Scholar]
- 26.Verhoef BE, Vogels R, Janssen P. J Neurophysiol. 2011;105:2030. doi: 10.1152/jn.00924.2010. [DOI] [PMC free article] [PubMed] [Google Scholar]
- 27.Deiber MP, et al. J Cogn Neurosci. 2007;19:158. doi: 10.1162/jocn.2007.19.1.158. [DOI] [PubMed] [Google Scholar]
- 28.Gregoriou GG, Gotts SJ, Zhou H, Desimone R. Science. 2009;324:1207. doi: 10.1126/science.1171402. [DOI] [PMC free article] [PubMed] [Google Scholar]
- 29.Postle BR. Neuroscience. 2006;139:23. doi: 10.1016/j.neuroscience.2005.06.005. [DOI] [PMC free article] [PubMed] [Google Scholar]
- 30.Howard MW, et al. Cereb Cortex. 2003;13:1369. doi: 10.1093/cercor/bhg084. [DOI] [PubMed] [Google Scholar]
- 31.Lee H, Simpson GV, Logothetis NK, Rainer G. Neuron. 2005;45:147. doi: 10.1016/j.neuron.2004.12.025. [DOI] [PubMed] [Google Scholar]
- 32.Siegel M, Warden MR, Miller EK. Proc Natl Acad Sci U S A. 2009;106:21341. doi: 10.1073/pnas.0908193106. [DOI] [PMC free article] [PubMed] [Google Scholar]
Associated Data
This section collects any data citations, data availability statements, or supplementary materials included in this article.