

Abstract
The mitochondrial DNA (mtDNA) is highly variable, containing large numbers of pathogenic mutations and neutral polymorphisms. The spectrum of homoplasmic mtDNA variation was characterized in 730 subjects and compared with known pathogenic sites. The frequency and distribution of variants in protein coding genes were inversely correlated with conservation at the amino acid level. Analysis of tRNA secondary structures indicated a preference of variants for the loops and some acceptor stem positions. This comprehensive overview of mtDNA variants distinguishes between regions and positions which are likely not critical, mainly conserved regions with pathogenic mutations and essential regions containing no mutations at all.
Keywords: MitoChip, mtDNA variants, Distribution, Pathogenicity
1. Introduction
Mitochondria are essential for the production of ATP, the main source of cellular energy, by the process of oxidative phosphorylation (OXPHOS). Part of the enzyme complexes involved is encoded by the mitochondrial DNA (mtDNA). The human mtDNA consist of 16,569 base pairs and contains 13 OXPHOS protein encoding genes, two ribosomal RNA genes and 22 tRNA genes (Anderson et al., 1981). It is generally considered that the mtDNA has a higher mutation rate compared to the nuclear DNA (nDNA) which is thought to be due to a combination of less extensive repair mechanisms, the lack of protective histones and closer proximity to a major source of mutation-inducing agents, i.e. the reactive oxygen species (ROS) (Schmiedel et al., 2003). The mtDNA is present as multiple copies within the mitochondria of each cell and altered nucleotides can be present in either the homo- or heteroplasmic state (DiMauro and Schon, 2003). Not long ago it was generally accepted that the most deleterious pathogenic mutations were heteroplasmic, while homoplasmic variants were less severe risk factors or neutral polymorphic variants (Chinnery and Schon, 2003). However, recent work has revealed a growing list of pathogenic homoplasmic mtDNA variants (Lucioli et al., 2006; Valente et al., 2009), and most common pathogenic mutations are also present in the general population but usually far below the threshold level for phenotypic expression (Elliott et al., 2008). This presents a particular challenge when novel genetic variants are detected in patients with mitochondrial disease – conventional criteria cannot reliably determine which variants are phenotypically neutral, and which are actually causing disease. This is especially the case for variants in the protein coding genes and the tRNA genes, the latter compromising more than half of the published pathogenic mtDNA mutations (Chinnery and Schon, 2003; Jacobs, 2003). Pathogenic rRNA have been described to lesser extent, implicated in for example hearing loss (Leveque et al., 2007). A number of criteria and tools have been described to facilitate the classification of variants (Bhardwaj et al., 2009; McFarland et al., 2004), but a final conclusion regarding the pathogenicity of a certain variant is not always easy to achieve.
The availability of techniques to generate mutation and/or sequence information of complete mtDNA genomes at a rapid pace has opened new possibilities for the detection and classification of variable and conserved parts of the mtDNA, based on large data setsof mtDNA sequences (Dobrowolski et al., 2009; van Den Bosch et al., 2000; van Eijsden et al., 2006; White et al., 2005; Wong et al., 2004; Xiu-Cheng Fan et al., 2008). So far these studies have not been consistent on the frequency and distribution of variants in the mtDNA, both in human and mice. Some report specific hotspots for positions that are altered (McFarland et al., 2004), while others show a more random distribution of variants across the mitochondrial genome (Florentz and Sissler, 2001). Therefore, we chose to analyze the mtDNA in a large population of 730 European individuals with one technology. We applied the GeneChip® Mitochondria Resequencing Array from Affymetrix (MitoChip) as a fast and reliable method to detect homoplasmic variants in the mtDNA (Hartmann et al., 2009; Leveque et al., 2007; van Eijsden et al., 2006). As different approaches to analyze MitoChip data have been described with different sensitivity and specificity for the detection of mtDNA variants (Hartmann et al., 2009; Pandya et al., 2007; Thieme et al., 2009), we had to optimize our procedure. The study cohort contained 218 patients with mitochondrial symptoms, who could also carry pathogenic mutations in the mtDNA, which would create a risk of incidentally including non-neutral variants in the analysis. To minimize this risk we systematically checked all variants identified in this group for pathogenicity. All pathogenic and potentially pathogenic mutations, identified in 30 patients, were excluded from analysis and only polymorphisms and, based on the scoring system, predicted benign variants were included. This, together with the size of the entire cohort in majority of individuals with no mitochondrial disorders, prevents that the analysis is influenced by inclusion of pathogenic mutations. In our paper, we present novel data regarding the distribution of homoplasmic variants across the mtDNA and we provide clues to help distinguish neutral (homoplasmic) variants from highly deleterious pathogenic mutations in the tRNA genes.
2. Material and methods
2.1. DNA extraction
Total cellular DNA was isolated from muscle or blood from 730 subjects (Supplementary Table 1) according to standard procedures. Of these, 400 subjects were inhabitants with age-related hearing impairment from a residential village of Antwerp (Belgium), between 54 and 66 years old, invited through population registries (Van Eyken et al., 2007). A total of 218 subjects were patients with a variety of mitochondrial symptoms and ages between 0 and 50 years, referred to the Clinical Genetics Department in Maastricht (the Netherlands). For those subjects, the pathogenic or likely pathogenic mutation, when found, was added to Supplementary Table 1 and was not included in the further analysis. The remaining 112 subjects (with age from 54 to 75) were sequential admissions to the Critical Care Unit in Newcastle upon Tyne (United Kingdom). This cohort had an identical haplogroup distribution to the background population from the same geographical region, and thus is considered to be a random sample of individuals living in the North East of England (Baudouin et al., 2005). All known or likely pathogenic mutations (supplementary Table 2) in the entire cohort were excluded from the analysis.
2.2. MitoChip and experimental procedure
GeneChip® Mitochondria Resequencing 2.0 Arrays (Affymetrix, Santa Clara, CA, USA) were used to determine the sequence of the 730 DNA samples. In short, the entire mtDNA was amplified using the Expand Long Template system (Roche, Almere, The Netherlands) in 2 fragments (A and B) of 8207 bp and 8545 bp in length, with an overlap of 183 bp. The primers for fragment A were forward primer [5′-cgttccagtgagttcaccct-3′] and reverse primer [5′-ggtaagaagtgggctagggc-3′], and for fragment B forward primer [5′-taaacctagccatggccatc-3′] and reverse primer [5′-tgtggctaggctaagcgttt-3′]. PCR products were purified using the QIAQuick PCR cleanup kit (Qiagen). Equimolar amounts of the amplified fragments A and B were pooled and fragmented, labeled and hybridized on a pre-hybridized GeneChip according to the GeneChip CustomSeq Resequencing Array Affymetrix protocol. Chips were washed and stained on the GeneChip fluidics station 450 (Affymetrix) using the preprogrammed wash and stain protocol (Mini_DNAAR-RAY_WS5_450). The chips were scanned using the Affymetrix Gene-Chip scanner 3000 creating CEL files for subsequent analysis.
2.3. Data analysis
After generation of the cell intensity (CEL) files by GeneChip® Operating Software 1.4 (GCOS 1.4), raw sequence data was obtained by the GeneChip® Sequence Analysis Software 4.1 (GSEQ 4.1, Affymetrix) and Sequence Pilot – module SeqC (JSI medical systems) according to the flow chart depicted in Fig. 1. GSEQ uses an objective statistical framework, based upon the ABACUS algorithm (Cutler et al., 2001) to assign base calls to each position which meets quality criteria in the mitochondrial genome, based on consistent calls of both strands. GSEQ analysis was performed using the haploid model with quality score threshold (QST) 3. SeqC automatically uses all previously made analyses as controls for the actual samples and therefore is able to anticipate the shape of every peak in the software output. Dissimilarity scores are calculated for every peak and are a measure for the deviation of the peak areas from the statistical average. A warning is displayed for any peak with an abnormal high dissimilarity score. The SeqC software was used with the standard parameters. The eventual mtDNA sequences were compared with the revised Cambridge reference sequence to list all homoplasmic variants. The haplogroups were determined according to the presence or absence of the haplogroup variants listed in Supplementary Table 3. The best fitting haplogroup was assigned. The sequences of the seven species used for examining conservation of the mitochondrial genes were derived from NCBI: Homo sapiens NC_012920; Canis lupus NC_002008.4; Bos taurus NC_006853.1; Mus musculus NC_005089.1; Rattus norvegicus NC_001665.2; Gallus gallus NC_001323.1; Drosphila melanogaster NC_001709.1. A filtered list of pathogenic tRNA and protein mtDNA mutations was created from a list of disease associated mtDNA mutations in the MITOMAP database (www.mitomap.org/MITOMAP, Supplementary Table 2). Variants of which the pathogenicity status was listed in MITOMAP as ‘unclear’, ‘polymorphism’, ‘synergistic’, ‘conflicting reports’, ‘secondary’, ‘haplogroup marker’ or ‘warrants further study’, or was ‘unconvincing’ in the corresponding publication were not included. All inherited pathogenic mutations (MITOMAP ‘confirmed’) were included. For the remaining variants (MITOMAP ‘reported’), a pathogenicity score was calculated for the tRNA and protein coding mutations according to a checklist. For protein coding genes, the scoring system described previously (Mitchell et al., 2006) was used. Additionally, the conservation of the variant position (mtSNP http://mtsnp.tmig.or.jp/mtsnp/index_e.shtml; Alamut, Interactive Biosoftware) and the effect of the variant on polarity, protein structure/function (PolyPhen http://genetics.bwh.harvard.edu/pph/; SIFT http://sift.jcvi.org/www/SIFT_BLink_submit.html; InterProScan http://www.ebi.ac.uk/Tools/InterProScan/; UniProt http://www.uniprot.org/uniprot/; TMHMM http://www.cbs.dtu.dk/services/TMHMM/; MSOP http://npsa-pbil.ibcp.fr/cgi-bin/npsa_automat.pl?page=npsa_sopm.html) were evaluated. For the tRNA genes, another scoring system was used (McFarland et al. 2004). Additionally, the conservation of nucleotide and the effect of the variant on secondary or tertiary interactions (Mamit-tRNA http://mamit-trna.u-strasbg.fr/) within the tRNA molecule was evaluated. For all variants, the presence of the variant in general databases (mtSNP, mtDB http://www.genpat.uu.se/mtDB/, OMIM, PubMed, Google) was checked. Variants that were scored definitely or highly likely pathogenic, were included in the list of pathogenic mutations and excluded from further analysis. Correlation between the number of variants and the variant intensity of guanine (G) residues in the protein coding genes was analyzed using the linear regression function of SPSS.
Fig. 1.
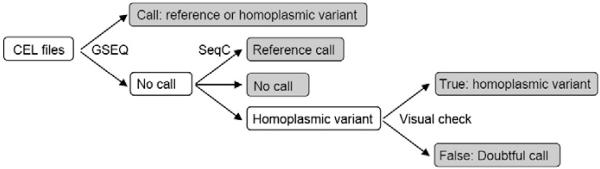
Data analysis flow chart.
3. Results
3.1. Analysis of the entire mtDNA sequence in 730 subjects
The mtDNA of 730 subjects was sequenced using the MitoChip and sequences were compared with the revised Cambridge Reference Sequence (rCRS). Because of the lower sensitivity and specificity of the MitoChip for the detection of heteroplasmic variants (Hartmann et al., 2009), the analysis was restricted to homoplasmic variants. After analysis with GSEQ, 1.3% (standard error 0.03) of the 16,544 nucleotides in the 730 samples gave a no call. The main reason was a low signal, a repetitive sequence or a C-stretch in one of the two strands (data not shown). These regions were predominantly located in the D-loop of the mtDNA and less in the protein and RNA coding genes. The D-loop was excluded from the analysis. The distribution of no calls was not homogeneous and some genes (e.g. ATP8) showed a significantly higher percentage of nucleotides that were not called than others (e.g. ND4L) (Table 1). Therefore, to reduce the number of bases with a no call, Sequence Pilot — module SeqC was used for the positions that were not called by GSEQ. Additional variants called by SeqC were checked visually. Variants scored by SeqC were only called confirmed when both forward and reverse strand clearly showed the mutant and no wild type peak. When a wild type peak was visible on one of the strands, the variant call from SeqC was depicted as ‘doubtful’. When both GSEQ and SeqC could not call a position, it remained a ‘no call’. SeqC analysis decreased the percentage of no calls from 1.096 to 0.001 (excluding the D-loop) without adding many extra different homoplasmic variants or doubtful calls. The distribution of the no calls over the different genes was more homogeneous (Table 1). Five randomly chosen additional SeqC variants were conventionally sequenced and confirmed (data not shown).
Table 1.
Results of variant and ‘no call’ analysis using the GSEQ and SeqC analysis pipeline.
| Gene | GSEQ analysis |
SeqC analysisa |
|||||
|---|---|---|---|---|---|---|---|
| # different variants | # no calls | % ntds with no callb | # different variants | # no calls | % ntds with no call | # doubtful calls | |
| ATP6 | 89c | 16,809 | 3.381 | 91c | 68 | 0.014 | 8 |
| ATP8 | 26c | 9276 | 6.139 | 27c | 3 | 0.002 | 2 |
| CYB | 115 | 10,615 | 1.274 | 115 | 9 | 0.001 | 6 |
| COI | 129 | 8245 | 0.732 | 130 | 4 | <0.001 | 3 |
| COII | 53 | 9473 | 1.897 | 57 | 11 | 0.002 | 2 |
| COIII | 69 | 3442 | 0.601 | 71 | 0 | 0.000 | 9 |
| ND1 | 95 | 9344 | 1.338 | 96 | 5 | <0.001 | 16 |
| ND2 | 113 | 10,518 | 1.383 | 114 | 16 | 0.002 | 53 |
| ND3 | 45 | 1383 | 0.548 | 4 | 2 | 0.001 | 10 |
| ND4 | 112 | 9126 | 0.907 | 114 | 15 | 0.001 | 10 |
| ND4L | 29 | 228 | 0.105 | 29 | 1 | <0.001 | 2 |
| ND5 | 185 | 15,900 | 1.202 | 187 | 3 | <0.001 | 12 |
| ND6 | 51 | 6562 | 1.712 | 55 | 1 | <0.001 | 174 |
| TRNF | 2 | 329 | 0.635 | 2 | 2 | 0.004 | 0 |
| TRNV | 1 | 4 | 0.008 | 1 | 0 | 0.000 | 1 |
| TRNL1 | 1 | 1 | 0.002 | 1 | 0 | 0.000 | 0 |
| TRNI | 4 | 322 | 0.639 | 4 | 2 | 0.004 | 0 |
| TRNQ | 3 | 58 | 0.110 | 4 | 0 | 0.000 | 3 |
| TRNM | 3 | 104 | 0.210 | 3 | 0 | 0.000 | 0 |
| TRNW | 4 | 19 | 0.038 | 4 | 0 | 0.000 | 0 |
| TRNA | 4 | 29 | 0.058 | 4 | 0 | 0.000 | 1 |
| TRNN | 0 | 1 | 0.002 | 0 | 0 | 0.000 | 0 |
| TRNC | 9 | 3 | 0.006 | 9 | 0 | 0.000 | 0 |
| TRNY | 2 | 8 | 0.017 | 2 | 0 | 0.000 | 0 |
| TRNS1 | 2 | 353 | 0.711 | 2 | 1 | 0.002 | 23 |
| TRND | 3 | 244 | 0.492 | 3 | 0 | 0.000 | 4 |
| TRNK | 2 | 35 | 0.068 | 2 | 0 | 0.000 | 1 |
| TRNG | 4 | 26 | 0.052 | 4 | 0 | 0.000 | 0 |
| TRNR | 3 | 579 | 1.220 | 3 | 1 | 0.002 | 20 |
| TRNH | 5 | 23 | 0.046 | 5 | 2 | 0.004 | 0 |
| TRNS2 | 2 | 255 | 0.592 | 2 | 0 | 0.000 | 0 |
| TRNL2 | 2 | 163 | 0.314 | 2 | 0 | 0.000 | 2 |
| TRNE | 5 | 0 | 0.000 | 5 | 0 | 0.000 | 0 |
| TRNT | 16 | 96 | 0.199 | 16 | 0 | 0.000 | 0 |
| TRNP | 0 | 75 | 0.151 | 0 | 0 | 0.000 | 0 |
| RNR1 | 38 | 3340 | 0.480 | 39 | 0 | 0.000 | 0 |
| RNR2 | 79 | 3852 | 0.338 | 80 | 5 | <0.001 | 5 |
| Total analyzedd | 1317 | 123,582 | 1.096 | 1341 | 150 | 0.001 | 394 |
Positions which were not called by GSEQ analysis were analyzed with the SeqC software and newly identified variants were checked visually. When the SeqC call was wrong, the position was recorded as a ‘doubtful call’.
Average percentage of nucleotides that were not called for 730 subjects (total number of no calls/ [length of the sequence×730 subjects] ×100).
ATP6 and ATP8 have 8 variants in common.
The mtDNA sequence was analyzed from position 577 to position 16023
3.2. Characterization of variants in the mtDNA
3.2.1. General features of the variants identified
A total of 12,063 homoplasmic variants (average 16.5 variants per subject) were detected relative to the rCRS, of which 1341 (average 1.8 per subject) were different variants at 1321 (average 1.8 per subject) different positions in the mtDNA (Supplementary Table 4). The large amount of total variants is due to the presence of European haplogroup variants which were present in a high proportion of the subjects (haplogroup and number of subjects: H 307, U 99, K 59, HV 52, J 64 and JT 73; Supplementary Table 1). The haplogroup distribution was comparable among the three cohorts (Supplementary Table 5), pointing to a generally European population, and therefore the three cohorts were merged for further analysis. Furthermore, to minimize confounding by the haplogroup variants, variant numbers mentioned in the analyses are based on the 1341 different variants.
The observed frequency of variants for each of the different nucleotides (A, C, G, T) according to the rCRS are shown in Table 2. Variants changing nucleotide A were most frequent. To correct for differences in the total number of the four nucleotides in the mtDNA regions tested, the variant intensity (Samuels et al., 2003) was calculated. This variant intensity corrected for the presence of the nucleotide in the mtDNA (excluding the D-loop) by comparing this value with the prevalence of all variants in the entire mtDNA (excluding the D-loop) (formula: [number of variants nucleotide x/total number of nucleotide x]/[total number of variants/total number of nucleotides]). The variant intensity is depicted in Table 2 and is increasing in the order C<A<T<G. Although nucleotide G showed the smallest number of variants, it had the highest variant intensity.
Table 2.
Overview of observed variants by nucleotide.
| Observed number of variantsa |
Number of nucleotideb | Variant intensityc | |||||
|---|---|---|---|---|---|---|---|
| ref\var | A | G | C | T | Total | ||
| A | - | 383 | 23 | 19 | 425 (32%) | 4785 (31%) | 1.03 |
| G | 228 | - | 7 | 2 | 237 (18%) | 2017 (13%) | 1.35 |
| C | 31 | 13 | - | 239 | 283 (21%) | 4810 (31%) | 0.68 |
| T | 13 | 16 | 367 | - | 396 (30%) | 3833 (25%) | 1.19 |
| Total | 272 | 412 | 397 | 260 | 1341 | 15,446 | |
Observed number of different variants according to the revised Cambridge Reference Sequence (rCRS).
The number of nucleotide x in the mtDNA excluding the displacement loop (position 577-16023).
Variant intensity is calculated as follows: (observed number of variants nucleotide x/total number of nucleotide x)/(total number of variants/total number of nucleotides).
3.2.2. Protein coding variants
The number of variants in the different protein coding genes was assessed (Fig. 2A). After correction for the length of the gene, differences in the prevalence of variants could be observed. On average, 10.4% of the nucleotides in the protein coding genes showed a variant in one of the 730 subjects (0.104 variants/base pair) While ATP6, ATP8 and ND3 showed the highest number of variants, COI, COII and ND4 contained fewer variants per base pair. These differences were mainly due to differences in variant numbers on codon positions 1 and 2 (Fig. 2A). In general, it was observed that the number of variants at codon positions 1 (0.070 variants/base pair) and 2 (0.036 variants/base pair) was strongly decreased compared with the 3rd position (0.192 variants/base pair) (Fig. 3). Codon position 3 variants predominantly consisted of synonymous amino acid changes, whereas codon position 1 showed only a small proportion of synonymous variants and codon position 2 variants consisted entirely of non-synonymous variants.
Fig. 2.

Variant distribution by protein coding gene. A. The observed number of variants in the whole cohort is expressed as the number of variants per base pair to correct for the length of the genes and is shown for the total gene as well as for the three different codon positions. B. Significant (p=0.004) correlation between the number of variants and the variant intensity of guanine in the protein coding genes (excluding ND6).
Fig. 3.

Variant distribution in protein coding genes by codon position, tRNA and rRNA genes and non-coding nucleotides. The observed number of variants in the whole cohort is expressed as the number of variants per base pair of each sequence type. The proportion of synonymous and non-synonymous variants is indicated.
The frequency of Cs (lowest variant intensity) or Gs (highest variant intensity) in the sequence of the genes (all positions or only third codon positions) could not explain the discrepancy in the number of variants between the different genes (data not shown). However, there was a significant (p=0.004) correlation between the number of variants and the variant intensity of G in the protein coding genes (Fig. 2B). ND6 was not included in the analysis as this gene is transcribed from the L-strand and the G content differs from the H-strand. To check for a role of evolutionary conservation in the distribution of the variants, COI (low number of variants/bp) and ATP6 (high number of variants/bp) were examined in more detail in seven species (H. sapiens, G. gallus, C. lupus, B. taurus, M. musculus, R. norvegicus and D. melanogaster). Whereas more than half of the nucleotides in the COI gene were conserved in seven species, approximately half of the variants were located at positions conserved in less than four species (Fig. 4A). In contrast, the ATP6 sequence was less well conserved (Fig. 4A) but the preference of the variants for the less conserved positions in ATP6 was lower compared with COI variants (Fig. 4A). However, no such difference could be observed when only the third codon positions were analyzed (Fig. 4B). The same trend in sequence conservation was shown for COII and COIII (low number of variants/bp) and ATP8 and ND3 (high number of variant/bp) but the preference of variants for less conserved first and second positions between the genes was less discriminating (supplementary Fig. 1). The 67 pathogenic mutations that passed our filter were all, except for five deletions, located on first and second codon positions and were mainly targeting highly conserved positions (57/67 conserved in at least 6 species; Supplementary Table 2).
Fig. 4.

Conservation of total gene sequence and variant positions in COI and ATP6 for all codon positions (A) and third codon positions (B). The human sequence of both genes was aligned with the sequence of six other species: G. gallus, C. lupus, B. taurus, M. musculus, R. norvegicus and D. melanogaster.
3.2.3. tRNA variants
In the 730 samples, only 78 different homoplasmic tRNA variants were detected. On average, 5.3% of the positions showed a variant in one of the 730 subjects (0.053 variants/base pair), in between the rate observed for codon positions 1 and 2 of the protein coding genes (Fig. 3). The location and positional conservation of these variants were compared with a list of known pathogenic tRNA mutations (Supplementary Table 2) to detect discriminating characteristics (Table 3). For the homoplasmic variants, approximately half (52%) of the variants were located in the loops of the tRNA whereas only 32% of the pathogenic mutations were located here. Homoplasmic variants were representing, among others, poorly conserved mismatch to Watson–Crick base pair (WC) changes and both poorly and highly conserved mismatch to mismatch changes in the tRNA stems, which were not present among the pathogenic mutations. While three pathogenic mutations changed WCs into severe mismatches (not A·C, C·A, G·U or U·G) on conserved positions, no homoplasmic variants caused such changes. Furthermore, when examining the conservation of the base pairing (conserved WC, G·U or mismatch base pairs), pathogenic mutations predominated in conserved base pairs compared with the homoplasmic variants (34/90 pathogenic mutations versus 7/78 homoplasmic variants).
Table 3.
Location and conservation characteristics of homoplasmic tRNA variants and pathogenic tRNA mutations.
| Location | Changea | Positional conservationb | Homoplasmic variants |
Pathogenic mutationsc |
||
|---|---|---|---|---|---|---|
| Total # (%) | # conserved pairingd | Total # (%) | # conserved pairingd | |||
| Loop | <100% | 37 (47) | 11 (12) | |||
| 100% | 4 (5) | 18 (20) | ||||
| Stem | MM>WC | <100% | 13 (17) | 2 | 0 (0) | |
| MM>WC | 100% | 1 (1) | 1 | 2 (2) | 1 | |
| MM>MM | <100% | 3 (4) | 0 (0) | |||
| MM>MM | 100% | 1 (1) | 0 (0) | |||
| WC>mMM | <100% | 16 (21) | 1 | 31 (34) | 13 | |
| WC>mMM | 100% | 3 (4) | 3 | 25 (28) | 20 | |
| WC>sMM | <100% | 0 (0) | 0 (0) | |||
| WC>sMM | 100% | 0 (0) | 3 (3) | |||
| Total | 78 | 7 | 90 | 34 | ||
Underlined data represent types of variants only present in the homoplasmic variants or pathogenic mutations group.
MM>MM = mismatch base pair to another mismatch base pair.
WC>mMM =WC to a mild mismatch base pair, mild mismatch base pairs are A·C, C·A, G·U and U·G.
WC>sMM = WC to a severe mismatch base pair, severe mismatch base pairs are all mismatch base pairs excluding A·C, C·A, G·U and U·G.
MMNWC = mismatch base pair to Watson–Crick base pair (WC).
As determined in 31 mammalian mitochondrial genomes (Helm et al., 2000).
See Supplementary Table 3 for detailed list.
Conserved pairing: 100% conserved WC or N90% G·U and U·G as determined in 31 mammalian mitochondrial genomes (Helm et al., 2000).
Finally, a heat map of all 22 tRNA secondary structures was generated according to the tRNA numbering to examine positional differences between homoplasmic variants and pathogenic mutations in more detail. In this way, the homoplasmic variants and pathogenic mutations in all tRNA molecules could be visualized in one figure (Fig. 5). Homoplasmic variants were located more often in the tRNA loops (except for the anticodon) and some positions of the acceptor stem compared with the pathogenic mutations (Fig. 5A and B). Again, it is clear that pathogenic mutations in the stem almost always cause WC to mismatch changes while a significant proportion of homoplasmic variants represents mismatch to mismatch or mismatch to WC changes (Fig. 5A and B). It can be observed that pathogenic mutations are dominating the anticodon, the anticodon stem, the D stem and part of the acceptor stem of the tRNAs (Fig. 5C).
Fig. 5.

Composite of all 22 tRNA secondary structures with variant/mutation locations. All tRNAs are merged into one figure according to tRNA number. Frequencies of homoplasmic variants (A) and pathogenic mutations (B) are appointed to each tRNA position with different colors. Stripes and dots represent the proportion of mismatch to WC or mismatch to mismatch changes, respectively, comparable to the area that is indicated. No indication means WC to mismatch change. C depicts the difference in number of homoplasmic variants and pathogenic mutations for each tRNA position.
3.2.4. rRNA variants and non-coding regions
The 12S and 16S rRNA genes showed variants with a density of 0.041 and 0.051 different variants/base pair, respectively. These numbers are only half of the average protein coding genes but are in the same range as the average variant density in tRNA genes and codon positions 1 and 2 of the protein coding genes (Fig. 3), indicating a comparable selective pressure. Non-coding nucleotides (n=58) between protein coding, rRNA and tRNA genes showed the highest number of variants with an average of 0.345 different variants per position (Fig. 3).
4. Discussion
In this study, the mtDNA of 730 subjects was analyzed using the Affymetrix MitoChip v2.0. Sequence data analysis was improved to increase the call rate without increasing the number of false positives or false negatives significantly. Homoplasmic mtDNA variants were scored to explore variable and evolutionary conserved regions.
4.1. Pipeline for identifying and analyzing mtDNA mutations
Compared with conventional sequencing, MitoChip resequencing is a fast and cost effective method to screen the whole mtDNA for homoplasmic and heteroplasmic mutations (van Eijsden et al., 2006). The mtDNA of 730 subjects was resequenced using the Affymetrix MitoChip v2.0 and base calling was performed by the GSEQ software. It has been shown previously (Hartmann et al., 2009) that the MitoChip has lower sensitivity and specificity in the detection of heteroplasmic variants. In our diagnostic experience (data not shown) the call rate of the MitoChip is >98% and the sensitivity to detect heteroplasmic mutation from 5 to 30%, which may differ for different nucleotide positions. This implies that in muscle DNA most relevant, causal heteroplasmic mutations will be detectable. Massive parallel sequencing technology will provide an alternative, especially when prices will drop and the required coverage can be reached in a cost-effective way. By massively parallel sequencing-by-synthesis, it was observed that in nearly all of the normal tissues, somatic low level heteroplasmic variants (>1.6% heteroplasmy) were present (He et al., 2010). However, the relevance of detecting such low heteroplasmy levels in relation to phenotypic expression is debatable. The MitoChip has been used in studies concerning the influence of homoplasmic polymorphisms on disease (progression) (Mithani et al., 2009; Rollins et al., 2009) and anthropological studies (Hartmann et al., 2009). We also concentrated on homoplasmic variants only (Chinnery and Schon, 2003). Highly deleterious pathogenic mutations will very rarely reach homoplasmy because homoplasmy is likely to be lethal at the cellular level (Florentz and Sissler, 2001). This is in contrast to neutral or adaptive heteroplasmic variants, which become homoplasmic or are lost within 70 cell divisions (Coller et al., 2001).
GSEQ has been reported to generate very few false negatives and false positives but a high number of no calls (Hartmann et al., 2009; Kothiyal et al., 2010), as was also observed in this study. The alternative local context probes on the MitoChip v2.0 did not provide a solution for this problem, since these probes were mainly located in the D-loop. The use of additional algorithms or masks following GSEQ analysis has been shown to improve the average call rate (Hartmann et al., 2009; Kothiyal et al.; Pandya et al., 2007; Thieme et al., 2009). In our study, the combination of the haploid model of GSEQ followed by analysis using SeqC (with a higher call rate (Schroeder et al., 2009)) turned out to be a sensitive and efficient approach. A key difference between the software programs with respect to the number of nocalls is the ability of SeqC to call a position based on one strand, where as GSEQ requires consistent calls on both strands. Furthermore, SeqC uses all previously analyzed samples as controls for the actual samples which enables a statistically validated continuous software learning process. To control for false positives, we used both software tools and all additional variants called by SeqC were checked visually. Conclusively, the current protocol was feasible for the number of MitoChips studied, making this method applicable for the analysis of MitoChip data in a large cohort of subjects.
4.2. Characterization of mtDNA variants
4.2.1. General features
In 730 subjects, 12,063 homoplasmic variants were detected in the mtDNA excluding the D-loop. D-loop variations (especially the hypervariable segments) have been characterized extensively to study variation within and between human populations (Galtier et al., 2006; Salas et al., 2000; Sigurgardottir et al., 2000; Stoneking, 2000) and were not considered further in this study. The variant intensity analysis indicated that nucleotides G and C proportionally presented with the highest and lowest variant intensities compared with A and T, respectively. This is in agreement with previously published results that showed guanine to be the least stable nucleotide and cytosine the most stable nucleotide while adenine and thymine had intermediate stability (Samuels et al., 2003; Tanaka and Ozawa, 1994). Differences in variant intensity however can only occur when there are strand-specific biases in substitution rates. This theory is reinforced by the deviation from the theoretical A=T and G=C nucleotide composition within each strand when no strand-specific bias would exist (Lobry and Sueoka, 2002). Multiple other studies have shown strand asymmetry in mutation rates (Faith and Pollock, 2003); this is probably due to periods of separation of the two DNA strands during replication, which may lead to increased mutability, and transcription-coupled repair (Green et al., 2003; Majewski, 2003).
4.2.2. Protein coding variants
Our data confirmed not unexpectedly the strong negative selection against variants on codon positions 1 and 2 due to the non-synonymous nature of variants at these positions (Soares et al., 2009; Stewart et al., 2008). Not all protein coding genes accumulated the same number of variants which was correlated with a heterogeneous guanine mutation rate. Previously, it was suggested that different mutation rates of mitochondrial genes are at least partly independent of protein structure and function and a property of the mtDNA itself (Samuels et al., 2003). The authors based their theory on segmentation of the mtDNA by differences in nucleotide composition and that the segments showed a heterogeneous guanine mutation rate. Our study indicated that the heterogeneous guanine mutation rate not only applies to the different mtDNA segments described previously (Samuels et al., 2003), but also plays a role in the individual genes. The protein coding gene results largely correspond with a previous study using data from the mtDNA mutator mice and the human mtDB database (Stewart et al., 2008).
The differences in variant accumulation in the protein coding genes may also be due to differences in selective pressure at the functional (amino acid) level. For the highly conserved COI gene, variants were mainly located on less conserved positions whereas the less well conserved ATP6 gene showed weaker preference for variants on these positions. If only third codon positions were considered in the analysis, then no differences were observed between the genes. Conclusively, the hypothesis of stronger selection against variants in genes with a high level of sequence conservation and more tolerance for variants in less well conserved genes (Stewart et al., 2008), seems valid in this data set but it only applies for functionally relevant first and second codon positions. In agreement with this, differences in variant numbers between the different genes are reflected by differences in variant numbers on codon positions 1 and 2, whereas variant numbers on positions with minor effect on protein function (codon position 3) are more or less comparable among all genes. The role of functional preservation and conservation is further emphasized by the location of the filtered list of pathogenic mutations (Supplementary Table 2) of which most were on highly conserved functionally relevant positions.
4.2.3. tRNA, rRNA and non-coding region variants (except D-loop)
The position and effect of the 78 different tRNA variants in the present data set were compared with the position and effect of the known pathogenic mutations (Supplementary Table 2). As mentioned previously (Bandelt et al., 2009; McFarland et al., 2004), for many mtDNA variants listed as pathogenic mutations in the MITO-MAP database, insufficient evidence is presented to confidently ascribe pathogenicity to these variants. For example, 40 of the 171 different mutations listed as pathogenic, also appeared to be polymorphisms in the same database and original source data should be checked (Bandelt et al., 2009; Bhardwaj et al., 2009). The major differences between the pathogenic mutation and homoplasmic variant sets were that the different homoplasmic variants (a) were located more often in the tRNA loops (41/78 compared with 29/90 for pathogenic mutations), (b) changed less WCs into mismatches in the tRNA stems (19/78 compared with 59/90 for the pathogenic mutations) and (c) affected less conserved base pairs (7/78 compared with 34/90 for the pathogenic mutations). Smaller studies based on database sequences also pointed to these differences between polymorphisms and pathogenic mutations (Florentz and Sissler, 2001; McFarland et al., 2004; Ruiz-Pesini and Wallace, 2006). The relation between conservation and pathogenicity was further demonstrated by evolutionary selection in 14 different primate species (Ruiz-Pesini and Wallace, 2006). Pathogenic loop and stem mutations were under higher evolutionary pressure than polymorphisms. For the latter, the stem was under greater selective constraint than the loop. Additionally, the mismatches in the tRNA stem were under lower selective constraint than WCs and it has been proposed that mismatch to WC changes might be adaptive in nature (Ruiz-Pesini and Wallace, 2006). The tRNA secondary structure heat map showed that pathogenic mutations were dominating the D stem, acceptor stem, anticodon stem and anticodon but the homoplasmic variants showed also some hot spots in these regions. The D loop and T loop were predominantly targeted by homoplasmic variants. Others also showed hotspots for pathogenic mutations in the acceptor and anticodon stems in smaller studies (McFarland et al., 2004). In contrast, another group (Florentz and Sissler, 2001) reported a random distribution of pathogenic mutations and polymorphisms across the tRNA structure. The different results of the latter publication may be due to the inclusion of different or more ‘pathogenic’ mutations in their analysis compared with ours. Although the amount of data on tRNA variants in the mtDNA has increased during the past years, absolute conclusions regarding the pathogenicity of mitochondrial tRNA molecules can still not be provided for every variant in those genes.
The rRNA genes showed a frequency of variants in the same range of tRNA genes and codon positions 1 and 2 of the protein coding genes. From this and the relatively low number of pathogenic rRNA mutations published, it appears that homoplasmic variants in these genes are not tolerated, which would increase the likelihood that a rRNA variant is pathogenic. However, this is in contrast with results from a mice study (Stewart et al., 2008). There, in offspring from mtDNA mutator mice, purifying selection against non-synonymous mutations in protein coding genes was evident after two generations. The rRNA and tRNA genes experienced less intense germline selection, comparable with the third codon position in protein coding genes (Stewart et al., 2008). The difference between the studies is probably due to the inclusion of heteroplasmic mutations in the mice study. The authors suggest that tRNA mutations at low heteroplasmy levels are more compatible with life than some protein coding mutations and are therefore subjected to a less rapid form of purifying selection. Although less rapid, the mechanism of purification seems to be equally important as this study showed comparable selection against variants in tRNAs, rRNAs and first and second codon positions on the population level. Since the rRNA results are comparable with the tRNA results in these studies, the same mechanism might be acting on both, although in contrast to tRNAs not many pathogenic heteroplasmic rRNA mutations have been reported. Examining if heteroplasmy is more tolerated in RNA genes than protein coding genes will give valuable information in the near future.
As expected, the 58 non-coding nucleotides in between the protein coding, rRNA and tRNA genes experienced the lowest selective pressure with the highest number of variants per base pair. This means that even the third codon position of genes is not entirely free of selection. Probably this is due to amino acids that do not allow for synonymous substitution (methionine and tryptophan) or have only limited third codon position possibilities (cysteine, aspartic acid, glutamic acid, phenylalanine, histidine, lysine, asparagine, glutamine, and tyrosine). So, based on functional conservation, it could be expected that for part of the changes on the third codon position selection occurs.
5. Conclusion
Factors such as guanine mutation rate and (functional) conservation have been shown to affect the amount and location of homoplasmic variants in the different mitochondrial genes. All coding sequences, including the third codon position, showed evidence of negative selection against variants when compared with the noncoding nucleotides between the genes. This meta analysis provided valuable information for the improvement of pathogenicity criteria and for minimizing the amount of variants that require functional follow-up. However, larger cohorts are still necessary to classify novel variants solely using mutation screening. Extension of our approach in the future, will lead to a detailed map of the mtDNA with regions and positions that are targeted by polymorphisms or pathogenic mutations or never show variation. The latter situation probably points to mutations that are not compatible with life and will never be detected. Altogether, this will provide valuable information for evaluating the pathogenicity of mtDNA variants and counseling families.
Supplementary Material
References
- Anderson S, Bankier AT, Barrell BG, de Bruijn MH, Coulson AR, Drouin J, Eperon IC, Nierlich DP, Roe BA, Sanger F, Schreier PH, Smith AJ, Staden R, Young IG. Sequence and organization of the human mitochondrial genome. Nature. 1981;290:457–465. doi: 10.1038/290457a0. [DOI] [PubMed] [Google Scholar]
- Bandelt HJ, Salas A, Taylor RW, Yao YG. Exaggerated status of “novel” and “pathogenic” mtDNA sequence variants due to inadequate database searches. Hum. Mutat. 2009;30:191–196. doi: 10.1002/humu.20846. [DOI] [PubMed] [Google Scholar]
- Baudouin SV, Saunders D, Tiangyou W, Elson JL, Poynter J, Pyle A, Keers S, Turnbull DM, Howell N, Chinnery PF. Mitochondrial DNA and survival after sepsis: a prospective study. Lancet. 2005;366:2118–2121. doi: 10.1016/S0140-6736(05)67890-7. [DOI] [PubMed] [Google Scholar]
- Bhardwaj A, Mukerji M, Sharma S, Paul J, Gokhale CS, Srivastava AK, Tiwari S. MtSNPscore: a combined evidence approach for assessing cumulative impact of mitochondrial variations in disease. BMC Bioinformatics. 2009;10(Suppl. 8):S7. doi: 10.1186/1471-2105-10-S8-S7. [DOI] [PMC free article] [PubMed] [Google Scholar]
- Chinnery PF, Schon EA. Mitochondria. J. Neurol. Neurosurg. Psychiatry. 2003;74:1188–1199. doi: 10.1136/jnnp.74.9.1188. [DOI] [PMC free article] [PubMed] [Google Scholar]
- Coller HA, Khrapko K, Bodyak ND, Nekhaeva E, Herrero-Jimenez P, Thilly WG. High frequency of homoplasmic mitochondrial DNA mutations in human tumors can be explained without selection. Nat. Genet. 2001;28:147–150. doi: 10.1038/88859. [DOI] [PubMed] [Google Scholar]
- Cutler DJ, Zwick ME, Carrasquillo MM, Yohn CT, Tobin KP, Kashuk C, Mathews DJ, Shah NA, Eichler EE, Warrington JA, Chakravarti A. High-throughput variation detection and genotyping using microarrays. Genome Res. 2001;11:1913–1925. doi: 10.1101/gr.197201. [DOI] [PMC free article] [PubMed] [Google Scholar]
- DiMauro S, Schon EA. Mitochondrial respiratory-chain diseases. N. Engl. J. Med. 2003;348:2656–2668. doi: 10.1056/NEJMra022567. [DOI] [PubMed] [Google Scholar]
- Dobrowolski SF, Hendrickx AT, van den Bosch BJ, Smeets HJ, Gray J, Miller T, Sears M. Identifying sequence variants in the human mitochondrial genome using high-resolution melt (HRM) profiling. Hum. Mutat. 2009;30:891–898. doi: 10.1002/humu.21003. [DOI] [PubMed] [Google Scholar]
- Elliott HR, Samuels DC, Eden JA, Relton CL, Chinnery PF. Pathogenic mitochondrial DNA mutations are common in the general population. Am. J. Hum. Genet. 2008;83:254–260. doi: 10.1016/j.ajhg.2008.07.004. [DOI] [PMC free article] [PubMed] [Google Scholar]
- Faith JJ, Pollock DD. Likelihood analysis of asymmetrical mutation bias gradients in vertebrate mitochondrial genomes. Genetics. 2003;165:735–745. doi: 10.1093/genetics/165.2.735. [DOI] [PMC free article] [PubMed] [Google Scholar]
- Florentz C, Sissler M. Disease-related versus polymorphic mutations in human mitochondrial tRNAs. Where is the difference? EMBO Rep. 2001;2:481–486. doi: 10.1093/embo-reports/kve111. [DOI] [PMC free article] [PubMed] [Google Scholar]
- Galtier N, Enard D, Radondy Y, Bazin E, Belkhir K. Mutation hot spots in mammalian mitochondrial DNA. Genome Res. 2006;16:215–222. doi: 10.1101/gr.4305906. [DOI] [PMC free article] [PubMed] [Google Scholar]
- Green P, Ewing B, Miller W, Thomas PJ, Green ED. Transcription-associated mutational asymmetry in mammalian evolution. Nat. Genet. 2003;33:514–517. doi: 10.1038/ng1103. [DOI] [PubMed] [Google Scholar]
- Hartmann A, Thieme M, Nanduri LK, Stempfl T, Moehle C, Kivisild T, Oefner PJ. Validation of microarray-based resequencing of 93 worldwide mitochondrial genomes. Hum. Mutat. 2009;30:115–122. doi: 10.1002/humu.20816. [DOI] [PubMed] [Google Scholar]
- He Y, Wu J, Dressman DC, Iacobuzio-Donahue C, Markowitz SD, Velculescu VE, Diaz LA, Jr., Kinzler KW, Vogelstein B, Papadopoulos N. Heteroplasmic mitochondrial DNA mutations in normal and tumour cells. Nature. 2010;464:610–614. doi: 10.1038/nature08802. [DOI] [PMC free article] [PubMed] [Google Scholar]
- Helm M, Brule H, Friede D, Giege R, Putz D, Florentz C. Search for characteristic structural features of mammalian mitochondrial tRNAs. RNA. 2000;6:1356–1379. doi: 10.1017/s1355838200001047. [DOI] [PMC free article] [PubMed] [Google Scholar]
- Jacobs HT. Disorders of mitochondrial protein synthesis. Hum. Mol. Genet. 2003;12(Spec No 2):R293–301. doi: 10.1093/hmg/ddg285. [DOI] [PubMed] [Google Scholar]
- Kothiyal P, Cox S, Ebert J, Husami A, Kenna MA, Greinwald JH, Aronow BJ, Rehm HL. High-throughput detection of mutations responsible for childhood hearing loss using resequencing microarrays. BMC Biotechnol. 2010;10:10. doi: 10.1186/1472-6750-10-10. [DOI] [PMC free article] [PubMed] [Google Scholar]
- Leveque M, Marlin S, Jonard L, Procaccio V, Reynier P, Amati-Bonneau P, Baulande S, Pierron D, Lacombe D, Duriez F, Francannet C, Mom T, Journel H, Catros H, Drouin-Garraud V, Obstoy MF, Dollfus H, Eliot MM, Faivre L, Duvillard C, Couderc R, Garabedian EN, Petit C, Feldmann D, Denoyelle F. Whole mitochondrial genome screening in maternally inherited non-syndromic hearing impairment using a microarray resequencing mitochondrial DNA chip. Eur. J. Hum. Genet. 2007;15:1145–1155. doi: 10.1038/sj.ejhg.5201891. [DOI] [PubMed] [Google Scholar]
- Lobry JR, Sueoka N. Asymmetric directional mutation pressures in bacteria. Genome Biol. 2002;3:RESEARCH0058. doi: 10.1186/gb-2002-3-10-research0058. [DOI] [PMC free article] [PubMed] [Google Scholar]
- Lucioli S, Hoffmeier K, Carrozzo R, Tessa A, Ludwig B, Santorelli FM. Introducing a novel human mtDNA mutation into the Paracoccus denitrificans COX I gene explains functional deficits in a patient. Neurogenetics. 2006;7:51–57. doi: 10.1007/s10048-005-0015-z. [DOI] [PubMed] [Google Scholar]
- Majewski J. Dependence of mutational asymmetry on gene-expression levels in the human genome. Am. J. Hum. Genet. 2003;73:688–692. doi: 10.1086/378134. [DOI] [PMC free article] [PubMed] [Google Scholar]
- McFarland R, Elson JL, Taylor RW, Howell N, Turnbull DM. Assigning pathogenicity to mitochondrial tRNA mutations: when “definitely maybe” is not good enough. Trends Genet. 2004;20:591–596. doi: 10.1016/j.tig.2004.09.014. [DOI] [PubMed] [Google Scholar]
- Mitchell AL, Elson JL, Howell N, Taylor RW, Turnbull DM. Sequence variation in mitochondrial complex I genes: mutation or polymorphism? J. Med. Genet. 2006;43:175–179. doi: 10.1136/jmg.2005.032474. [DOI] [PMC free article] [PubMed] [Google Scholar]
- Mithani SK, Shao C, Tan M, Smith IM, Califano JA, El-Naggar AK, Ha PK. Mitochondrial mutations in adenoid cystic carcinoma of the salivary glands. PLoS One. 2009;4:e8493. doi: 10.1371/journal.pone.0008493. [DOI] [PMC free article] [PubMed] [Google Scholar]
- Pandya GA, Holmes MH, Sunkara S, Sparks A, Bai Y, Verratti K, Saeed K, Venepally P, Jarrahi B, Fleischmann RD, Peterson SN. A bioinformatic filter for improved base-call accuracy and polymorphism detection using the Affymetrix GeneChip whole-genome resequencing platform. Nucleic Acids Res. 2007;35:e148. doi: 10.1093/nar/gkm918. [DOI] [PMC free article] [PubMed] [Google Scholar]
- Rollins B, Martin MV, Sequeira PA, Moon EA, Morgan LZ, Watson SJ, Schatzberg A, Akil H, Myers RM, Jones EG, Wallace DC, Bunney WE, Vawter MP. Mitochondrial variants in schizophrenia, bipolar disorder, and major depressive disorder. PLoS One. 2009;4:e4913. doi: 10.1371/journal.pone.0004913. [DOI] [PMC free article] [PubMed] [Google Scholar]
- Ruiz-Pesini E, Wallace DC. Evidence for adaptive selection acting on the tRNA and rRNA genes of human mitochondrial DNA. Hum. Mutat. 2006;27:1072–1081. doi: 10.1002/humu.20378. [DOI] [PubMed] [Google Scholar]
- Salas A, Lareu V, Calafell F, Bertranpetit J, Carracedo A. mtDNA hypervariable region II (HVII) sequences in human evolution studies. Eur. J. Hum. Genet. 2000;8:964–974. doi: 10.1038/sj.ejhg.5200563. [DOI] [PubMed] [Google Scholar]
- Samuels DC, Boys RJ, Henderson DA, Chinnery PF. A compositional segmentation of the human mitochondrial genome is related to heterogeneities in the guanine mutation rate. Nucleic Acids Res. 2003;31:6043–6052. doi: 10.1093/nar/gkg784. [DOI] [PMC free article] [PubMed] [Google Scholar]
- Schmiedel J, Jackson S, Schafer J, Reichmann H. Mitochondrial cytopathies. J. Neurol. 2003;250:267–277. doi: 10.1007/s00415-003-0978-3. [DOI] [PubMed] [Google Scholar]
- Schroeder C, Stutzmann F, Weber BH, Riess O, Bonin M. High-throughput Resequencing in the Diagnosis of BRCA1/2 Mutations Using Oligonucleotide Resequencing Microarrays. Breast Cancer Res Treat. 2009 doi: 10.1007/s10549-009-0639-z. [DOI] [PubMed] [Google Scholar]
- Sigurgardottir S, Helgason A, Gulcher JR, Stefansson K, Donnelly P. The mutation rate in the human mtDNA control region. Am. J. Hum. Genet. 2000;66:1599–1609. doi: 10.1086/302902. [DOI] [PMC free article] [PubMed] [Google Scholar]
- Soares P, Ermini L, Thomson N, Mormina M, Rito T, Rohl A, Salas A, Oppenheimer S, Macaulay V, Richards MB. Correcting for purifying selection: an improved human mitochondrial molecular clock. Am. J. Hum. Genet. 2009;84:740–759. doi: 10.1016/j.ajhg.2009.05.001. [DOI] [PMC free article] [PubMed] [Google Scholar]
- Stewart JB, Freyer C, Elson JL, Wredenberg A, Cansu Z, Trifunovic A, Larsson NG. Strong purifying selection in transmission of mammalian mitochondrial DNA. PLoS Biol. 2008;6:e10. doi: 10.1371/journal.pbio.0060010. [DOI] [PMC free article] [PubMed] [Google Scholar]
- Stoneking M. Hypervariable sites in the mtDNA control region are mutational hotspots. Am. J. Hum. Genet. 2000;67:1029–1032. doi: 10.1086/303092. [DOI] [PMC free article] [PubMed] [Google Scholar]
- Tanaka M, Ozawa T. Strand asymmetry in human mitochondrial DNA mutations. Genomics. 1994;22:327–335. doi: 10.1006/geno.1994.1391. [DOI] [PubMed] [Google Scholar]
- Thieme M, Lottaz C, Niederstatter H, Parson W, Spang R, Oefner PJ. Reseq-Chip: automated integration of multiple local context probe data from the Mito-Chip array in mitochondrial DNA sequence assembly. BMC Bioinformatics. 2009;10:440. doi: 10.1186/1471-2105-10-440. [DOI] [PMC free article] [PubMed] [Google Scholar]
- Valente L, Piga D, Lamantea E, Carrara F, Uziel G, Cudia P, Zani A, Farina L, Morandi L, Mora M, Spinazzola A, Zeviani M, Tiranti V. Identification of novel mutations in five patients with mitochondrial encephalomyopathy. Biochim. Biophys. Acta. 2009;1787:491–501. doi: 10.1016/j.bbabio.2008.10.001. [DOI] [PubMed] [Google Scholar]
- van Den Bosch BJ, de Coo RF, Scholte HR, Nijland JG, van Den Bogaard R, de Visser M, de Die-Smulders CE, Smeets HJ. Mutation analysis of the entire mitochondrial genome using denaturing high performance liquid chromatography. Nucleic Acids Res. 2000;28:E89. doi: 10.1093/nar/28.20.e89. [DOI] [PMC free article] [PubMed] [Google Scholar]
- van Eijsden RG, Gerards M, Eijssen LM, Hendrickx AT, Jongbloed RJ, Wokke JH, Hintzen RQ, Rubio-Gozalbo ME, De Coo IF, Briem E, Tiranti V, Smeets HJ. Chip-based mtDNA mutation screening enables fast and reliable genetic diagnosis of OXPHOS patients. Genet. Med. 2006;8:620–627. doi: 10.1097/01.gim.0000237782.94878.05. [DOI] [PubMed] [Google Scholar]
- Van Eyken E, Van Camp G, Fransen E, Topsakal V, Hendrickx JJ, Demeester K, Van de Heyning P, Maki-Torkko E, Hannula S, Sorri M, Jensen M, Parving A, Bille M, Baur M, Pfister M, Bonaconsa A, Mazzoli M, Orzan E, Espeso A, Stephens D, Verbruggen K, Huyghe J, Dhooge I, Huygen P, Kremer H, Cremers CW, Kunst S, Manninen M, Pyykko I, Lacava A, Steffens M, Wienker TF, Van Laer L. Contribution of the N-acetyltransferase 2 polymorphism NAT2*6A to age-related hearing impairment. J. Med. Genet. 2007;44:570–578. doi: 10.1136/jmg.2007.049205. [DOI] [PMC free article] [PubMed] [Google Scholar]
- White HE, Durston VJ, Seller A, Fratter C, Harvey JF, Cross NC. Accurate detection and quantitation of heteroplasmic mitochondrial point mutations by pyrosequencing. Genet. Test. 2005;9:190–199. doi: 10.1089/gte.2005.9.190. [DOI] [PubMed] [Google Scholar]
- Wong LJ, Chen TJ, Tan DJ. Detection of mitochondrial DNA mutations using temporal temperature gradient gel electrophoresis. Electrophoresis. 2004;25:2602–2610. doi: 10.1002/elps.200406016. [DOI] [PubMed] [Google Scholar]
- Xiu-Cheng Fan A, Garritsen HS, Tarhouny SE, Morris M, Hahn S, Holzgreve W, Zhong XY. A rapid and accurate approach to identify single nucleotide polymorphisms of mitochondrial DNA using MALDI-TOF mass spectrometry. Clin. Chem. Lab. Med. 2008;46:299–305. doi: 10.1515/CCLM.2008.071. [DOI] [PubMed] [Google Scholar]
Associated Data
This section collects any data citations, data availability statements, or supplementary materials included in this article.