

Abstract
Patient bone mineral density (BMD) predicts the likelihood of osteoporotic fracture. While substantial progress has been made toward elucidating the genetic determinants of BMD, our understanding of the factors involved remains incomplete. Here, using a systems genetics approach in the mouse, we predicted that bicaudal C homolog 1 (Bicc1), which encodes an RNA-binding protein, is responsible for a BMD quantitative trait locus (QTL) located on murine chromosome 10. Consistent with this prediction, mice heterozygous for a null allele of Bicc1 had low BMD. We used a coexpression network–based approach to determine how Bicc1 influences BMD. Based on this analysis, we inferred that Bicc1 was involved in osteoblast differentiation and that polycystic kidney disease 2 (Pkd2) was a downstream target of Bicc1. Knock down of Bicc1 and Pkd2 impaired osteoblastogenesis, and Bicc1 deficiency–dependent osteoblast defects were rescued by Pkd2 overexpression. Last, in 2 human BMD genome-wide association (GWAS) meta-analyses, we identified SNPs in BICC1 and PKD2 that were associated with BMD. These results, in both mice and humans, identify Bicc1 as a genetic determinant of osteoblastogenesis and BMD and suggest that it does so by regulating Pkd2 transcript levels.
Introduction
Osteoporosis is a disease characterized by low bone mass, skeletal fragility, and increased risk of fracture (1). Of the traits intrinsic to bone that influence its strength, bone mineral density (BMD) is one of the strongest predictors of fractures (2). BMD is also highly heritable, with approximately 70% of its variation being attributable to genetic factors. As a result, developing a comprehensive understanding of the genes and pathways that regulate BMD promises to lead to novel therapies aimed at preventing and treating bone fragility.
Genome-wide association studies (GWAS) have significantly expanded the list of known variants and genes that influence BMD (3). A recent meta-analysis of 17 BMD GWAS (Genetic Effects For Osteoporosis [GEFOS] Consortium) involving approximately 83,000 individuals identified 56 robustly significant associations (4). Interestingly, together, the associations explained less than 5% of the total phenotypic variance in BMD, suggesting that bone mass is highly polygenic and that most of the genes influencing BMD remain to be identified.
One strategy that can help fill this knowledge gap is the use of gene discovery in the mouse to inform human BMD GWAS. Several recent studies (5–10) have demonstrated the effectiveness of this strategy. To date, dozens of quantitative trait loci (QTLs) (regions of the genome harboring genetic variation influencing a quantitative trait) affecting BMD have been identified in the mouse (11), and recently the pace of identifying QTL genes has rapidly progressed. This is due in part to the development of systems genetics approaches that integrate global gene expression data into genetics studies (12–14). Systems genetics studies seek to identify genetic variation that impacts gene expression and then use this information to more rapidly identify the subset of variation that contributes to disease (12). For example, by generating global gene expression profiles in a genetic-mapping population, genes whose transcript levels are influenced by local or distant expression QTLs (eQTLs) can be identified on a genome-wide scale (15, 16). Subsequent analyses using tools such as causality modeling can then define the subset of eQTLs that are likely drivers of phenotypic differences (17, 18).
Coexpression network analysis is a distinct systems genetics approach that partitions genes into groups or modules of genes based on coexpression across a set of perturbations, such as differing genetic backgrounds. Genes that are coexpressed often have similar functions or operate in the same pathways (9, 19–21). Thus, it is possible to use coexpression networks to predict the function of novel complex disease genes based on their connections with genes of known function in a network, an approach referred to as “guilty-by-association” (9, 22–24). As a result, a systems genetics analysis that combines eQTL discovery, causality modeling, and coexpression networks can enhance gene discovery as well as provide mechanistic insight into how novel genes influence complex traits, an important step in translating genetic discoveries into an improved understanding of disease biology.
We recently described the genome-wide identification of femoral BMD QTLs in a C57BL/6J × C3H/HeJ (BXH) F2 cross and the identification of candidate genes using eQTL analysis and causality modeling (25). Here, we extend these initial observations and identify bicaudal C homolog 1 (Bicc1) as the gene responsible for one of the BMD QTLs. We also use a multifaceted approach to provide insight into the mechanism through which Bicc1 influences BMD.
Results
Bmd43 is a novel QTL.
We previously mapped 9 femoral BMD QTLs in a BXH F2 cross (25). One of the 9, Bmd42, was located at 45.8 cM (104.3 Mbp) on mouse chromosome (Chr) 10. Upon closer inspection of the Chr 10 locus, it appeared that there were at least 2 distinct QTLs, Bmd42 and a second at approximately 28 cM (~65 Mbp) (Figure 1A). Analysis of the linkage data using a 2-QTL model confirmed the independence of the second QTL, which we referred to as Bmd43 (Bmd42, P = 0.005; Bmd43, P = 0.05). Bmd42 and Bmd43 affected BMD only in male F2 mice (Figure 1A). C57BL/6J (B6) alleles at both loci increased femoral BMD relative to C3H/HeJ (C3H) alleles (Figure 1, B and C). B6 alleles at Bmd42 acted to increase BMD in a dominant manner, whereas additive inheritance was observed at Bmd43 (Figure 1, B and C). Bmd42 explained 6.5% of variance, and Bmd43 explained 3.5% of the variance in femoral BMD in males.
Figure 1. Identification of Bicc1 as the gene most likely responsible for Bmd43.

Bmd43 is a novel BMD QTL that is statistically independent of Bmd42 and affects BMD only in F2 males (A). B6 alleles at Bmd42 (B) and Bmd43 (C) increased femoral BMD in male F2 mice. Bicc1 expression in adipose tissue was regulated by a strong local eQTL in both sexes combined (red), in males (short-dashed red line), and in females (long-dashed red line) that was coincident with Bmd43 (black line) (D). Bicc1 expression in adipose tissues from male F2 mice (E), but not from females (F), was positively correlated with femoral BMD. Individual observations are color coded based on Bmd43 genotype (E and F). B6 alleles at the Bicc1 local eQTL increased Bicc1 expression in adipose, and its overall expression was higher in males (G). Causality modeling predicted that the Bicc1 local eQTL regulates BMD (H). SNPs upstream of Bicc1 were associated with its expression in bone in the Hybrid Mouse Diversity Panel (I). As observed in adipose from the BXH cross, HMDP strains homozygous for the B6 allele at the Bicc1 local eQTL demonstrated increased expression of Bicc1 in bone (J). Data presented in G and J are the means ± SEM.
A local Bicc1 eQTL is predicted to be causal for Bmd43.
We used microarray expression data generated on each individual BXH mouse to identify genes overlapping Bmd42 and Bmd43 whose expression correlated with femoral BMD and was regulated by a local eQTL. Expression data on bone were not collected in the BXH; however, data from adipose, muscle, liver, and brain were available (26). We initially used the adipose expression profiles, because adipocytes share a common cell lineage with bone-forming osteoblasts. Of the 109 genes located within the support interval for Bmd42 (92.3–113.8 Mbp) and the 386 genes in the Bmd43 support interval (46.7–81.5 Mbp), the expression levels of 9 genes (Kitl, Dusp6, Nr2c1, and Amdhd1 within Bmd42; Bicc1, 2010107G23Rik, Slc16a9, Mobkl2a, and Dcbld1 within Bmd43) were regulated by a local eQTL (lod >2.0) and correlated (nominal P < 0.05) with BMD in male mice (Table 1). Bicc1 stood out due to the fact that it had the strongest local eQTL (Figure 1D), was located (70.9 Mbp) in close proximity to the peak of Bmd43 (67.6 Mbp), and its expression was highly correlated with BMD in males (r = 0.45, P = 4.5 × 10⁻⁹; Figure 1E), but not in females (r = 0.17; P = 0.04; Figure 1F). Bicc1 expression across Bmd43 genotypes was higher in male F2 mice inheriting B6 alleles (Figure 1G). Additionally, Bicc1 levels were 35% higher in male F2 mice, independent of Bmd43 genotype (Figure 1G).
Table 1.
Genes located within the support intervals for Bmd42 and Bmd43 that are regulated by a local eQTL (lod ≤2.0) and correlated (P ≤ 0.05) with BMD in BXH F2 male mice
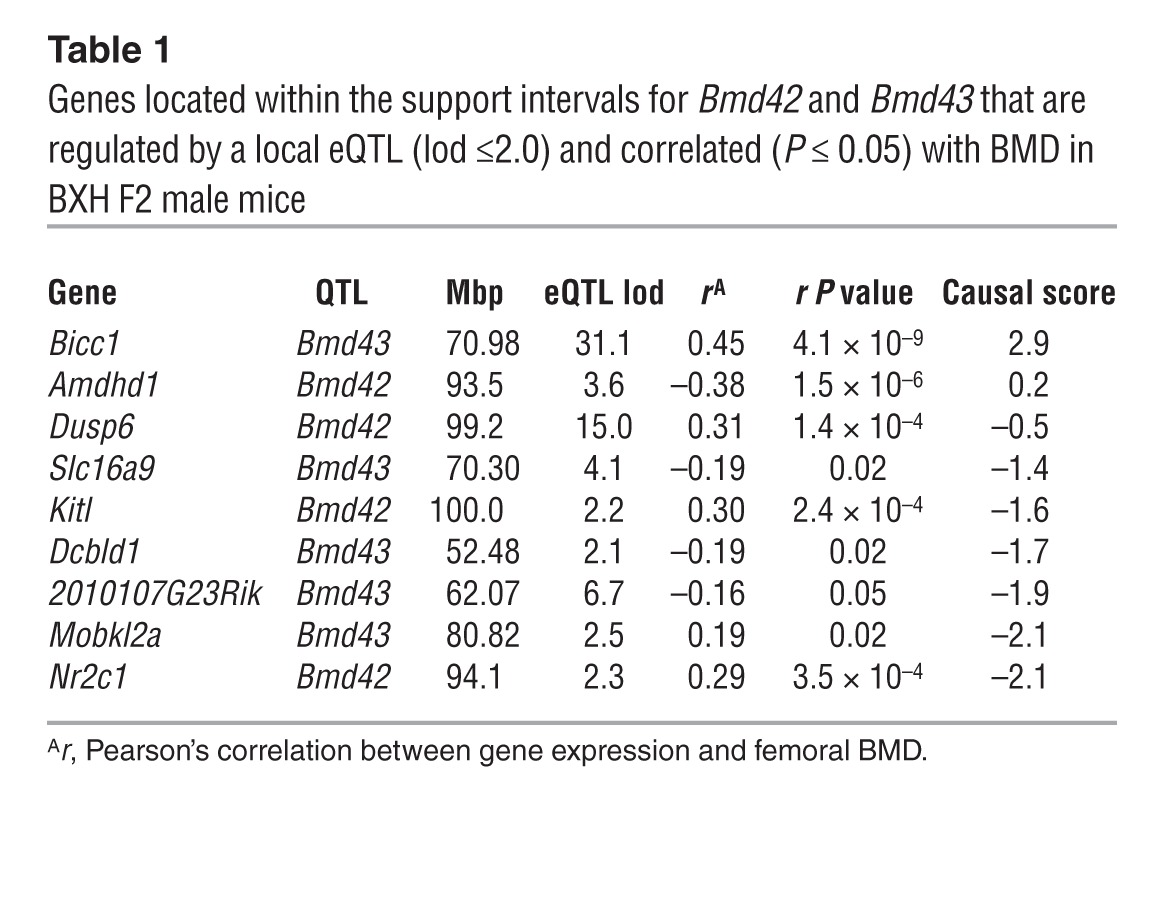
Network edge orienting (NEO) (8), a causality modeling algorithm, was used to predict whether the relationship between each candidate gene and femoral BMD was causal (gene expression caused a change in BMD), reactive (BMD caused the change in gene expression), or independent (no functional connection between the gene and BMD). Of the 9 candidates, only Bicc1 was predicted to be causal for BMD (see Methods) (Table 1 and Figure 1H). Sequencing of the region surrounding the Bicc1 microarray probe in B6 and C3H mice did not identify SNPs, excluding the possibility that the Bicc1 local eQTL and causality results were due to C3H SNPs overlapping the array probe and altering hybridization to the C3H allele (data not shown).
In addition to adipose, Bicc1 was regulated by the same local eQTL in BXH liver, brain, and muscle tissues (Supplemental Figure 1; supplemental material available online with this article; doi:10.1172/JCI73072DS1). To determine whether the same local eQTL regulated Bicc1 in bone, we used microarray data on bone from the recently described Hybrid Mouse Diversity Panel (HMDP) (9, 27). Bicc1 bone expression and 86 SNPs flanking Bicc1 in the HMDP were tested for association. Multiple SNPs upstream of Bicc1 were significantly (adjusted P < 5.8 × 10⁻⁴) associated with its expression (Figure 1I). As seen in BXH adipose tissue, HMDP strains homozygous for B6 alleles of these SNPs had higher Bicc1 expression levels (Figure 1J). Together, these data suggest that genetically regulated differences in the expression of Bicc1 are responsible for the effects of Bmd43.
Reduction in Bicc1 expression in vivo results in decreased femoral BMD.
BICC1 is an RNA-binding protein that is involved in kidney development (28–30). In mice and humans, mutations in Bicc1 lead to polycystic kidney disease (PKD) and cystic renal dysplasia, respectively (31, 32). Bicc1 has not been previously implicated in bone development. To confirm that Bicc1 was responsible for Bmd43, we measured bone mass in mice carrying the juvenile congenital polycystic kidney disease (jcpk) allele of Bicc1 (Bicc1jcpk). The Bicc1jcpk allele is the result of a chlorambucil-induced point mutation in the splice acceptor site of exon 3 (31, 33). This mutation causes exon 3 to be skipped, resulting in a frame shift, the creation of a premature stop codon, and a null Bicc1 allele (31). Homozygous Bicc1jcpk/jcpk mice develop severe early-onset PKD and die shortly after birth (31). In contrast, young heterozygous Bicc1+/jcpk mice are free of any gross abnormalities (34). Since the difference in Bicc1 expression as a function of F2 genotype in the BXH was approximately 50% (Figure 1E), we reasoned that Bicc1+/jcpk mice were an excellent model to validate the causal relationship between Bicc1 dosage and BMD. Bicc1+/jcpk mice and wild-type littermates (Bicc1+/+) of both sexes (n = 8–15/genotype/sex) were placed on a high-fat diet at 8 weeks of age to replicate the diet used in the BXH F2 cross above, and femoral BMD was measured at 12, 16, and 28 weeks. At 12 and 16 weeks of age, there was no difference in femoral BMD (Figure 2A). However, at 28 weeks of age, a significant (P = 0.001) difference in femoral BMD was observed in male Bicc1+/jcpk mice (Figure 2A). In female Bicc1+/jcpk mice, there was no difference in femoral BMD at any age (Figure 2B). In males, the increase in femoral BMD from 12 to 28 weeks was lower in Bicc1+/jcpk mice (Figure 2C). Additionally, there were no differences in lumbar spine BMD at any time point in either sex (data not shown). Micro-CT analysis of cortical bone parameters at the femoral diaphysis in 28-week-old male Bicc1+/jcpk mice revealed no differences in total area (Tt Ar), bone area (Ct Ar), medullary area (Ma Ar), or bone area fraction (Ct Ar/Tt Ar) (Figure 2, D–G). However, cortical thickness (Ct Th) (Figure 2H) and cortical tissue mineral density (TMD) were significantly (P < 0.05) decreased in Bicc1+/jcpk males (Figure 2I). In the trabecular bone compartment, there was a suggestive (P = 0.10) decrease in bone volume fraction (BV/TV) (Figure 2J). This was primarily a function of a decrease (P < 0.05) in trabecular thickness (Tb Th) (Figure 2, K–M). There were also no differences (P > 0.05) in body weight or adiposity that would explain the difference in BMD (Supplemental Figure 2). We did not observe any gross kidney pathologies or increases in kidney size in Bicc1+/jcpk male mice, nor were there differences in serum markers of kidney function (Supplemental Figure 2). The male specificity and magnitude of the BMD difference in Bicc1+/jcpk males (7.4% difference in BMD between F2 genotypes at Bmd43 [Figure 1C] and 7.7% difference in BMD between Bicc1 genotypes [Figure 2A]) are consistent with the Bicc1 local eQTL being solely responsible for Bmd43.
Figure 2. Bicc1 perturbation alters BMD in vivo.

Femoral BMD at 12, 16, and 28 weeks of age in male (A) and female (B) Bicc1+/jcpk (red) and Bicc1+/+ littermate controls (black). Change in BMD between 12 and 28 weeks of age in male Bicc1+/jcpk and Bicc1+/+ littermate controls (C). Cortical bone parameters at the femoral diaphysis determined by micro-CT in 28-week-old male Bicc1+/jcpk mice and their Bicc1+/+ littermate controls (D–I). Trabecular bone parameters at the distal femur determined by micro-CT in 28-week-old male Bicc1+/jcpk mice and their Bicc1+/+ littermate controls (J–M). Tb N, trabecular number; Tb Sp, trabecular separation. Data presented in all panels are the means ± SEM. #P < 0.10; *P < 0.05 ; **P < 0.01.
Bicc1 shares network connections with genes involved in osteoblast differentiation.
A coexpression network generated using bone microarray expression data from 96 mouse inbred strains from the HMDP was queried to predict how Bicc1 affects BMD (27). The network consisted of 13,759 genes partitioned into 21 coexpression modules. Bicc1 was a member of module 6 (M6). M6 contained 910 unique genes, and we have demonstrated that it is enriched for genes (a complete list of M6 genes is provided in Supplemental Table 1) involved in skeletal system development (P = 3.0 × 10⁻¹⁹), ossification (P = 4.6 × 10⁻¹²), bone mineralization (P = 1.5 × 10⁻⁵), and osteoblast differentiation (P = 9.6 × 10⁻⁷). It is also enriched in the homologs of genes implicated in the regulation of human BMD through GWAS (P < 0.02) (Figure 3A and ref. 35). The M6 contained 21 genes that belonged to the gene ontology (GO) category “osteoblast differentiation.” We found that the connections (connectivity was defined by a topological overlap measure [TOM] described in Methods) between Bicc1 and the 21 M6 osteoblast differentiation genes were higher than its connection to all other M6 genes (P = 4.7 × 10⁻³) and to a random set of 910 network genes (equivalent to the total number of M6 genes) (P = 7.3 × 10⁻⁸) (Figure 3B).
Figure 3. Network analysis predicts that Bicc1 plays a role in osteoblast differentiation.

Bicc1 is a member of M6 (A). The strongest (TOM >0.05) connections between M6 genes (nodes connected by lines) are displayed in A. The location of Bicc1 is highlighted and each node is colored based on the gene ontology annotations listed in the top left corner of A. Connections between Bicc1 and M6 genes involved in osteoblast differentiation (M6 osteoblast [OB] genes) were stronger than all other M6 genes and stronger than a random set of genes equivalent to the number of genes in the M6 (B). Bicc1 expression was highly correlated with the M6 (C) and M9 (D) module eigengenes. The expression levels of M6 and M9 osteoblast differentiation genes were higher in HMDP strains with high Bicc1 expression (red and green bars) (E). Data presented in B and E are the means ± SEM. *P < 0.05.
Next, we measured the correlation between Bicc1 expression and the eigengene (a summarized measure of module behavior) for all 21 modules. As expected, Bicc1 was highly correlated with the M6 eigengene (r = 0.78; P < 2.2 × 10⁻¹⁶) (Figure 3C). Of the other 20 modules, Bicc1 was also highly correlated with the module 9 (M9) eigengene (r = 0.45; P = 2.9 × 10⁻⁶) (Figure 3D). This was not unexpected, because like the M6, we have demonstrated that the M9 is specific to cells of the osteoblast lineage (35). Based on its membership in the M6 and its association with the M9, we measured the expression of the 21 genes in the M6 and the 13 genes in the M9 with “osteoblast differentiation” GO annotations in the 15 HMDP strains that displayed the lowest and highest Bicc1 expression. The expression of 31 of the 34 genes was significantly (P < 0.05) increased in Bicc1 high-expressing strains (Figure 3E), suggesting a positive association between Bicc1 expression and osteoblastogenesis.
Bicc1 is a regulator of osteoblastogenesis.
Microarray data from an extensive panel of mouse tissues and cell lines were queried to determine the tissue distribution of Bicc1 (Gene Expression Omnibus [GEO] accession number GSE10246) (http://www.biogps.org) (36, 37). Bicc1 was highly expressed in kidney tissue and in the mIMCD-3 cell line derived from kidney collecting ducts (Supplemental Figure 3), which was expected, based on the known role of Bicc1 in kidney development (31). However, of the 96 samples profiled, Bicc1 expression was the highest in primary calvarial osteoblasts (Supplemental Figure 3). Bicc1 was not expressed in osteoclasts (Supplemental Figure 3). In an independent study, we measured the expression of the two known isoforms of Bicc1, Bicc1-A, and Bicc1-B, which differ in the absence (Bicc1-A) or presence (Bicc1-B) of exon 21 (31) across a time course of differentiation in primary calvarial osteoblasts. The pattern of expression was similar for both transcripts and was rapidly induced by differentiation (P < 0.001 for both transcripts) (Figure 4A). At their peak (day 3), Bicc1-A and Bicc1-B were expressed at approximately 275% and 215%, respectively, of the control (undifferentiated) osteoblasts. Their expression decreased on day 4, then increased on day 6, and remained stable through day 14. Semiquantitative RT-PCR indicated that the overall levels of the 2 transcripts at each time point were approximately equivalent (data not shown).
Figure 4. Bicc1 regulates osteoblast differentiation.

Bicc1-A (black) and Bicc1-B (red) isoforms were differentially expressed (P < 0.001) as a function of osteoblast differentiation (A). Primary calvarial osteoblasts from Bicc1+/jcpk mice displayed reductions in alkaline phosphatase (AKP) activity (B) and mineralized nodule formation (C). Transfection of 2 independent siRNAs targeting Bicc1 (Bicc1_1 and Bicc1_2) in primary calvarial osteoblasts reduced Bicc1 expression 48 hours after transfection (D) and reduced alkaline phosphatase activity (E) and osteogenic gene expression (F) 4 days after transfection. SiRNA transfection also reduced the formation of mineralized nodules (G) 12 days after transfection, as determined by Alizarin red straining (H) and nodule counts (I). The reduction in nodule formation in Bicc1+/jcpk mice did not differ as a function of sex (osteoblasts from n = 11–20 individual neonates/sex/genotype) (I). In I, the # and * symbols represent statistically significant differences by genotype within each sex. Bicc1 expression in male and female Bicc1+/+ osteoblasts (J). Data presented in all panels (except G) are the means ± SEM. #P < 0.10; *P < 0.05.
We next measured markers of osteoblast differentiation in primary calvarial osteoblasts (pools of both sexes) from Bicc1+/+ and Bicc1+/jcpk mice. After culturing in osteogenic media, we found that alkaline phosphatase activity levels and the formation of mineralized nodules were significantly (P < 0.05) decreased in Bicc1+/jcpk osteoblasts (Figure 4, B and C). We also knocked down Bicc1 in B6 primary calvarial osteoblasts using two siRNAs, each of which targeted both isoforms, to confirm that the impairment in osteoblastogenesis in Bicc1+/jcpk cells was due to cell-autonomous functions of Bicc1. The 2 siRNAs reduced Bicc1 expression by approximately 50% (Bicc1_1) and approximately 70% (Bicc1_2) relative to a scrambled control (SC) (Figure 4D). We observed significant (P < 0.05) decreases in alkaline phosphatase activity, expression of the osteogenic markers Runx2, Sp7, Col1a1, Bglap (osteocalcin), and Ibsp and mineralized nodule formation in osteoblasts transfected with Bicc1_1 and Bicc1_2 (Figure 4, E–H). These differences displayed a dose-dependent relationship congruent with the extent of Bicc1 knock down. Together, these data indicate that Bicc1 regulates osteoblast differentiation.
We also measured mineralized nodule formation in primary calvarial osteoblasts harvested from individual Bicc1+/+ and Bicc1+/jcpk neonates of both sexes. Both male and female cells from Bicc1+/jcpk mice formed fewer nodules, but there was no difference between the sexes (Figure 4I). Bicc1 expression (both isoforms) was decreased by approximately 25% in female osteoblasts, but this difference was not significant (Figure 4J).
Network analysis and causality modeling identify Pkd2 as a putative downstream target of Bicc1.
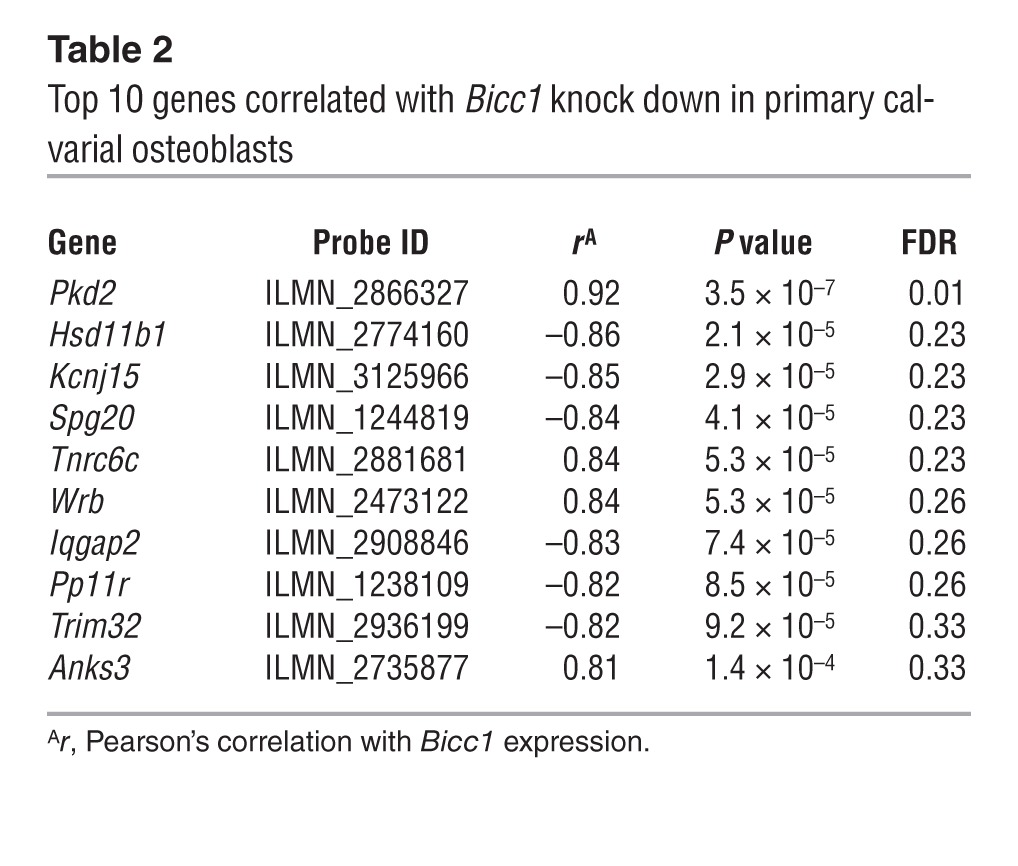
We reasoned that as an RNA-binding protein, Bicc1 would function as a post-transcriptional regulator of gene expression in osteoblasts. Therefore, we set out to identify putative Bicc1 targets. We first identified the top 15 M6 network genes that were the most strongly connected to Bicc1 (Figure 5A). Next, gene expression microarrays were used to profile primary calvarial osteoblasts after transfection with siRNA SC, Bicc1_1, Bicc1_2, and Bicc1_3 (which was not effective in knocking down Bicc1). From the array data, polycystic kidney disease 2 (Pkd2), one of the M6 genes most strongly connected to Bicc1 (Figure 5A), was the only gene significantly correlated (r = 0.92, P = 3.5 × 10⁻⁷, false discovery rate [FDR] = 0.01) with Bicc1 knock down (Figure 5B and Table 2). Pkd2 was particularly interesting, because, as with Bicc1, mutations in Pkd2 lead to PKD (38). Pkd2 encodes for polycystin-2 (PC2), a calcium channel located on primary cilia in kidney epithelium and osteoblasts (38). Bicc1 and Pkd2 expression was also highly correlated in Bicc1+/+ and Bicc1+/jcpk male and female osteoblasts (Figure 5C). As expected, Bicc1 and Pkd2 expression was highly correlated across HMDP bone samples (Figure 5D). Using NEO, Bicc1 was predicted to be upstream and causally linked to Pkd2 expression in the HMDP (Figure 5E).
Figure 5. Network analysis and causality modeling identify Pkd2 as a putative downstream target of Bicc1.

Pkd2 was one of the top 15 M6 genes that was most strongly connected with Bicc1 (A). The connection strengths (TOMs, see Methods) are labeled for each Bicc1 gene connection. Pkd2 was the only gene identified from microarray analysis whose expression was significantly (FDR <0.05) correlated with Bicc1 knock down (B). Bicc1 and Pkd2 expression were correlated in osteoblasts isolated from individual Bicc1+/jcpk and Bicc1+/+ mice of both sexes (C). Bicc1 and Pkd2 expression were correlated in the HMDP bone samples (D). Causality modeling predicted that Bicc1 is upstream of Pkd2 (E).
Table 2.
Top 10 genes correlated with Bicc1 knock down in primary calvarial osteoblasts
Pkd2 knock down impairs osteoblast differentiation.
If Bicc1 regulates osteoblastogenesis by controlling Pkd2 levels, then we would expect that Pkd2 knock down would impair osteoblast differentiation. It has already been shown that Pkd2 is expressed in osteoblasts (39), and we found that its level of expression was similar to that of Bicc1 (Supplemental Figure 4). To test this hypothesis, we knocked down the expression of Pkd2 in B6 calvarial osteoblasts. The experiments were performed using 2 unique siRNAs that reduced Pkd2 transcripts by approximately 50% (Figure 6A) and protein levels by approximately 20% (the full, uncut gel is shown in Supplemental Figure 5) 48 hours after transfection. In transfected osteoblasts, we observed significant decreases in alkaline phosphatase activity, the expression of markers of osteoblast differentiation, and mineralized nodule formation (Figure 6, B–F). The defect in osteoblast activity was identical, albeit more severe, to that of Bicc1 knock down. Next, we overexpressed Pkd2 by 2.7-fold (Supplemental Figure 5) in Bicc1+/+ and Bicc1jcpk/jcpk osteoblasts to determine whether Pkd2 could rescue the effects of Bicc1 deficiency on osteoblastogenesis. In Bicc1jcpk/jcpk osteoblasts, mineralized nodule formation was decreased, and this impairment was fully rescued by overexpression of Pkd2 (Figure 6G). These results are consistent with the prediction that Bicc1 is upstream of Pkd2 in osteoblasts.
Figure 6. Pkd2 regulates osteoblast differentiation and Pkd2 overexpression rescues the defect in osteoblastogenesis in the absence of Bicc1.

Transfection of two independent siRNAs targeting Pkd2 (Pkd2_1 and Pkd2_2) in primary calvarial osteoblasts reduced Pkd2 expression 48 hours after transfection (A) and alkaline phosphatase activity (B) and osteogenic gene expression (C) 4 days after transfection. SiRNA transfection also reduced the formation of mineralized nodules (D) 12 days after transfection, as determined by Alizarin red straining (E) and nodule counts (F). Overexpression of Pkd2 increased nodule formation and rescued impaired nodule formation in Bicc1jcpk/jcpk mice (G). Data presented in all panels (except D) are the means ± SEM. #P < 0.10, *P < 0.05.
Variants in human BICC1 and PKD2 are associated with BMD.
To evaluate whether Bicc1 and Pkd2 are relevant to human bone biology, we determined whether variants in either gene were associated with BMD using data from 2 GWAS meta-analyses. The first was a meta-analysis of dual energy x-ray absorptiometry–derived (DXA-derived) femoral neck and lumbar spine BMD conducted by the GEFOSII Consortium using 17 cohorts consisting of 32,961 individuals (the majority of which were of European ancestry) (4). The second was a meta-analysis of CT-derived lumbar spine BMD in 1,557 individuals from 4 different ethnic groups (non-Hispanic Whites, Chinese-Americans, African-Americans, or Hispanics) in the Multi-Ethnic Study of Atherosclerosis (MESA) (40). In the 2 populations, we obtained association results for SNPs located 60 Kbp upstream to the 3′ end of both genes.
In GEFOSII, 2 BICC1 SNPs were significantly (rs7096154, P = 3.0 × 10⁻⁴ and rs12247559, P = 3.7 × 10⁻⁴; adjusted P < 0.05; see Methods) associated with femoral neck BMD (Figure 7A). These variants were not in linkage disequilibrium (LD) (r2 = 0.01) based on 1,000 Genomes Project data, suggesting 2 independent association signals. The rs7096154 variant was common (minor allele frequency [MAF] = 0.42) and located 28 Kbp 5′ of BICC1. The rs12247559 variant was infrequent (MAF = 0.025) and located at 52 Kbp 5′ of BICC1. Each variant was in strong LD (r2 >0.8), with many other SNPs spanning from approximately 50 Kbp to approximately 6 Kbp upstream of BICC1. A PKD2 SNP was also significantly (rs12511728; P = 6.1 × 10⁻⁴; adjusted P < 0.05) associated with femoral neck BMD in GEFOSII (Figure 7B). The rs12511728 variant was common (MAF = 0.21) and located approximately 3 Kbp from the 5′ end of PKD2. None of these SNPs nor their proxies affected the expression of BICC1, PKD2, or any other gene based on publicly available population-based expression datasets available through the Genotype-Tissue Expression (GTEx) project (http://www.gtexportal.org/home/) (41) or the eQTL browser (http://eqtl.uchicago.edu/cgi-bin/gbrowse/eqtl/).
Figure 7. Variants in human BICC1 and PKD2 are association with BMD.

Plotted are the –log10 (P values) for associations between SNPs in the vicinity of BICC1 and BMD in GEFOSII (red squares), MESA (black circles; left axis) and BICC1 expression in skeletal muscle (blue triangles; right axis) (A). Associations between PKD2 SNPs and BMD in GEFOSII (red squares) (B). Black dotted horizontal lines in both panels are the thresholds for statistical significance of the BMD associations. The locations of SNPs are plotted across the x axis (A and B). Location of BICC1 and PKD2 is provided in the bottom of each panel. Narrow lines represent introns, and thick lines are the locations of exons (A and B). Both genes are transcribed on the forward strand (A and B).
In MESA, a single BICC1 SNP (rs10740740) was significantly (P = 3.9 × 10⁻⁴, adjusted P < 0.05 in the overall meta-analysis; P = 0.08 in Hispanics, P = 0.02 in Whites, P = 0.36 in African-Americans, and P = 0.04 in Chinese) associated with lumbar spine BMD (Figure 7A). PKD2 SNPs were not associated with BMD in MESA. The rs10740740 variant was located in the second intron of BICC1, just downstream of exon 2. Interestingly, rs10740740 and its proxies (r2 >0.95) were the only SNPs 1 Mbp up- or downstream of BICC1 that were also associated (FDR <0.05) with its expression (Figure 7A). Specifically, rs10740740 was significantly associated with BICC1 expression in skeletal muscle (P = 8.6 × 10⁻¹³), nerve (P = 4.0 × 10⁻⁷), artery (P = 6.6 × 10⁻⁷), and skin (P = 1.2 × 10⁻⁶) tissues (data from GTEx) (Figure 7A). The region around rs10740740 was evolutionarily conserved (Supplemental Figure 6), and based on ENCODE data (42), was likely to harbor regulatory elements (http://genome.ucsc.edu/cgi-bin/hgTracks?db=hg19&position=chr10%3A60377418-60387569). We also determined whether SNP-SNP interactions in BICC1 and PKD2 influenced BMD in the 2 populations, but none of the interactions were statistically significant. In light of functional studies for both genes, these data across a large number of studies, ethnic groups, skeletal sites, and BMD acquisition methods suggest that variation in BICC1 and PKD2 influence variation in human BMD. This evidence is particularly strong for BICC1 in MESA, in which the BMD-associated SNP also influenced BICC1 expression.
Discussion
New technologies and resources have positioned the mouse as a powerful platform for gene discovery and characterization. Here, we used a multifaceted systems genetics approach to identify Bicc1 as the gene responsible for a BMD QTL in the mouse. We also demonstrated that it likely does so by influencing osteoblastogenesis through the regulation of Pkd2. Importantly, we also provide evidence that BICC1 and PKD2 are involved in the regulation of human BMD.
The B6 and C3H strains were first identified by Beamer et al. as having divergent femoral BMD (43). Since this observation, there have been no fewer than 30 QTLs identified that influence the difference in BMD between these strains (11). In addition to Bicc1 identified herein, Beamer et al. identified the transcript AC084073.22 as the gene most likely responsible for a BMD QTL on mouse Chr 1 using congenic-based fine-mapping and expression analysis (44). Our group recently used the HMDP to identify Asxl2 as the gene responsible for an association with BMD on Chr 12 that was coincident with a QTL identified in a BXH F2 cross (9). Other candidate genes, including Pparg (45), Trps1 (7), Wnt9a (25), and Rasd1 (25), have been identified for BXH BMD QTLs using a wide range of approaches.
The systems genetics approach that we used consisted of identifying regulatory variation in Bicc1 that was predicted by causality modeling to be upstream and causal for the change in BMD. We believe this strategy represents a powerful paradigm, not only for skeletal traits, but for all complex traits. It is also generalizable, given the significant enrichments that have been observed for complex trait associations located in putative regulatory regions (46). One limitation of this approach is that it will not be successful in cases in which the responsible variant(s) does not affect expression or in which the change in expression is specific to a tissue not investigated. Despite this limitation, our work and that of others illustrates the power of eQTL analysis for gene discovery (25, 47, 48).
Most genetic studies stop at gene discovery. By incorporating information from a bone coexpression network (35), we were able to identify connections between Bicc1, a gene of unknown function in bone, with genes that have well-defined roles in osteoblasts and, in particular, osteoblastogenesis. Importantly, without knowing anything else, this provided us with a testable hypothesis. More importantly, the network not only provided insight into the mechanism, but also identified Pkd2 as a putative target of Bicc1 in osteoblasts. We believe this approach is extremely powerful and can obviously be applied for a number of purposes, including the use of networks to infer the function of genes identified in human GWAS.
We demonstrated that the in vivo reduction in Bicc1 expression results in decreased areal BMD, primarily through decreased cortical thickness and TMD. Osteopenia was only observed at 28 weeks in male mice. The congruency between the male-biased nature of the effects of Bmd43 and the decreased BMD in Bicc1+/jcpk male mice support a model in which the Bicc1 eQTL is solely responsible for Bmd43. However, why Bicc1 has an effect on BMD only in males is unclear. A male bias in the eQTL is unlikely, at least in adipose tissue, because the eQTL is equally strong in both sexes (Figure 1D). Androgens are known to drive periosteal apposition (49), but we did not see any difference in femoral size in Bicc1+/jcpk males, suggesting that sex hormones may not be driving the sex difference. Additionally, there is no evidence that Bicc1 expression or function is modulated directly by sex hormones. It is interesting that there is an approximately 35% increase in Bicc1 expression in adipose tissue from BXH mice (Figure 1G) and an approximately 25% increase in expression in male primary calvarial osteoblasts (Figure 4J) (although this difference was not significant). It is possible that this difference underlies the sex specificity. An alternative explanation is that the intrinsic osteoblast defect is present in both sexes, but is only manifested in males as a function of age or other stressors (e.g., a high-fat diet). There was a slight decrease in BMD in C3H homozygous females at Bmd43 (data not shown) and in Bicc1+/jcpk females (Figure 2B). It is possible that this difference becomes more pronounced with age.
The data generated herein suggest that Bicc1 affects bone mass by perturbing osteoblast function. While available data indicate that Bicc1 is not likely expressed in other bone cells (Supplemental Figure 3), we cannot rule out the possibility that Bicc1 impacts bone through one or more cell types other than osteoblasts. We also cannot exclude the possibility that Bicc1 alters the activity of other cell types indirectly through osteoblasts. Future studies using conditional knockout mice will allow us to test the hypothesis that Bicc1 impacts bone via osteoblasts in a cell-autonomous manner.
BICC1 is a 977–amino acid protein that contains 3 RNA-binding K-homology (KH) domains and a C-terminal sterile α motif (SAM) (28–30). BICC1 has been shown to bind RNA in vitro (28), and its homolog in Drosophila is involved in mRNA localization and translational regulation (30, 50). Here, we demonstrate that Bicc1 regulates, either directly or indirectly, Pkd2 transcript levels in osteoblasts. There are a number of observations from other systems that support this interaction. First, mutations in both genes cause PKD and malformations in left-right axis formation (29, 31, 51, 52), suggesting that they function in the same or similar pathways. Second, Tran et al. demonstrated that Bicc1 acts as a post-transcriptional regulator of Pkd2 in the pronephros of Xenopus (29).
One of the open questions from our work is how Bicc1 and Pkd2 impact osteoblast activity. Polycystin 1 (PC1) and PC2, encoded by Pkd1 and Pkd2, form a complex on the surface of primary cilia. PC1 acts as a receptor that, when stimulated, activates the PC2 calcium channel. In kidney epithelial cells, this complex is essential for sensing fluid flow in the developing kidney and orchestrating proper cell division (53). Mesenchymal stromal cells and mature cells of the osteoblast-osteocyte lineage also possess primary cilia (39, 54), and a number of the structural proteins of the primary cilium have been shown to play a role in the regulation of BMD and osteoblast function (55, 56). Additionally, inactivation of Pkd1 globally (39, 57) and in osteoblasts (58) leads to osteoblast dysfunction, decreased bone formation rates, and osteopenia. To our knowledge, ours is the first study to directly demonstrate that Pkd2 is involved in osteoblast activity; however, Xiao et al. did show that overexpression of a PC1 mutant that was not capable of binding PC2 failed to activate Runx2 expression in osteoblasts and PC1 deficiency–decreased calcium levels in osteoblasts (59). Therefore, it is likely that the polycystin complex functions as a chemo- or mechanosensor on primary cilia in osteoblasts (or osteocytes), similar to its role in the kidney (60, 61). Based on our data, we believe that Bicc1 is a key regulator of this complex.
An important aspect of this study is the translation between mouse and human genetic studies of BMD. In a large meta-analysis across 17 independent GWAS (GEFOSII), we identified 2 SNPs upstream of BICC1 (rs7096154, P = 3.0 × 10⁻⁴; rs12247559, P = 3.7 × 10⁻⁴) and a single SNP upstream of PKD2 (rs12511728; P = 6.1 × 10⁻⁴; adjusted P < 0.05) that were associated with BMD. The effects of all 3 variants were subtle, which is likely why they did not reach genome-wide significance in GEFOSII. Interestingly, the 2 BICC1 SNPs appear to be independent, based on their position, absence of LD, and frequency in the population (rs7096154 is common, MAF = 0.42, while rs12247559 is infrequent, MAF = 0.025). In a meta-analysis of BMD GWAS across 4 different ethnic groups in MESA, we identified a third association for BICC1 (rs10740740, P = 3.9 × 10⁻⁴). The presence of different associations in GEFOSII and MESA may relate to different BMD acquisition methods (DXA in GEFOSII and CT in MESA), skeletal sites (femoral neck in GEFOSII and lumbar spine in MESA), or the multiple ethnic groups in MESA. Future work will be needed to further characterize the role of these variants, BICC1 and PKD2 function, and BMD. The BICC1 association in MESA, however, is intriguing, given that the same SNP also influences BICC1 expression in multiple tissues, suggesting that BICC1 dosage in humans can alter BMD, similar to what we observed in mice. When considered in the context of the effects of Bicc1 perturbation on bone mass in mice, these data are highly suggestive that BICC1 also regulates BMD in humans.
In summary, we have identified Bicc1 as a positive regulator of osteoblast function and BMD using a multifaceted systems genetics approach. Our results suggest that Bicc1 is a key regulator of the PC2 calcium channel in bone. GWAS data also indicate that both genes play a role in the regulation of BMD in humans. This discovery increases our understanding of the genetic factors affecting BMD and highlights the power of systems genetics for complex trait gene discovery and functional characterization.
Methods
Mice.
The generation of the BXH F2 cross, its genotyping, and determination of femoral BMD have been previously described in detail (25). The generation and characterization of the HMDP has been described previously (9, 27). Bicc1+/jcpk males were mated with C57BL/6J females (The Jackson Laboratory) to generate Bicc1+/jcpk and Bicc1+/+ littermates. Genotyping for the Bicc1jcpk allele was performed as previously described (31). For BMD measurements, Bicc1+/jcpk and Bicc1+/+ mice were placed on a high-fat diet (88137; Harlan Teklad) at 8 weeks of age. A small breeding colony of C57BL/6J females (The Jackson Laboratory) was used for the isolation of primary calvarial osteoblasts.
BMD linkage analysis.
Linkage scans were performed using the R/qtl R package (62). To test for independence of Bmd42 and Bmd43, a 2-QTL model was fit to the male F2 BMD data using the fitqtl function. Individual QTL terms with a model of P ≤ 0.05 were deemed significant. One-lod support intervals were used to establish QTL boundaries.
eQTL and causality analysis.
We performed an eQTL analysis for genes overlapping Bmd42 and Bmd43 using expression data from BXH male F2 mice. These data are publicly available in the GEO database (GEO GSE11065 = adipose, GSE11338 = liver, GSE12798 = brain, GSE12795 = muscle), and details regarding their generation have been described previously (25). Pearson’s correlations were calculated between the expression of transcripts located within each QTL and BMD. The function scanone of R/qtl (62) was used to identify eQTL for correlated genes. eQTLs were deemed local if the eQTL peak mapped within 5 Mbp of the gene’s location and had a lod score greater than 2. NEO was used to evaluate causality as previously described (18, 25). Briefly, NEO is an R function designed to orient the relationships between genetic markers, gene expression traits, and clinical traits. NEO uses the fact that all cellular information begins with DNA, and therefore, the many possible relationships that can exist between DNA variation, gene expression, and clinical traits can be distilled to three. The three relationships (or models) are: (a) causal, in which the flow of information goes from DNA to gene to BMD (gene’s expression is causing the change in the trait); (b) reactive, in which the flow of information goes from DNA to BMD to gene (gene’s expression is reacting to the change in the trait); and (c) independent, in which DNA variation affects both traits independently. NEO uses structural equation modeling to estimate the probabilities for each of the three relationships. Simulation studies have demonstrated that single-marker causal scores above 1.0 are highly suggestive of causal relationships (18). We used the efficient mixed-model algorithm (EMMA) (63) to test for an association between SNPs in the vicinity of Bicc1 and Bicc1 expression in bone in the HMDP as previously described (9, 27). Details regarding the generation of these data have been described (9) and are publicly available in the GEO database (GEO GSE27483).
Analysis of bone mass in Bicc1+/jcpk mice.
At 12, 16, and 28 weeks of age, BMD of the left femur was measured using a Lunar PIXImus II Mouse Densitometer (Model 51045; GE Medical Systems). Distal femurs were scanned using a vivaCT 40 imaging system (Scanco Medical) to measure trabecular bone volume fraction and microarchitecture of the distal femur and cortical microarchitecture of the femoral midshaft. The samples were scanned completely submerged in 95% ethanol. Scans were performed at an energy level of 55 kVp, an intensity of 145 μA, and an isotropic voxel size of 12.5 μm. Trabecular microarchitecture was evaluated from approximately 200 consecutive slices of the secondary spongiosa. Cortical bone scans were performed at the midpoint of each femur. A total of 50 consecutive slices were scanned.
Human BICC1 and PKD2 data.
Two sources of data were used. The first was derived from a genome-wide meta-analysis of femoral neck (LS) and lumbar spine (FN) BMD, conducted as part of the GEFOS Consortium (6). The discovery samples comprised 17 GWAS studies (n = 32,961) from populations across North America, Europe, East Asia (only 1 study with ~1,000 women), and Australia. All studies were approved by their institutional ethics review committees, and all participants provided written informed consent. LS-BMD and FN-BMD were measured in all cohorts using DXA, following standard protocols. Each study performed single-variant GWAS analysis for FN-BMD and LS-BMD on 2.5 million imputed SNPs using linear regression model (population-based studies) and linear mixed-effects models (family-based studies), with adjustment for sex, age, age2, weight, and ancestral genetic background (8). The imputed genotypes were coded as continuous dosages of the minor allele (additive model) from 0 to 2 to take imputation uncertainty into account. An additive (per-allele) genetic model was applied. A fixed-effects, inverse-variance meta-analysis was performed to combine results from each study. We limited our analyses to SNPs located within BICC1 and PKD2 as well as 60 kb upstream of both genes. SNPs with minor allele frequencies of less than 1% or an imputation quality score/variance ratio of less than 0.3 were excluded from further analyses. A total of 316 SNPs were selected for BICC1 and 71 SNPs for PKD2. To correct for multiple testing, we estimated the number of independent tests of SNPs that were included in the analysis using principal component analysis. We then applied a Bonferroni’s correction to estimate the significant cutoff at P < 4.2 × 10⁻⁴ (= 0.05/number of independent tests).
The second source of data was obtained from the MESA GWAS. MESA is an observational cohort of volunteers recruited between July 2000 and August 2002 from 6 field centers in the United States. The study population at baseline consisted of 6,814 men and women aged 45 to 84 years and self-identified as non-Hispanic Whites, Chinese-Americans, African-Americans, or Hispanics who were free of clinical cardiovascular disease. A random sample of MESA participants was selected for BMD measurements. Measurement of BMD in a virtual 10-mm-thick slice of trabecular bone from each vertebra (L2–L5) used software-directed procedures. Participants were genotyped using the Affymetrix Human SNP array 6.0. SNPs were filtered for an SNP level call rate less than 95% and an individual level call rate less than 95%, and monomorphic SNPs were removed. The cleaned genotypic data were deposited with MESA phenotypic data into dbGaP as the MESA SHARe project (study accession number phs000209, http://www.ncbi.nlm.nih.gov/projects/gap/cgi-bin/study.cgi?study_id=phs000209.v7.p2). To perform genetic association analysis for SNPs in the BICC1 and PKD2 regions, we selected the same SNPs investigated in GEFOSII that were genotyped on Affymetrix 6.0 and that passed genotype quality control. Missing SNPs were imputed using IMPUTE, version 2.1.0, with HapMap Phase I and II, CEU+YRI+CHB+JPT as the reference panel (release 22, National Center for Biotechnology Information Build 36 [dbSNP b126]). We filtered according to an MAF of less than 0.01, a Hardy-Weinberg equilibrium (HWE) P value greater than 1 × 10⁻⁵, and imputation quality (R2) greater than 0.5. In all analyses, we used a basic model including age, sex, study site, and ancestry principal components (PCs) (3 in Whites, 1 in Chinese, 1 in African-Americans, 3 in Hispanics). We corrected for multiple tests using the same procedure as outlined above in GEFOSII, except that LD was assessed independently in each ethnic group, and then the meta-analysis was corrected using the maximum number of tests across the 4 groups using a Bonferroni’s correction.
Transcriptional network analysis.
Network analysis was performed using the weighted gene coexpression network analysis (WGCNA) R package (9, 22, 64). A full description of the network used to characterize Bicc1 in this study is provided in ref. 35. To generate the coexpression network, we first calculated Pearson’s correlation coefficients for all gene-gene comparisons across all microarray samples. The matrix of correlations was then converted to an adjacency matrix of connection strengths. The adjacencies were defined as α = |cor (xi, xj)|β, where xi and xj are the ith and jth gene expression traits. The power β was selected using the scale-free topology criterion previously outlined by Zhang and Horvath (65). Modules were defined as sets of genes with high topological overlap (66). The TOM between the ith and ith gene expression traits was taken as
(Equation 1),
where Σμ≠ij aiuaμj denotes the number of nodes to which both i and j are connected, and μ indexes the nodes of the network. Principal component analysis was used to generate a vector of values (first principal component) that summarized a module behavior. Network depictions were constructed using Cytoscape (67).
Bicc1 isoform expression analysis.
Using TRIzol reagent (Invitrogen), RNA was isolated from 4 wells per sampling every day from days 0 to 6, followed by every other day until day 14, with a final sampling on day 20. All samples were treated with the DNase DNA-free kit (Applied Biosystems), RNA concentrations were determined spectrophotometrically (A260), and cDNA was synthesized from random primed reverse transcription using an ABI High Capacity Reverse Transcriptase kit (Applied Biosystems). The relative abundance of isoforms A and B Bicc1 cDNA was determined with quantitative PCR (qPCR) using an ABI 7900 with SensiMix Syber Hi-ROX (Bioline) and cycle parameters of 95(10 m);[95C(15s), 60C(30s), 72(30s)] × 40 cycles. A forward primer homologous to sequences found in exon 19 (5′-CACGGATGTCTTCCAGCAGCAAG-3′) was used in the determination of both isoforms. For isoform A, a reverse primer homologous to the 3′ end of exon 20 and the 5′ end of exon 22 (5′-GTTTTTACTTAGCTCTGAGATTGC-3′) was used, whereas a reverse primer homologous to the 3′ end of exon 20 and 5′ end of exon 21 (5′-ACAGAGTCACAAACTGAGATTGC-3′) was used for isoform B. Note that the reverse primers share a 10-nucleotide sequence at their 3′ ends and that the sequences amplified in both reactions are identical. The 36B4 gene cDNA served as a reference and was amplified using the following primers: forward (5′-ACTGAGATTCGGGATATGCTGT-3′) and reverse (5′-TCCTAGACCAGTGTTCTGAGCTG-3′). Relative quantification of the Bicc1 isoforms was determined by the 2(–delta delta C(T)) method using 36B4 as the reference gene (68).
Western blot analysis of PC2.
Whole-cell lysates were electrophoresed on NuPAGE gels (Life Technologies) and transfered to nitrocellulose membranes following the manufacturer’s protocol. Blots were incubated with PC2 (H-280) antibody (sc-25749; Santa Cruz Biotechnology Inc.) to detect PC2 and then subsequently stripped and reprobed with anti–β actin (04-1116; Millipore). Signal detection was performed using the Western Lightning Plus-ECL system (PerkinElmer). Films were scanned and images were quantified using Image J software (NIH).
Characterization of Bicc1 function in osteoblasts.
The details of isolation and culture of primary calvarial osteoblast, siRNA transfection, qPCR, and osteoblast differentiation assays are described in ref. 35. Briefly, primary calvarial osteoblasts were isolated from 3- to 9-day-old neonates using sequential collagenase P digestions. Cells were plated onto 6-well plates at 300,000 cells/2 ml sterile plating media (DMEM, 10% heat-inactivated FBS, 100 U/ml penicillin, 100 μg/ml streptomycin) per well. After 24 hours, confluent cells (day 0) were washed once with Dulbecco’s PBS (DPBS) (Gibco) and placed in sterile differentiation media (DMEM, 10% FBS, 100 U/ml penicillin, 100 μg/ml streptomycin, 0.1 M ascorbic acid, 1 M B-glycerophosphate). Every 48 hours thereafter, cells were washed once with DPBS, and differentiation media were replaced. After 48 hours, media were replaced with differentiation media (MEM-α, 10% heat-inactivated FBS, 100 U/ml penicillin, 100 μg /ml streptomycin, 50 μg/ml ascorbic acid, 4 mM B-glycerophosphate) on day 0 and then changed every 2 days thereafter. For siRNA transfection experiments, cells were handled as outlined above, except they were plated at 150,000 cells/well and transfected approximately 24 hours after plating using Lipofectamine 2000 Reagent (Invitrogen) according to the manufacturer’s directions, with differentiation commencing 72 hours after plating. Stealth Select RNAi siRNAs (Invitrogen) targeting Bicc1 and Pkd2 were used to knock down their expression in calvarial osteoblasts. The sense strands of the duplex siRNA sequences were as follows: Bicc1_1, BICC1MSS294526; AAAGGAAGCAGCUCCCGAAUCCUUG, Bicc1_2, BICC1MSS234735; AAGACAGACAUGAUCAUUUCUUUGG Bicc1_3, BICC1MSS234736; UUGCUAGGCAGACAGACUCAAUGGU, Pkd2_1, PKD2MSS207692; AAACGAUGCUGCCAAUGGAGUGCU and Pkd2_2, PKD2MSS207693; AACACCUCUCGUCUCUUCAGCUUGG. The Stealth RNAi Negative Control Duplex (Invitrogen) was used as a scrambled control. qPCR was used to measure gene expression. The following primer sets were used (all sequences 5′–3′): Runx2-F, ACAGTCCCAACTTCCTGTGC; Runx2-R, TCGCTTGCACAGAGATGTTC; Sp7–F, TGCCCCAACTGTCAGGAG; Sp7–R, ACACCCGAGAGTGTGGAAAG; Col1a1-F, CCCAAGGAAAAGAAGCACGTC; Col1a1-R, AGGTCAGCTGGATAGCGACATC; Bglap–F, GAACAGACAAGTCCCACACAGC; Bglap–R, GATGTGGCGGCTGTGAAT; Ibsp-F, GAGGAGACTTCAAACGAAGAGG; Ibsp-R, AGAGACAGAGCGCAGCCAG; 36B4-F, ACTGAGATTCGGGATATGCTGT; and 36B4-R, TCCTAGACCAGTGTTCTGAGCTG. Relative quantification was determined by the 2(–delta delta C(T)) method using 36B4 as the reference gene (68). Quantitative analysis of soluble alkaline phosphatase activity in cell extracts was performed using a colorimetric kit (AnaSpec) according to the manufacturer’s instructions. Mineralized nodule formation was measured by staining cultures 12 days after differentiation with Alizarin red (40 mM) (pH 4.5). The stained cells were imaged, and the nodule number was measured using ImageJ software. Alizarin red was quantified by destaining cultures with 10% acetic acid and determining the optical density (405 nM) of the resulting solution. All results were obtained from 3 independent experiments.
Osteoblast microarray analysis.
Primary calvarial osteoblasts were isolated from B6 mice and transfected with siRNA SC, Bicc1_1, Bicc1_2, and Bicc1_3 (n = 4/treatment for a total of 16 samples). Forty-eight hours after transfection, total RNA was isolated using the QIAGEN RNeasy Mini Kit. Microarray expression profiles were generated for all samples using the Illumina MouseWG-6 v1.1 BeadChips at the Center for Public Health Genomics, Genome Sciences Laboratory of the University of Virginia. Biotin-labeled cRNA was synthesized by the total Prep RNA Amplification Kit from Ambion. cRNA was quantified and normalized to 77 ng/μl, and then 850 ng was hybridized to Beadchips. The arrays were scanned, and raw expression values were transformed using the variance stabilizing transformation (VST) algorithm (69) and normalized with the robust spline normalization (RSN) algorithm using the LumiR R package (70). The array data are available in the NCBI’s GEO database (GEO GSE51693).
Characterization of Bicc1 function in osteoblasts from individual mice.
Calvarial osteoblasts from individual neonates (n = 11–20 individual neonates/sex/genotype) were isolated and differentiated as described above, with the following modifications and additions: PCR on tail DNA was used to genotype as described above and to determine the sex of each neonate as previously described (71). Sequential trypsin-EDTA-collagenase P digestion of individual calvarium was performed in 24-well plates with 0.5 ml of digestion media per well. Isolated osteoblasts from an individual neonate were seeded into a 60-mm dish and allowed to grow for 40 to 48 hours, with a change of plating media approximately 24 hours after seeding. Cells were harvested and plated at 150,000 cells per well of a 6-well dish in 2 ml of plating media and allowed to proliferate for 48 hours, at which time the media were changed. The next day (~72 hours after seeding), the cells were washed with 2 ml 1× DPBS per well followed by the addition of 2 ml of differentiation media per well (day 0). The cells were washed and differentiation media replaced every 2 days for 12 days, with alkaline phosphatase activity and mineralization determined on day 13.
Statistics.
BMDs measured by PIXImus densitometers have a gradient of values along the y axis that results in gradually lower BMD values, moving from the top of the scan to the bottom (9, 27, 72). Therefore, we analyzed the BMD data using a linear model that included the effects of genotype, weight at sacrifice, and y-axis position of the scan. Weight at sacrifice and y-axis position were significant terms in the model. Least-squares means and the significance of the genotype term were calculated using the ls means R package. All other statistical comparisons were performed using a 2-tailed Student’s t test.
Study approval.
The animal protocol used in this study was approved by the IACUC of the University of Virginia.
Supplementary Material
Acknowledgments
The authors would like to acknowledge Ana Lira (University of Virginia), Emily A. Farber (University of Virginia), and Stefan Hargett (University of Virginia) for their technical assistance. We also thank Aldons Lusis (UCLA), Atila van Nas (UCLA), and Eric Schadt (Mount Sinai School of Medicine) for providing data from the BXH F2 cross. Research reported in this publication was supported by the National Institute of Arthritis and Musculoskeletal and Skin Diseases of the NIH (R01-AR057759, to C.R. Farber). MESA and the MESA SHARe projects are supported by contracts N01-HC-95159 through N01-HC-95169 and RR-024156 from the National Heart, Lung, and Blood Institute (NHLBI). Funding for MESA SHARe genotyping was provided by NHLBI contract N02-HL-6-4278. Funding for MESA Bone was provided by R01-HL071739. The authors thank the participants of the MESA study, the Coordinating Center, the investigators, and the study staff for their valuable contributions. A full list of participating MESA investigators and institutions can be found at http://www.mesa-nhlbi.org. The GTEx project was supported by the Common Fund of the Office of the Director of the NIH (http://commonfund.nih.gov/GTEx/index). Additional funds were provided by the National Cancer Institute (NCI), National Human Genome Research Institute (NHGRI), NHLBI, National Institute on Drug Abuse (NIDA), National Institute of Mental Health (NIMH), and National Institute of Neurological Disorders and Stroke (NINDS). Donors were enrolled at Biospecimen Source Sites funded by NCI\SAIC-Frederick Inc. (SAIC-F) subcontracts with the National Disease Research Interchange (10XS170), Roswell Park Cancer Institute (10XS171), and Science Care Inc. (X10S172). The Laboratory, Data Analysis, and Coordinating Center (LDACC) was funded through a contract (HHSN268201000029C) with the Broad Institute Inc. Biorepository operations were funded through an SAIC-F subcontract with Van Andel Institute (10ST1035). Additional data repository and project management were provided by SAIC-F (HHSN261200800001E). The Brain Bank was supported by a supplement to University of Miami grant DA006227. Statistical Methods development grants were made to the University of Geneva (MH090941), the University of Chicago (MH090951 and MH09037), the University of North Carolina at Chapel Hill (MH090936), and to Harvard University (MH090948). The data described in this manuscript were obtained from the GTEx portal on August 1, 2013.
Footnotes
Conflict of interest: The authors have declared that no conflict of interest exists.
Citation for this article:J Clin Invest. 2014;124(6):2736–2749. doi:10.1172/JCI73072.
References
- 1.Rosen CJ. Clinical practice. Postmenopausal osteoporosis. N Engl J Med. 2005;353(6):595–603. doi: 10.1056/NEJMcp043801. [DOI] [PubMed] [Google Scholar]
- 2.Johnell O, et al. Predictive value of BMD for hip and other fractures. J Bone Miner Res. 2005;20(7):1185–1194. doi: 10.1359/JBMR.050304. [DOI] [PubMed] [Google Scholar]
- 3.Richards JB, Zheng H-F, Spector TD. Genetics of osteoporosis from genome-wide association studies: advances and challenges. Nat Rev Genet. 2012;13(8):576–588. doi: 10.1038/nrg3228. [DOI] [PubMed] [Google Scholar]
- 4.Estrada K, et al. Genome-wide meta-analysis identifies 56 bone mineral density loci and reveals 14 loci associated with risk of fracture. Nat Genet. 2012;44(5):491–501. doi: 10.1038/ng.2249. [DOI] [PMC free article] [PubMed] [Google Scholar]
- 5.Klein RF, et al. Regulation of bone mass in mice by the lipoxygenase gene Alox15. Science. 2004;303(5655):229–232. doi: 10.1126/science.1090985. [DOI] [PubMed] [Google Scholar]
- 6.Tranah GJ, et al. Genetic variation in candidate osteoporosis genes, bone mineral density, and fracture risk: the study of osteoporotic fractures. Calcif Tissue Int. 2008;83(3):155–166. doi: 10.1007/s00223-008-9165-y. [DOI] [PMC free article] [PubMed] [Google Scholar]
- 7.Ackert-Bicknell CL, et al. Genetic variation in TRPS1 may regulate hip geometry as well as bone mineral density. Bone. 2012;50(5):1188–1195. doi: 10.1016/j.bone.2012.01.011. [DOI] [PMC free article] [PubMed] [Google Scholar]
- 8.Hsu Y-H, et al. An integration of genome-wide association study and gene expression profiling to prioritize the discovery of novel susceptibility Loci for osteoporosis-related traits. PLoS Genet. 2010;6(6):e1000977. doi: 10.1371/journal.pgen.1000977. [DOI] [PMC free article] [PubMed] [Google Scholar]
- 9.Farber CR, et al. Mouse genome-wide association and systems genetics identify Asxl2 as a regulator of bone mineral density and osteoclastogenesis. PLoS Genet. 2011;7(4):e1002038. doi: 10.1371/journal.pgen.1002038. [DOI] [PMC free article] [PubMed] [Google Scholar]
- 10.Ghazalpour A, et al. Hybrid mouse diversity panel: a panel of inbred mouse strains suitable for analysis of complex genetic traits. Mamm Genome. 2012;23(9-10):680–692. doi: 10.1007/s00335-012-9411-5. [DOI] [PMC free article] [PubMed] [Google Scholar]
- 11.Ackert-Bicknell CL, et al. Mouse BMD quantitative trait loci show improved concordance with human genome-wide association loci when recalculated on a new, common mouse genetic map. J Bone Miner Res. 2010;25(8):1808–1820. doi: 10.1002/jbmr.72. [DOI] [PMC free article] [PubMed] [Google Scholar]
- 12.Nadeau JH, Dudley AM. Genetics. Systems genetics. Science. 2011;331(6020):1015–1016. doi: 10.1126/science.1203869. [DOI] [PMC free article] [PubMed] [Google Scholar]
- 13.Farber CR. Using global gene expression to dissect the genetics of osteoporosis [Internet]. IBMS BoneKEy. 2010;7(10):353–363. doi: 10.1138/20100468. [DOI] [Google Scholar]
- 14.Farber CR, Lusis AJ. Future of osteoporosis genetics: enhancing genome-wide association studies. J Bone Miner Res. 2009;24(12):1937–1942. doi: 10.1359/jbmr.091101. [DOI] [PMC free article] [PubMed] [Google Scholar]
- 15.Farber CR, Lusis AJ. Integrating global gene expression analysis and genetics. Adv Genet. 2008;60:571–601. doi: 10.1016/S0065-2660(07)00420-8. [DOI] [PMC free article] [PubMed] [Google Scholar]
- 16.Rockman MV, Kruglyak L. Genetics of global gene expression. Nat Rev Genet. 2006;7(11):862–872. doi: 10.1038/nrg1964. [DOI] [PubMed] [Google Scholar]
- 17.Schadt EE, et al. An integrative genomics approach to infer causal associations between gene expression and disease. Nat Genet. 2005;37(7):710–717. doi: 10.1038/ng1589. [DOI] [PMC free article] [PubMed] [Google Scholar]
- 18.Aten JE, Fuller TF, Lusis AJ, Horvath S. Using genetic markers to orient the edges in quantitative trait networks: the NEO software. BMC Syst Biol. 2008;2:34. doi: 10.1186/1752-0509-2-34. [DOI] [PMC free article] [PubMed] [Google Scholar]
- 19.Plaisier CL, et al. A systems genetics approach implicates USF1, FADS3, and other causal candidate genes for familial combined hyperlipidemia. PLoS Genet. 2009;5(9):e1000642. doi: 10.1371/journal.pgen.1000642. [DOI] [PMC free article] [PubMed] [Google Scholar]
- 20.Farber CR. Identification of a gene module associated with BMD through the integration of network analysis and genome-wide association data. J Bone Miner Res. 2010;25(11):2359–2367. doi: 10.1002/jbmr.138. [DOI] [PubMed] [Google Scholar]
- 21.Ghazalpour A, et al. Integrating genetic and network analysis to characterize genes related to mouse weight. PLoS Genet. 2006;2(8):e130. doi: 10.1371/journal.pgen.0020130. [DOI] [PMC free article] [PubMed] [Google Scholar]
- 22.Yang X, et al. Validation of candidate causal genes for obesity that affect shared metabolic pathways and networks. Nat Genet. 2009;41(4):415–423. doi: 10.1038/ng.325. [DOI] [PMC free article] [PubMed] [Google Scholar]
- 23.Schadt EE, et al. Mapping the genetic architecture of gene expression in human liver. Plos Biol. 2008;6(5):e107. doi: 10.1371/journal.pbio.0060107. [DOI] [PMC free article] [PubMed] [Google Scholar]
- 24.Wolfe CJ, Kohane IS, Butte AJ. Systematic survey reveals general applicability of “guilt-by-association” within gene coexpression networks. BMC Bioinformatics. 2005;6:227. doi: 10.1186/1471-2105-6-227. [DOI] [PMC free article] [PubMed] [Google Scholar]
- 25.Farber CR, et al. An integrative genetics approach to identify candidate genes regulating BMD: combining linkage, gene expression, and association. J Bone Miner Res. 2009;24(1):105–116. doi: 10.1359/jbmr.080908. [DOI] [PMC free article] [PubMed] [Google Scholar]
- 26.van Nas A, et al. Expression quantitative trait loci: replication, tissue- and sex-specificity in mice. Genetics. 2010;185(3):1059–1068. doi: 10.1534/genetics.110.116087. [DOI] [PMC free article] [PubMed] [Google Scholar]
- 27.Bennett BJ, et al. A high-resolution association mapping panel for the dissection of complex traits in mice. Genome Res. 2010;20(2):281–290. doi: 10.1101/gr.099234.109. [DOI] [PMC free article] [PubMed] [Google Scholar]
- 28.Bouvrette DJ, Price SJ, Bryda EC. K homology domains of the mouse polycystic kidney disease-related protein, Bicaudal-C (Bicc1), mediate RNA binding in vitro. Nephron Exp Nephrol. 2008;108(1):e27–34. doi: 10.1159/000112913. [DOI] [PubMed] [Google Scholar]
- 29.Tran U, et al. The RNA-binding protein bicaudal C regulates polycystin 2 in the kidney by antagonizing miR-17 activity. Development. 2010;137(7):1107–1116. doi: 10.1242/dev.046045. [DOI] [PMC free article] [PubMed] [Google Scholar]
- 30.Maisonneuve C, et al. Bicaudal C, a novel regulator of Dvl signaling abutting RNA-processing bodies, controls cilia orientation and leftward flow. Development. 2009;136(17):3019–3030. doi: 10.1242/dev.038174. [DOI] [PubMed] [Google Scholar]
- 31.Cogswell C, et al. Positional cloning of jcpk/bpk locus of the mouse. Mamm Genome. 2003;14(4):242–249. doi: 10.1007/s00335-002-2241-0. [DOI] [PubMed] [Google Scholar]
- 32.Kraus MR-C, et al. Two mutations in human BICC1 resulting in Wnt pathway hyperactivity associated with cystic renal dysplasia. Hum Mutat. 2012;33(1):86–90. doi: 10.1002/humu.21610. [DOI] [PubMed] [Google Scholar]
- 33.Flaherty L, Messer A, Russell LB, Rinchik EM. Chlorambucil-induced mutations in mice recovered in homozygotes. Proc Natl Acad Sci U S A. 1992;89(7):2859–2863. doi: 10.1073/pnas.89.7.2859. [DOI] [PMC free article] [PubMed] [Google Scholar]
- 34.Flaherty L, Bryda EC, Collins D, Rudofsky U, Montogomery JC. New mouse model for polycystic kidney disease with both recessive and dominant gene effects. Kidney Int. 2007;47(2):552–558. doi: 10.1038/ki.1995.69. [DOI] [PubMed] [Google Scholar]
- 35.Calabrese G, et al. Systems genetic analysis of osteoblast-lineage cells. PLoS Genet. 2012;8(12):e1003150. doi: 10.1371/journal.pgen.1003150. [DOI] [PMC free article] [PubMed] [Google Scholar]
- 36.Wu C, et al. BioGPS: an extensible and customizable portal for querying and organizing gene annotation resources. Genome Biol. 2009;10(11):R130. doi: 10.1186/gb-2009-10-11-r130. [DOI] [PMC free article] [PubMed] [Google Scholar]
- 37.Lattin JE, et al. Expression analysis of G protein-coupled receptors in mouse macrophages. Immunome Res. 2008;4:5. doi: 10.1186/1745-7580-4-5. [DOI] [PMC free article] [PubMed] [Google Scholar]
- 38.Mochizuki T, et al. PKD2, a gene for polycystic kidney disease that encodes an integral membrane protein. Science. 1996;272(5266):1339–1342. doi: 10.1126/science.272.5266.1339. [DOI] [PubMed] [Google Scholar]
- 39.Xiao Z, et al. Cilia-like structures and polycystin-1 in osteoblasts/osteocytes and associated abnormalities in skeletogenesis and Runx2 expression. J Biol Chem. 2006;281(41):30884–30895. doi: 10.1074/jbc.M604772200. [DOI] [PMC free article] [PubMed] [Google Scholar]
- 40.Bild DE, et al. Multi-ethnic study of atherosclerosis: objectives and design. Am J Epidemiol. 2002;156(9):871–881. doi: 10.1093/aje/kwf113. [DOI] [PubMed] [Google Scholar]
- 41.GTEx Consortium The Genotype-Tissue Expression (GTEx) project. Nat Genet. 2013;45(6):580–585. doi: 10.1038/ng.2653. [DOI] [PMC free article] [PubMed] [Google Scholar]
- 42.ENCODE Project Consortium et al. An integrated encyclopedia of DNA elements in the human genome. Nature. 2012;489(7414):57–74. doi: 10.1038/nature11247. [DOI] [PMC free article] [PubMed] [Google Scholar]
- 43.Beamer WG, Donahue LR, Rosen CJ, Baylink DJ. Genetic variability in adult bone density among inbred strains of mice. Bone. 1996;18(5):397–403. doi: 10.1016/8756-3282(96)00047-6. [DOI] [PubMed] [Google Scholar]
- 44.Beamer WG, et al. BMD regulation on mouse distal chromosome 1, candidate genes, and response to ovariectomy or dietary fat. J Bone Miner Res. 2011;26(1):88–99. doi: 10.1002/jbmr.200. [DOI] [PMC free article] [PubMed] [Google Scholar]
- 45.Ackert-Bicknell CL, et al. PPARG by dietary fat interaction influences bone mass in mice and humans. J Bone Miner Res. 2008;23(9):1398–1408. doi: 10.1359/jbmr.080419. [DOI] [PMC free article] [PubMed] [Google Scholar]
- 46.Schaub MA, Boyle AP, Kundaje A, Batzoglou S, Snyder M. Linking disease associations with regulatory information in the human genome. Genome Res. 2012;22(9):1748–1759. doi: 10.1101/gr.136127.111. [DOI] [PMC free article] [PubMed] [Google Scholar]
- 47.Nica AC, Dermitzakis ET. Expression quantitative trait loci: present and future. Philos Trans R Soc Lond B Biol Sci. 2013;368(1620):20120362. doi: 10.1098/rstb.2012.0362. [DOI] [PMC free article] [PubMed] [Google Scholar]
- 48.Farber CR, et al. Genetic dissection of a major mouse obesity QTL (Carfhg2): integration of gene expression and causality modeling. Physiol Genomics. 2009;37(3):294–302. doi: 10.1152/physiolgenomics.90245.2008. [DOI] [PMC free article] [PubMed] [Google Scholar]
- 49.Vanderschueren D, et al. Androgens and bone. Endocr Rev. 2004;25(3):389–425. doi: 10.1210/er.2003-0003. [DOI] [PubMed] [Google Scholar]
- 50.Snee MJ, Macdonald PM. Bicaudal C and trailer hitch have similar roles in gurken mRNA localization and cytoskeletal organization. Dev Biol. 2009;328(2):434–444. doi: 10.1016/j.ydbio.2009.02.003. [DOI] [PMC free article] [PubMed] [Google Scholar]
- 51.Wu G, et al. Somatic inactivation of Pkd2 results in polycystic kidney disease. Cell. 1998;93(2):177–188. doi: 10.1016/S0092-8674(00)81570-6. [DOI] [PubMed] [Google Scholar]
- 52.Pennekamp P, et al. The ion channel polycystin-2 is required for left-right axis determination in mice. Curr Biol. 2002;12(11):938–943. doi: 10.1016/S0960-9822(02)00869-2. [DOI] [PubMed] [Google Scholar]
- 53.Harris PC, Torres VE. Polycystic kidney disease. Annu Rev Med. 2009;60:321–337. doi: 10.1146/annurev.med.60.101707.125712. [DOI] [PMC free article] [PubMed] [Google Scholar]
- 54.Tummala P, Arnsdorf EJ, Jacobs CR. The role of primary cilia in mesenchymal stem cell differentiation: a pivotal switch in guiding lineage commitment. Cell Mol Bioeng. 2010;3(3):207–212. doi: 10.1007/s12195-010-0127-x. [DOI] [PMC free article] [PubMed] [Google Scholar]
- 55.Ashe A, et al. Mutations in mouse Ift144 model the craniofacial, limb and rib defects in skeletal ciliopathies. Hum Mol Genet. 2012;21(8):1808–1823. doi: 10.1093/hmg/ddr613. [DOI] [PMC free article] [PubMed] [Google Scholar]
- 56.Qiu N, et al. Disruption of Kif3a in osteoblasts results in defective bone formation and osteopenia. J Cell Sci. 2012;125(pt 8):1945–1957. doi: 10.1242/jcs.095893. [DOI] [PMC free article] [PubMed] [Google Scholar]
- 57.Boulter C, et al. Cardiovascular, skeletal, and renal defects in mice with a targeted disruption of the Pkd1 gene. Proc Natl Acad Sci U S A. 2001;98(21):12174–12179. doi: 10.1073/pnas.211191098. [DOI] [PMC free article] [PubMed] [Google Scholar]
- 58.Xiao Z, et al. Conditional disruption of Pkd1 in osteoblasts results in osteopenia due to direct impairment of bone formation. J Biol Chem. 2010;285(2):1177–1187. doi: 10.1074/jbc.M109.050906. [DOI] [PMC free article] [PubMed] [Google Scholar]
- 59.Xiao Z, Zhang S, Magenheimer BS, Luo J, Quarles LD. Polycystin-1 regulates skeletogenesis through stimulation of the osteoblast-specific transcription factor RUNX2-II. J Biol Chem. 2008;283(18):12624–12634. doi: 10.1074/jbc.M710407200. [DOI] [PMC free article] [PubMed] [Google Scholar]
- 60.Xiao ZS, Quarles LD. Role of the polycytin-primary cilia complex in bone development and mechanosensing. Ann N Y Acad Sci. 2010;1192(1):410–421. doi: 10.1111/j.1749-6632.2009.05239.x. [DOI] [PMC free article] [PubMed] [Google Scholar]
- 61.Temiyasathit S, Jacobs CR. Osteocyte primary cilium and its role in bone mechanotransduction. Ann N Y Acad Sci. 2010;1192(1):422–428. doi: 10.1111/j.1749-6632.2009.05243.x. [DOI] [PMC free article] [PubMed] [Google Scholar]
- 62.Broman KW, Wu H, Sen S, Churchill GA. R/qtl: QTL mapping in experimental crosses. Bioinformatics. 2003;19(7):889–890. doi: 10.1093/bioinformatics/btg112. [DOI] [PubMed] [Google Scholar]
- 63.Kang HM, et al. Efficient control of population structure in model organism association mapping. Genetics. 2008;178(3):1709–1723. doi: 10.1534/genetics.107.080101. [DOI] [PMC free article] [PubMed] [Google Scholar]
- 64.Langfelder P, Horvath S. WGCNA: an R package for weighted correlation network analysis. BMC Bioinformatics. 2008;9:559. doi: 10.1186/1471-2105-9-559. [DOI] [PMC free article] [PubMed] [Google Scholar]
- 65.Zhang B, Horvath S. A general framework for weighted gene co-expression network analysis. Stat Appl Genet Mol Biol. 2005;4:Article17. doi: 10.2202/1544-6115.1128. [DOI] [PubMed] [Google Scholar]
- 66.Horvath S, Dong J. Geometric interpretation of gene coexpression network analysis. PLoS Comput Biol. 2008;4(8):e1000117. doi: 10.1371/journal.pcbi.1000117. [DOI] [PMC free article] [PubMed] [Google Scholar]
- 67.Shannon P, et al. Cytoscape: a software environment for integrated models of biomolecular interaction networks. Genome Res. 2003;13(11):2498–2504. doi: 10.1101/gr.1239303. [DOI] [PMC free article] [PubMed] [Google Scholar]
- 68.Livak KJ, Schmittgen TD. Analysis of relative gene expression data using real-time quantitative PCR and the 2(-Delta Delta C(T)) Method. Methods. 2001;25(4):402–408. doi: 10.1006/meth.2001.1262. [DOI] [PubMed] [Google Scholar]
- 69.Lin SM, Du P, Huber W, Kibbe WA. Model-based variance-stabilizing transformation for Illumina microarray data. Nucleic Acids Res. 2008;36(2):e11. doi: 10.1093/nar/gkm1075. [DOI] [PMC free article] [PubMed] [Google Scholar]
- 70.Du P, Kibbe WA, Lin SM. lumi: a pipeline for processing Illumina microarray. Bioinformatics. 2008;24(13):1547–1548. doi: 10.1093/bioinformatics/btn224. [DOI] [PubMed] [Google Scholar]
- 71.Clapcote SJ, Roder JC. Simplex PCR assay for sex determination in mice. BioTechniques. 2005;38(5):702–706. doi: 10.2144/05385BM05. [DOI] [PubMed] [Google Scholar]
- 72.Lopez Franco GE, O’Neil TK, Litscher SJ, Urban-Piette M, Blank RD. Accuracy and precision of PIXImus densitometry for ex vivo mouse long bones: comparison of technique and software version. J Clin Densitom. 2004;7(3):326–333. doi: 10.1385/JCD:7:3:326. [DOI] [PubMed] [Google Scholar]
Associated Data
This section collects any data citations, data availability statements, or supplementary materials included in this article.