

Abstract
Research on implicit attitudes has raised questions about how well people know their own attitudes. Most research on this question has focused on the correspondence between measures of implicit attitudes and measures of explicit attitudes, with low correspondence interpreted as showing that people have little awareness of their implicit attitudes. We took a different approach and directly asked participants to predict their results on upcoming IAT measures of implicit attitudes toward five different social groups. We found that participants were surprisingly accurate in their predictions. Across four studies, predictions were accurate regardless of whether implicit attitudes were described as true attitudes or culturally learned associations (Studies 1 and 2), regardless of whether predictions were made as specific response patterns (Study 1) or as conceptual responses (Studies 2–4), and regardless of how much experience or explanation participants received before making their predictions (Study 4). Study 3 further suggested that participants’ predictions reflected unique insight into their own implicit responses, beyond intuitions about how people in general might respond. Prediction accuracy occurred despite generally low correspondence between implicit and explicit measures of attitudes, as found in prior research. All together, the research findings cast doubt on the belief that attitudes or evaluations measured by the IAT necessarily reflect unconscious attitudes.
Keywords/phrases: Implicit attitudes, IAT, introspection, unconscious, racial bias
Considerable interest in the concept of implicit attitudes has been shown over the past two decades, both in academic outlets (e.g., Banaji & Heiphetz, 2010; Gawronski & Payne, 2010; Jost, Pelham & Carvallo, 2002; Nosek, Hawkins, & Frazier, 2012; Petty, Fazio, & Brinol, 2008; Quillian, 2008; Wittenbrink & Schwartz, 2007) and in the popular media (Gladwell, 2005; Tierney, 2008a, 2008b; The Economist, 2012; Dateline NBC, 2007; Oprah.com, 2006). The term implicit attitude is generally used to refer to an attitude (evaluation or preference) that is inferred from indirect, performance-based procedures (most popularly the Implicit Association Test [IAT], Greenwald, McGhee, & Schwartz, 1998) that avoid the direct influence of deliberative processing. This is in contrast to explicit attitudes, which are measured by self-report and necessarily involve respondents knowing that their attitudes are being assessed.1
Much of the interest in implicit attitudes stems from findings that they capture aspects of human thought and behavior that are not revealed by self-reported explicit attitudes. Correlations between implicit and explicit attitudes are often low (e.g., Nosek, 2005, 2007; Nosek & Hanson, 2008; Nosek & Smyth, 2007; for overviews, see Blair, 2001; Hofmann, Gawronski, Gschwendner, Le, & Schmitt, 2005a; Hoffmann, Geschwendner, Nosek, & Schmitt, 2005b), and studies in a number of domains show that implicit and explicit attitudes explain unique aspects of behavior (e.g., Agerström & Rooth, 2011; Blair et al., 2013; Dempsey & Mitchel, 2010; Dovidio, Kawakami, & Gaertner, 2002; Fazio, Jackson, Dunton, & Williams, 1995; Galdi, Arcuri, & Gawronski, 2008; Green et al., 2007; Rydell & McConnell, 2006; van den Bergh, Denessen, Hornstra, Voeten, & Holland, 2010; for reviews, see Friese, Hofmann, & Schmitt, 2008; Greenwald, Poehlman, Uhlmann, & Banaji, 2009).
Although implicit and explicit attitudes have been distinguished along many dimensions (e.g., Bargh, 1994; Greenwald & Banaji, 1995; Gawronski & Bodenhausen, 2006), in line with the origins of the terminology (cp. footnote 1), awareness seems to be of particular significance, such that unconscious attitudes and implicit attitudes (or conscious attitudes and explicit attitudes) are often used as interchangeable terms (e.g., Bosson, Swann & Pennebaker, 2000; Cunningham, Nazlek & Banaji, 2004; Jost et al. 2002; Phelps et al., 2000; Rudman, Greenwald, Mellott & Schwartz, 1999; Quillian, 2008). Additionally, research showing dissociations between implicit and explicit attitudes has been interpreted as suggestive evidence that implicit attitudes might generally not be available to introspection (e.g., Nosek, 2007). Some researchers have even made stronger statements that implicit attitudes cannot be introspected upon (e.g., Devos, 2008; Kassin, Fein, & Markus, 2001; Kihlstrom, 2004; McConnell, Dunn, Austin, & Rawn, 2011; Spalding & Hardin, 1999). Other researchers have argued that people probably do have access to implicit attitudes (e.g., Gawronski, Hofmann, & Wilbur, 2006; Wilson, Lindsey, & Schooler, 2000; Strack & Deutsch, 2004), often based on the finding that implicit-explicit correlations are consistently above zero, and thus some information about them must be available to conscious awareness (e.g., Gschwendner, Hofmann & Schmitt, 2006; Hofmann at el. 2005a, 2005b).
Importantly, there are several aspects of implicit attitudes of which people might or might not be aware. Gawronski et al. (2006) list three: The attitude’s source, its content, and its impact on behavior. In the current paper we are interested in awareness of an attitude’s content: Are people aware that they have implicit preferences, or biases, for certain attitude targets over others? We argue that answering this question on the basis of correlations between implicit and explicit attitudes is inconsistent with theoretical models on implicit and explicit attitudes (Gawronski et al., 2006). To elucidate this point we turn to Gawronski and Bodenhausen’s (2006) Associative-Propositional Evaluation (APE) model.
Awareness and the Associative-Propositional Evaluation Model
According to the APE model by Gawronski and Bodenhausen (2006), implicit attitudes reflect spontaneous affective reactions to an attitudinal cue, regardless of the perceiver’s beliefs that these reactions are valid or invalid. For example, many White Americans appear to have spontaneous negative reactions to Black Americans, even when that negativity is perceived as invalid (Devine, 1989; Nosek, Banaji, & Greenwald, 2002).
On the other hand, explicit attitudes (i.e., self-reported preferences) result from an inferential process in which a person tries to validate all of the propositions that are salient or considered relevant at the time the explicit attitude judgment is made. These propositions may reflect specific exemplars that come to mind (e.g., “I really like my Black friend Martin; I like Bill Cosby.”), but may also include other sources, such as values (e.g., “I strive to treat all people equally, regardless of their race or ethnicity”); other relevant knowledge (e.g., “I admire the fight certain groups have fought for their rights”); or self-presentational concerns (e.g., “I shouldn’t say that I have negative feelings towards social groups”). One may also consider spontaneous reactions in propositional form (e.g., “I initially feel uncomfortable when I meet a Black person.”). According to the APE model, an explicit attitude results from, a) decisions about the validity of each salient proposition as a basis for judgment, and b) attempts to maximize consistency among the different propositions (Gawronski & Bodenhausen, 2006; Gawronski, Brochu, Sritharan, & Strack, 2012). As a result, in some cases a person will decide on an explicit attitude that is consistent with the implicit attitude. But in other cases a person might decide that, in line with other propositions such as the examples presented above, the initial reaction is not a valid basis for an explicit attitude and consequently the stated explicit attitude is inconsistent with the person’s implicit attitude.
Importantly, one conclusion to draw from the APE model is that how people answer an explicit attitude question is irrelevant to the question of their awareness of their implicit attitude (Hahn & Gawronski, in press). This is because there are other reasons for implicit and explicit attitudes to misalign than just lack of awareness. Explicit attitude questions ask participants about the attitudes they consider valid, not about their awareness of spontaneously activated reactions (implicit attitudes). As shown in the example above, a person could be entirely aware of his or her implicit attitude, but not report it on an explicit attitude measure due to its inconsistency with other propositions. Implicit-explicit correlations reveal whether people consider their implicit attitudes valid bases for explicit attitudes, not whether they are aware of them.
Previous Research
Notwithstanding these considerations, research addressing people’s awareness of their implicit attitudes has primarily focused on correlations between implicit and explicit attitudes, and specifically on the factors that impact the magnitude of these correlations (Gschwendner at al., 2006; Jordan, Whitfield, & Zeigler-Hill, 2007; Ranganath, Smith, & Nosek, 2008; Richetin, Perugini, Perugini, Adjali, Hurling, 2007; Smith & Nosek, 2011). For example, Jordan et al. (2007) found greater correspondence between implicit and explicit measures of self-esteem for people who scored higher on faith in intuition (i.e., chronically viewing their intuitions as more valid). And Gschwendner et al. (2006) found greater correspondence between implicit and explicit interethnic attitudes for people who scored higher in private self-consciousness, although this only occurred when the participants were told to use their IAT performance to answer the explicit attitude questions (but see Hofmann et al., 2005a, who failed to find any effect of private self-consciousness in their meta-analysis). Studies in which participants are directed to consider their gut feelings or respond more spontaneously to explicit attitude questions also find small increases in correlations between implicit and explicit attitudes (Jordan et al., 2007; Ranganath et al., 2008; Smith & Nosek, 2011). In their meta-analysis, Hofmann et al. (2005a) report average correlations of .28 for affect-focused instructions, as opposed to .18 for cognition-focused instructions.
As the first study to investigate people’s understanding of their performance on an implicit attitude measure, Monteith, Voils and Ashburn-Nardo (2001) found that a majority of participants were aware that they had performed differently across the critical blocks of an IAT measure of implicit race attitudes. Furthermore, participants were more likely to attribute their performance difference to racial bias, the more they thought that they might behave out of line with their egalitarian ideals (should-would discrepancies). However, nearly two-thirds of these participants did not attribute their IAT performance to race-related attitudes, suggesting that awareness of implicit attitudes is confined to a small proportion of people, if interpretation of IAT performance is considered a measure of awareness.
Altogether, this prior research suggests that people might be able to perceive their implicit attitudes in the form of intuitions or gut reactions (i.e., people who think that such reactions are valid bases for making judgments [chronically or as instructed by a researcher] report explicit attitudes that are closer to their implicit attitudes). Additionally, research is suggestive that people might be able to observe and possibly draw attitudinal inferences from their behavior (e.g., test performance). However, the evidence is slim and appears to suggest low levels of awareness, only under certain circumstances and possibly only for some people. Additionally, the studies to date have relied on measures of explicit attitudes to indicate awareness, which confounds awareness with the propositional validation process believed to underlie these explicit attitudes (Gawronski & Bodenhausen, 2006). A question left open by prior research is whether people could be aware of their implicit reactions, even if they reject such reactions as a valid basis for an explicit attitude.
In line with this theorizing, we took a different approach to the question of awareness: We directly asked participants to predict their results on implicit attitude tests. In line with previous research we believed that participants would be able to perceive their spontaneous or implicit reactions even though only some might consider these reactions a valid basis for an explicit attitude. Accordingly, we believed that participants’ predictions of their implicit attitude results would be fairly accurate, even when they report different explicit attitudes.
The Present Research
Our research introduces a paradigm in which participants were asked to predict their own results on upcoming measures of implicit attitudes toward five different social groups. After participants completed the tests, we examined the degree to which their prior predictions corresponded with their actual test results. We used the IAT in our studies for the simple reason that it is the most widely used measure of implicit attitudes in the basic science literature, and its popularity has spread to more applied fields, including education, employment, business, politics, medicine and health (Greenwald et al., 2009; Nosek, Hawkins, & Frazier, 2011, 2012).2 The depth and breadth of the work that has relied on the IAT makes it particularly important to understand the extent to which people are aware of implicit attitudes as measured by this test.
We asked participants to predict and complete five different IATs for two reasons. First, we wanted to have a range of valenced target objects vis-à-vis the same comparison group – in these studies White adults. For instance, we included IATs that captured traditional implicit prejudice (e.g., White versus Black targets) and IATs in which the comparison group would likely be viewed less favorably than the other group (e.g., White children versus White adult targets).
The second reason for our use of five different IATs was based on theoretical considerations about the appropriate unit of analysis in considering the extent to which people are aware of their implicit attitudes. One way to examine awareness would be to assess the degree to which participants can make accurate prediction relative to other participants. This would involve correlating predictions and IAT scores across participants (between-subjects), one attitude target at a time. Another strategy would be to examine whether participants can make accurate predictions for one attitude object compared to other attitude objects. This latter method would look at the correlations between predictions and implicit attitude scores within-subjects (i.e., for each participant), across the five attitude targets. We believe that this second method of examining the accuracy of implicit attitude predictions is theoretically preferable.
To make accurate predictions of their implicit attitude results relative to the results of others (i.e., a between-subject analyses), participants need to have access not only to their own responses but also to knowledge of where their own responses line up relative to others’ responses. Although this latter question is interesting, it is altogether a different question. We were interested in whether participants could predict their own implicit attitude results, rather than their correctness in estimating how their attitudes compare to the attitudes of others. For these reasons, we examined the accuracy of participants’ implicit attitude predictions by correlating them with actual IAT scores within-subjects, across the five IAT’s that each participant completed. We then aggregated these correlations in a multi-level analysis to determine the accuracy of participants’ predictions on average. We return to the question of how one’s implicit attitude predictions compare to other people’s predictions towards the end of this paper, in a separate analysis across studies.
Study 1
In addition to the general question of whether people would be able to accurately predict their implicit attitude results, we pursued another question in Studies 1 and 2. Specifically, one of the explanations given for discrepancies between implicit and explicit attitudes is that people distort their explicit reports when being honest would reflect poorly on their desired self concepts (e.g., negative attitudes toward minority groups in the face of egalitarian social norms; Gawronski et al., 2006; Nosek, 2005, 2007; Wilson et al., 2000). To examine this possibility, half of the participants in Study 1 were informed that implicit attitudes are really cultural associations that may or may not reflect their true selves (removing self-concept threat), whereas the other participants were told that implicit attitudes are their true attitudes. If accuracy in predictions of one’s implicit attitudes are vulnerable to self-enhancing repression (Gawronski et al., 2006; Wilson et al., 2000), then participants ought to make worse predictions in the “true attitudes” condition than in the less threatening “cultural associations” condition (Uhlmann & Nosek, 2012; Uhlmann, Poehlman, & Nosek, 2012).
Method
Participants and Design
Our aim in this and all the following studies was to collect at least 30–50 participants per between-subject (level-2) condition depending on availability of participants in the psychology subject pool of the University of Colorado Boulder at the time the studies were run. No data were analyzed until the full samples reported here were collected.
Sixty-nine undergraduate students participated in Study 1 for partial course credit. One participant did not complete the measures and three more participants made too-fast responses (< 300 ms) on more than 10% of their IAT trials and were thus excluded in accordance with criteria outlined by Greenwald, Nosek, and Banaji (2003). For the remaining 65 participants, 54% were women, and 82% self-identified as White. The other ethnic/racial identities were, “other” or multi-racial (5), Latino (3), Asian (2), Black (1), and Middle-Eastern (1). Ages ranged from 18–25, with a median age of 19.
This study used a multi-level design. The continuous relationship between the five IAT score predictions and the five IAT scores were modeled at level 1 for each participant. The outcome of this relationship was modeled across participants at level 2. At level 2 we additionally assessed the influence of the two differing IAT explanations on the strength of this relationship.
Materials
The IATs
Participants completed five evaluative (good vs. bad) IATs in an order that was individually randomized for each participant. Each IAT compared a different social group with the same comparison group (non-celebrity (unfamiliar) White young adults). The comparisons were labeled as, Black vs. White, Latino vs. White, Asian vs. White, Celebrity vs. Regular Person, and Child vs. Adult. All pictures representing children and celebrities also looked White to ensure the target social dimension was perceived as intended.
Ten faces (five male and five female) representing each social group were selected from the productive ageing lab database (Minear & Park, 2004) and from photos found publicly available online. Each face had a neutral expression, included the person’s hair and neck, and was shown against a grey background. The pictures used in each IAT were pretested and matched on likeability, except for those in the categories “child” and “celebrity” which were not expected to be comparable in liking to average White adults. The faces used to represent the comparison group (non-celebrity White young adults) were different in each IAT, thus there was a total of 50 non-celebrity White young adult faces used.
Each of the five IATs consisted of the following four blocks: (1) 20 trials sorting pictures of the two social groups, (2) 40 trials in which one group was sorted with positive words and the other group was sorted with negative words, (3) 40 trials in which the two social groups were reversed in position from Block 1, and (4) 40 trials in which the groups were paired with the opposite valence from Block 2.3 To ensure comparability between participants, all participants received compatible blocks first and incompatible blocks second (i.e., the order was not counterbalanced in line with considerations outlined by Egloff & Schmukle, 2002; Gawronski, 2002; Hofmann, Gschwendner, Wiers, Friese, & Schmitt, 2008)4. For all of the IATs, the compatible blocks were defined as those in which the comparison group is paired with good words, i.e., White + good for the three ethnic/racial IAT, Adult + good for the Child-Adult IAT, and Regular Person + good for the Celebrity-Regular Person IAT.
An IAT D-score following recommendations by Greenwald, Nosek, & Banaji (2003) was calculated for each person on each IAT (i.e., the difference between the incompatible and the compatible blocks divided by their pooled standard deviation for each IAT for each participant). Higher scores on this measure reflect more negative implicit attitudes toward each target social group (i.e., Blacks, Latinos, Asians, children, or celebrities) relative to the comparison group.
IAT Explanation Manipulation and Training
Participants went through a thorough training procedure, during which they both learned about the meaning of implicit as opposed to explicit attitudes, and experienced completing IATs (on targets other than human social groups). Several steps were taken to manipulate beliefs that the IAT reveals either true attitudes or cultural associations. In the true attitudes condition, participants were first given a half-page introduction in which the IAT was described as revealing a person’s “true underlying attitude” that can sometimes differ from what people “think of themselves.” Participants were next given more specific information about the IAT sorting procedures and how implicit attitudes are inferred from those procedures. After each of these explanations, participants were asked to write down what they had just learned, using their own words. All references to IAT results in this section were consistently labeled as “true implicit attitudes.”
Conversely, participants in the cultural associations condition received a description of the IAT as revealing “culturally learned associations” that can differ from “what the person truly believes,” and all references to IAT results were phrased as “culturally-learned associations.” These participants were also asked to write down what they had learned about implicit associations and the IAT, following the description.
After learning that the IAT reveals “true implicit attitudes” or “cultural associations,” all of the participants were given first-hand knowledge of the IAT by completing two practice tests; one comparing Insects vs. Flowers and the second comparing Dogs vs. Cats. The practice IATs had only half the number of trials of the regular IATs to give participants a good sense of the test but not fatigue them unnecessarily. For both of the practice tests the participants were asked to first predict their score, complete the IAT, and indicate again how they thought they had scored. They then received automatized feedback on their actual IAT score.
IAT prediction task
Prediction of one’s performance on an IAT was asked in terms of the perceived “ease” of completing the compatible versus the incompatible sorting tasks. For example, in predicting their performance on the Black-White IAT, participants were shown the faces that would appear in this test with one group appearing above the left side of a 7-point response scale and the other group appearing above the right side of the scale. Participants were encouraged to look at the pictures, “carefully listen to their gut feeling,” and then try to answer the question of which sorting task (e.g., sorting Black with good or sorting White with good) would be easier for them, and how much easier it would be (see Figure 1). This bi-polar scale thus made the comparative nature of the IAT clear and asked the participants to respond accordingly.
Figure 1.
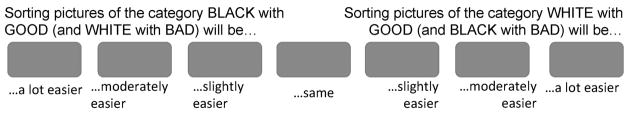
Prediction scale participants used to make their predictions of their IAT score (example of Black-White IAT) in Study 1. Photos used in the actual IATs were depicted above the ends of the scales on the left and right. In Study 2, labels below the buttons were changed (see text).
For the feedback participants received on the practice IATs, the computed D-scores were translated into terms that were similar to the prediction scale: D-scores >.65 produced the feedback that a particular sorting combination had been “A LOT easier” than the other combination, D-scores between .65 to .35 were translated as “MODERATELY easier,” D-scores between .35 and .15 were translated as “SLIGHTLY easier,” and D-scores between .15 and −.15 produced the statement that the two sorting tasks were “the SAME” for the participant. These cut-offs were made according to conventions used on the IAT webpage (www.projectimplicit.com, Nosek, Greenwald, & Banaji, 2006, Personal communication from N. Sriram to I. Blair on July 6, 2009). Participants only received this feedback for the two IATs that were part of the training procedure, but never for the social group IATs.
Explicit Ratings
Participants were asked to indicate their explicit group attitudes using a standard thermometer scale. For each group label, a scale appeared on the computer screen in the shape of a thermometer that ranged from “0 – very coolly” to “100 – very warmly.” Participants were asked to indicate how warmly or coolly they felt toward “Whites/Caucasians,” “Blacks/African Americans,” “Asians/Asian Americans,” “Latinos/Hispanic Americans,” “children,” and “celebrities.”
Manipulation Check
To assess the extent to which participants in each condition had in fact accepted the explanation they were given about the IAT, they were presented with four statements in a randomized order, each accompanied by a seven-point scale ranging from “1 – strongly disagree” to “7 – strongly agree.” The statements were, “The IAT measures my true underlying attitude”, “My IAT results have nothing to do with how I really feel about different groups of people” (reverse-scored), “The IAT measures a culturally learned association that I hold,” and “The IAT cannot say how I’m influenced by my culture” (reverse-scored). The first two and last two items were averaged, respectively (Cronbach’s α attitudes scale = .62, Cronbach’s α associations scale = .47), with higher scores indicating more agreement with the respective explanation.
Procedure
After informed consent was obtained, participants were seated in individual cubicles and completed the tasks in the following order: (1) explicit thermometer ratings, (2) explanation of the IAT (true attitudes vs. cultural associations, randomly assigned), (3) two practice IATs, each with a prediction, a “post-diction”, and computer feedback about the actual result, (4) predictions of IAT scores for all five of the critical IATs in one pre-determined order (Black-White, Asian-White, Latino-White, children-adults, celebrities-regular people), and (5) completion of the five IATs in random order. The experiment concluded with participants repeating explicit thermometer ratings on all of the groups.5 They then answered the manipulation check and demographic questions.
Results
Manipulation check
Before the primary analyses, we examined the manipulation check responses to determine whether participants had accepted the IAT explanation they were assigned. We ran a 2 (condition: true implicit attitudes vs. cultural association condition) by 2 (scale: IAT measures culturally-learned associations vs. IAT measures true implicit attitudes) mixed-model ANOVA with repeated measures on the second factor. The expected interaction of the two factors emerged, F(1, 63) = 31.08, p <.001, ηp2=.33. Participants in the true-attitudes condition agreed more with the idea that the IAT measured their true underlying attitudes (M=5.08, SE=.21), than their culturally learned associations (M=4.40, SE=.19), F(1, 63) = 10.80, p=.002, ηp2=.15. Contrarily, participants in the cultural associations condition agreed more with the idea that the IAT measured culturally learned associations (M=5.06, SE=.18) than their true underlying attitudes (M=4.15, SE=.20), F(1, 63) = 21.45, p<.001, ηp2=.25. Hence, participants believed that the IAT measured what we told them it measured – either their true underlying attitudes, or culturally learned associations that they hold.
IAT scores
Figure 2 depicts the mean IAT D-scores. As expected, on average participants tended to have more positive implicit attitudes towards Whites as compared to Blacks, Latinos, or Asians, all three t(63)’s > 7.4, all p’s < .001, all ηp2’s>.47, but more positive attitudes towards celebrities as opposed to regular people, t(63) = −2.32, p = .02, ηp2=.08, and more positive attitudes towards children as opposed to adults, t(63) = −3.74, p <.001, ηp2=.18. There were no effects of explanation condition on any of these scores, t(63)’s < 1.5, all p’s > .16.
Figure 2.

Study 1: Mean IAT scores by condition. Higher scores mean more positive implicit attitudes towards the comparison group (i.e., regular White adult). Negative scores indicated more positive scores towards the target group (Black, Asian, Latino, celebrity, or child). Error bars are calculated from mean square errors from a 5 (target) x 2 (condition) ANOVA on IAT scores.
Accuracy of predictions
In order to examine whether participants could accurately predict the patter of their five IAT results, we estimated a multilevel model6 in which each participant’s five IAT scores were modeled as a function of that person’s five IAT predictions at the first level. Because we wanted the sizes of the resulting random slopes to be indicative of participants’ accuracy in predicting the patterns of their results, we individually standardized IAT scores and predictions for each participant.7 Thus, the slopes from this analysis are akin to a correlation coefficient for each participant that estimates the degree to which his or her IAT scores are associated with his or her predictions. At level two, we looked at the average size of these random slopes (the fixed effect), and also modeled them as a function of the explanation manipulation (between-subjects). The results from this analysis are given in the left column of Table 1.8 The top part of Table 1 gives the tests of the fixed effects and the bottom shows the variances of the random error components of the model.
Table 1.
Study 1: IAT D-scores regressed on IAT score predictions (left) and explicit thermometer ratings (right)
| Parameters (DV: IAT D-scores) | Prediction model estimates | Imp.-exp. model estimates |
|---|---|---|
| Fixed effects | ||
| IAT score predictions | .53*** | |
| Predictions × condition | .09† | |
| Explicit therm. ratings | .01 | |
|
| ||
| Random effect variances | ||
| IAT score predictions | .041 | |
| Explicit therm. ratings | .077 | |
| Residuals | .550*** | .741*** |
|
| ||
| Goodness of fit | ||
| −2 log likelihood | 750.43 | 850.39 |
p < .11
p<.001
All level-1 variables are standardized for each individual participant before they are entered in the analysis. Accordingly the intercept in this model would be 0 and is not included in the model. Similarly, the main effect of condition on these centered IAT scores is not included either. “Condition” represents a level-2 condition assignment. It is coded “−1” for the “cultural associations” condition, and “1” for the “true attitudes” condition.
As Table 1 shows, participants’ predictions of their IAT results corresponded significantly with their actual IAT scores, b= .53, t(61) =9.80, p <.001. As previously discussed, the slope from this standardized model can be interpreted as the average within-subject correlation between predictions and actual IAT scores. Looking at the distribution of these individual correlations revealed that it was negatively skewed, making the median within-participant correlation between predictions and IAT scores higher than the average, r = .62. The random components of this model (see lower half of Table 1) furthermore indicated that random variation in these slopes across participants was not significant.
As Table 1 also indicates, the manipulation of IAT explanation only minimally affected participants’ prediction accuracy (predictions by condition interaction). Contrary to a threat hypothesis, participants’ predictions were actually non-significantly more accurate in the “true-attitudes” condition than in the “associations” condition, b= .09, t(60) =1.64, p =.11.
The lack of a condition effect made us wonder whether or not the manipulation possibly only affected the more socially sensitive racial/ethnic IATs. Additionally, we were interested in whether participants’ accuracy stemmed mainly from predicting the difference between the minority IATs (which indicated a pro-White bias), and the other two IATs (which indicated biases against the White comparison group, see Figure 2). Results of an analysis looking only at predictions of ethnic/racial IATs did not support either of these speculations. First, there was still evidence that participants could predict their pattern of results for only these three (mostly pro-White) IATs, even in this underpowered analysis of only three data points per participant, b=.32, t(38.0) = 2.80, p=.008. Additionally, there was still no evidence that thinking about the IAT as revealing “true attitudes” made participants less accurate in their predictions of these results. As before, the direction of the (non-significant) slope indicated more accuracy in the “true attitudes” as opposed to the “cultural associations” condition, b=.15, t(38) = 1.29, p=.21.
Relations with explicit attitudes
We conducted an additional analysis to determine the relation between participants’ explicit thermometer ratings and their IAT scores. This time we modeled level-1 IAT scores as a function of participants’ explicit attitudes (their thermometer ratings) measured prior to the IATs.9 The results of this analysis are reported in the right column of Table 1. They show that participants’ explicit thermometer ratings were unrelated to their IAT scores across the five IATs, b = .01, t(64) =.10, p =.92.
Discussion
The purpose of Study 1 was to investigate people’s ability to predict their IAT results. With regard to five social-group comparisons, we found that participants predicted their results with a fair amount of accuracy. Participants were furthermore as accurate (even a little more so) in their predictions when they were led to believe that the IAT revealed their true attitudes, as they were when they were led to believe that the IAT revealed culturally learned associations. At the same time, results from the manipulation check showed that participants accepted the explanations they were given. Taken together, the pattern of results suggests that people can predict their performance on implicit attitude tests even as they face the possibly unpleasant revelation that these “true attitudes” differ from their explicit attitudes.
Indeed, participants in this study reported explicit attitudes that were distinct from their IAT results, even as they demonstrated that they could accurately predict the latter. This last point supports the argument that lack of correspondence between implicit and explicit measures of attitudes says little about how aware people are of their implicit reactions. Studies concerned with the correspondence between implicit and explicit measures of attitudes provide only circumstantial evidence on this issue (Gschwendner et al., 2006; Hofmann et al., 2005a, 2005b; Smith & Nosek, 2011; Ranganath et al., 2008).
There are additional questions that remain to be answered. Specifically, the prediction task in Study 1 asked participants to make an operational prediction (i.e., “Which of two blocks in this task will be easier to complete?” See Figure 1). Participants might have some sort of procedural awareness about their response impulses, but not about their spontaneous attitudinal reactions towards the groups. Since it is the latter construct (attitudes) that we intended to address, Study 2 was conducted to replicate the results with a more conceptual prediction measure of participants’ implicit attitudes towards the groups.
Study 2
Method
Participants and Design
Seasonal availability allowed us to sample more participants in Study 2 to further investigate the weak condition effects found in Study 1. Data were only analyzed after the full sample reported here was collected. Ninety-three undergraduate students participated in the study for partial course credit. Three participants were excluded from data analysis: One participant made too-fast responses (<300 ms) on 19% of the IAT trials (Greenwald et al., 2003), and two participants were missing too much data to be included. The remaining 90 participants were 64% women, and 81% identified as White. The other ethnicities were: 5 “other” or mixed-races, 5 Arab/Middle-Eastern, 4 Asian, 2 Latino and 1 Black. Age range was 18–25 years, with a median age of 19.
Study 2 used the same design as Study 1. That is, the continuous relationship between predictions of IAT results and actual IAT scores was calculated for each participant at level 1, and the effect of the IAT explanation condition on this relationship was assessed across participants at level 2.
Materials and procedure
The materials and the procedure were exactly the same as those used in Study 1 with two exceptions. First and most significantly, we modified the measure that the participants used to predict their IAT results. As before, participants saw the pictures they would be sorting in the IATs accompanied by instructions encouraging them to look at the pictures and listen to their gut reactions. However, instead of focusing on which of two IAT blocks would be easier to complete, the prediction measure asked participants directly about their “true implicit attitudes” or their “culturally learned associations”, depending on IAT-explanation condition. Thus, the final prediction scale read, e.g., “I predict that the IAT comparing my reactions to BLACK vs. WHITE will show that my true implicit attitude [culturally learned association] is…” (1) “a lot more positive towards BLACK”, (2) “moderately more positive towards BLACK”, (3) “slightly more positive towards BLACK”, (4) “same”, and then the opposite labels on the second half of the scale (e.g., “slightly more positive towards WHITE,” etc.). Except for these changes in the labels, the prediction scale still looked similar to the one depicted in Figure 1.
The second modification was made to reinforce the IAT explanation condition manipulation, given its weak effect in Study 1. Following score feedback on the two practice IATs (Insect-Flower and Dog-Cat), participants were asked to reflect what their results said about their “true attitudes” (or their “culturally learned associations,”) in an additional writing task. As in Study 1, the effectiveness of the manipulations was assessed by four manipulation check questions in the end of the study (Cronbach’s α attitudes scale = .68, Cronbach’s α associations scale = .48).
Results
Manipulation check
The manipulation check scales were analyzed as a function of IAT explanation condition. The expected interaction between scale and condition emerged again, F(1, 88) =11.14, p = .001, ηp2=.11. Participants in the true-attitudes condition agreed significantly more that the IAT measured their underlying true attitudes (M=4.54, SE=.21) than culturally learned associations (M=4.04, SE=.18), F(1, 88) =4.51, p =.036, ηp2=.05. Conversely, participants in the cultural associations condition agreed more that the IAT measured culturally learned associations (M=4.51, SE=.18) than true underlying attitudes (M=3.90, SE=.21), F(1, 88) =6.74, p =.011, ηp2=.07.
Accuracy of predictions
As in Study 1, a multi-level model was estimated in which each participant’s five IAT scores were modeled as a function of that person’s five IAT predictions (both individually standardized) at the first level, within-subjects, and then the random slopes from this level were modeled at level 2 as a function of the IAT explanation condition, between-subjects. The results are summarized in the left column of Table 2. We again found a significant relationship between the IAT predictions and actual scores, b = .55, t(86) =12.02, p <.001. The distribution of the correlation coefficients was again negatively skewed so that the median correlation was even higher, r = .72.
Table 2.
Study 2: IAT D-scores regressed on IAT score predictions and explicit thermometer ratings, simple relationships and simultaneous regressions.
| Parameters (DV: IAT D-scores) | Prediction model estimates | Imp.-exp. model estimates | Sim. regr. model estimates |
|---|---|---|---|
| Fixed effects | |||
| IAT score predictions | .55*** | .59*** | |
| Predictions × condition | −.00 | −.04 | |
| Explicit therm. ratings | −.20*** | .06 | |
| Therm. × condition | −.09 | ||
|
| |||
| Random effect variances | |||
| IAT score predictions | .048 | .040 | |
| Explicit therm. ratings | .028 | .079* | |
| Residuals | .533*** | .747*** | .475*** |
|
| |||
| Goodness of fit | |||
| −2 log likelihood | 1027.56 | 1161.51 | 1023.31 |
p<.05
p<.001
All level-1 variables and the dependent IAT scores are standardized for each individual participant before they are entered in the analysis. Condition is coded “−1” for the “cultural associations” condition, and “1” for the “true attitudes” condition.
An examination at level 2 of the model again showed no evidence that the explanation manipulation had any effect on the accuracy of participants’ predictions, b = .00, t(86) =−.09, p =.93. As in Study 1, we also looked at these relationships for only the three ethnic/racial IAT predictions. Prediction accuracy for these three IATs was comparable to what we found in Study 1, b=.33, t(45)=3.46, p=.001, and there was not a significant difference by explanation condition, b=.17, t(45) = 1.75, p=.09. As in Study 1, the direction of this slope was opposite to a threat hypothesis, showing a tendency for participants to be more accurate in predicting the pattern of their racial/ethnic minority IAT scores when they thought of them as revealing “true attitudes” than when they thought of them as revealing “culturally learned associations.”
Explicit attitude relations
The next multi-level model tested whether participants’ explicit thermometer ratings were related to their IAT scores (see the middle column of Table 2). This analysis showed a significant relationship, b = −.20, t(89) =−4.12, p < .001.10 This relationship was largely in line with previous research on implicit-explicit relationships (Blair, 2001; Hofmann et al., 2005a, 2005b), and as such weaker than the relationship between IAT score predictions and IAT scores (b=.55 opposed to .20, see Table 2). Additionally, the relationship between thermometer ratings and IAT scores disappeared once participants’ IAT predictions were added to the model as a covariate, b = .06, t(104.27) =1.09, p =.27 (see rightmost column in Table 2).
Discussion
Study 2 replicated the results of Study 1 with a more conceptual prediction task. Instead of predicting which of two blocks would be easier to complete in an IAT, Study 2 asked participants to predict their implicit attitudes in terms of positivity for one group over another. Participants were just as accurate at making this prediction as they were in Study 1. The relationship between implicit and explicit attitude measures again followed a different pattern. Although statistically significant in this study, this relationship was a) substantially weaker than the relationship between implicit attitudes and their predictions, and b) could be entirely explained through participants’ predictions of their implicit attitudes. We believe this to be consistent with the APE model: Participants are generally able to notice their implicit reactions, but differ in how much validity they grant such reactions and the extent to which other propositions carry more weight in explicit attitude responses, resulting in an average implicit-explicit relationship that is low, as found in previous research (Blair, 2001; Hofmann et al., 2005a, 2005b).
Results so far are consistent with the hypothesis that participants can accurately predict their IAT results. However, looking at the groups that participants were asked to evaluate, another possible explanation is that participants simply predicted the attitudes that “make the most sense” for people in the cultural context. That is, most contemporary Americans would probably predict that the average American would have somewhat more negative associations with ethnic minorities as opposed to Whites, but somewhat more positive associations with children as opposed to adults, and with celebrities as opposed to regular people. The presumed accuracy in their predictions could thus be interpreted as showing that people have good naïve theories about social norms rather than showing unique insight into their own implicit attitudes (F. Strack, personal communication, July 2011).
We addressed this alternative explanation in two ways. First, as reported earlier for both Studies 1 and 2, we examined participants’ predictions for only the three minority IATs. As shown in Figure 2, average biases were similar across these three minority groups, which would suggest that “good guesses” (no variance across groups) would show no relation with actual scores. This was not what we found, suggesting that participants showed insight into their own unique responses.
Second, we decided to investigate whether participants’ predictions would uniquely describe their own response pattern, compared to the predictions made by another person. Using the data from Study 211, we randomly paired participants within a condition, one labeled “A” and the other “B”, and then examined the accuracy (variance accounted for in IAT scores) of each participant’s predictions compared to the predictions of the random other participant. Table 3 shows the results when participant A’s IAT scores are regressed onto both participant A’s and participant B’s predictions (left columns), and when participant B’s IAT scores are regressed onto both A’s and B’s predictions (right columns). There was a significant zero-order relationship between IAT scores and the other person’s predictions: A on B: b = .36, t(86) =7.57, p <.001, B on A: b = .34, t(86) =6.53, p <.001. However this relationship was substantially lower than the relationship between participants’ predictions and their own IAT scores (b = .55, t(86) =12.02, p <.001), as confirmed by two paired-sample t-tests, participant A’s IAT score: t(89)=3.18, p = .002, ηp2=.10, participant B’s IAT score: t(89) = 3.49, p=.001, ηp2=.12. Furthermore, the relationships between IAT scores and the other person’s predictions dropped even further when own predictions were included in the models, A on B: b = .18, t(93.87) =3.68, p <.001, B on A: b = .17, t(95.97) =3.61, p <.001. Participants’ own predictions for themselves furthermore continued to predict a comparable amount of variance, even with the predictions of the random other participants in the model, participant A’s own prediction accuracy: b=.50, t(96.60) =10.25, p<.001, participant B’s own prediction accuracy: b=.48, t(94.96) =9.70, p<.001.12
Table 3.
Study 2: Random paring of predictions and IAT D-scores between two participants (A and B).
| Parameters | DV: Participant A’s IAT D-score | DV: Participant B’s IAT D-score | ||
|---|---|---|---|---|
| Simple model estimates | Sim. reg. model estimates | Simple model estimates | Sim.rReg. model estimates | |
| Fixed effects | ||||
| Participant A’s IAT score pre-dictions | .50*** | .34*** | .17*** | |
| Participant B’s IAT score pre-dictions | .36*** | .18*** | .48*** | |
| A’s predictions × Condition | −.00 | −.08 | −.02 | |
| B’s predictions × condition | −.01 | .07 | .02 | |
|
| ||||
| Random effect variances | ||||
| Participant A’s IAT score pre-dictions | .057 | .080* | .043 | |
| Participant B’s IAT score pre-dictions | .026 | .054 | .055 | |
| Residuals | .683*** | .466*** | .646*** | .481*** |
|
| ||||
| Goodness of fit | ||||
| −2 log likelihood | 1124.55 | 1010.99 | 1121.67 | 1018.27 |
p<.05
p<.001
All level-1 variables, including the dependent IAT scores, are standardized for each individual participant before they are entered in the analysis. Pairing of participants A and B are entirely random, but fixed within condition. Different random pairings would lead to slightly different results.
In sum then, there did seem to be a normative pattern of IAT responses, and thus participants’ predictions explained variance in the pattern of their co-participants’ IAT scores. Nevertheless, participants’ predictions for their own scores explained variance over and above this general pattern. That is, deviations of participants’ individual IAT patterns from the general pattern could be largely explained by participants’ own unique predictions for their scores. Study 3 was conducted to address this issue more directly.
Study 3
Study 3 had two aims. One was to further investigate the difference between unique insight and predictions based on normative assumptions. In addition to predicting their own IAT results, participants were asked to predict how they thought a “typical or average CU student” in this study would respond. If participants have unique access into their own implicit responses, then self predictions should explain variance in IAT scores over and above predictions made for the average student. This is a particularly conservative test of unique insight, because participants are likely to egocentrically base their predictions for the average student on their own intuitions (Krueger, 1998; Ross, Greene, & House, 1977).
The second aim of Study 3 was to remedy methodological ambiguities in Studies 1 and 2. First, we provided participants with a continuous sliding scale for the prediction of their IAT results, rather than the 7-point scale used previously. Second, we added ratings of “adults” and “regular people” to the explicit thermometer measures. These allowed us to compute difference scores for children as opposed to adults and celebrities as opposed to regular people more analogous to the comparative scores obtained from the IATs (rather than contrasting all scores simply from the normative comparison category “White”). The purpose of both of these changes was simply to get more accurate results and rule out the possibility that certain results (e.g., low implicit-explicit correlations) were methodological artifacts; we did not expect any meaningful differences in the pattern of results.
Method
Participants and Design
One hundred and twenty undergraduate students completed the study for course credit.13 One participant failed to understand the IAT instructions and did not complete the study. Of the final 119 participants, 77 (65%) were women, and 84% identified as White, with the remaining 19 participants identifying as Black (5), Latino (4), Asian (6), or mixed-ethnicities (4). Ages ranged from 18–32 years, with a median age of 18.
The study again consisted of a multi-level design. On level 1 we estimated a regression for each participant to analyze the continuous unique relationships between actual IAT scores as the criterion and, simultaneously, both IAT score predictions for self and IAT score predictions for the average student as predictors. On level 2, across participants, we estimated these relationships as a function of prediction order (self first vs. other first, between-subjects).
Materials
Materials were almost identical to the materials used in Study 2, with the exception of the following changes.
Predictions for the average participant
A second prediction task was added to this study. Specifically, participants were encouraged to imagine “a typical or average student” from their university participating in this study and to predict how this student would respond to the same questions the participants were answering for themselves. The participants were further told that their predictions for another student would be tested for accuracy. To reinforce this perspective-taking task participants were asked to provide predictions for the average student on all explicit thermometer ratings as well as IAT scores.
IAT training
The IAT training procedure was similar to that used in the “true implicit attitudes” condition of Study 2, except that all instances of the word “true” were omitted, and participants were simply asked to predict their “implicit attitudes” (instead of their “true implicit attitudes”). In line with this change, implicit attitudes were described as “the underlying attitude that gets triggered spontaneously and that might not be consciously known,” and explicit attitudes were now described as “what you like once you’ve had time to think and reflect about it.”
IAT score prediction
The IAT prediction task was similar to the one used in Study 2 in the true-attitudes condition, except the word “true” was omitted, and participants saw a sliding scale instead of seven buttons. This scale had seven equidistant cut-off lines placed along its length that were labeled the same as the buttons in Study 2 (e.g., “6 - moderately more positive towards WHITE”). The computer registered .1-increments between a choice of 1.0 and a choice of 7.0 (both anchors indicating “a lot more positive towards group X”). Participants thus had 61 options to use to predict their own, and the average student’s, attitudes. Participants either predicted all of their own attitudes first in one block and then all attitudes for the average participant, or vice versa. In contrast to Studies 1 and 2, the order of the target attitudes that participants predicted were individually randomized for each participant within each block (i.e., one random order for IAT self predictions, and another random order for IAT other predictions).
IAT training feedback
Participants received more precise feedback on their flower-insect and dog-cat training IATs (as before, they did not receive feedback on the social-group IATs). Their D-scores (Greenwald et al., 2003) were converted into a numerical value between 1 and 7, which they saw in addition to the sentence describing their bias. Thus, a participant could see a sentence, such as, for instance, “your IAT score indicates that you have moderately more positive attitudes towards CAT as opposed to DOG. On the 7-point scale you used, this corresponds to a value of 5.2”).14
Additional explicit thermometer ratings
Participants were asked to rate eight groups on the thermometer scale (0–100), once to indicate their own feelings and once to estimate the feelings of an average participant. In addition to the groups rated in the previous two studies (Whites/Caucasians, Blacks/African Americans, Asians/Asian Americans, Latinos/Hispanic Americans, children, and celebrities), participants also rated “adults” and “regular people (non-celebrities)” in a constraint-randomized order to avoid confusion. That is, participants rated the groups in three blocks that appeared in random order for each participant (1. ethnic groups, in a different random order for each participant 2. adults then children, and 3. celebrities then regular people).
Procedure
All participants began the experiment with an announcement that this experiment was concerned with their ability to predict their own scores on a computerized test, as well as to predict the response of the average student from their university participating in this study. They were encouraged to imagine such an average student, but not to think of a specific person they knew. Participants were then randomly assigned to a “self-first” or “other-first” condition in completing both the explicit attitudes measures and the IAT predictions. The order of events was, (1) explicit thermometer ratings for self and other, with either self first or other first, (2) the IAT training procedure described above, (3) predictions of self and other scores on the five social-group IATs, in the same order as the thermometer ratings (self first or other first), (4) completion of the IATs, and (5) another round of explicit thermometer ratings, this time only for self.15 The experiment concluded with a demographic questionnaire.
Results
Accuracy
We ran the same multi-level analysis conducted in Studies 1 and 2 on the data of Study 3, modeling the relationship between IAT scores and IAT predictions on level 1, and tested for order effects on level 2. Results are depicted in the left column of Table 4. Participants again predicted their IAT results with considerable accuracy, b = .59, t(117) =16.26, p <.001. The median correlation per participant of this skewed distribution was r = .72. The order in which participants completed the measures (self-first vs. other-first) did not influence accuracy, t <1.6, n.s..
Table 4.
Study 3: IAT D-scores regressed onto a participant’s prediction for their own score (left), the same participant’s prediction for the average participant and their own score simultaneously (2nd column), IAT scores regressed onto explicit thermometer ratings (3rd column), and both self-predictions and explicit ratings simultaneously (right).
| Parameters (DV: IAT D-scores) | Prediction model estimates | Self-vs-aver. model estimates | Imp.-exp. model estimates | Sim. reg. model estimates |
|---|---|---|---|---|
| Fixed effects | ||||
| IAT score predictions self | .59*** | .34*** | .58*** | |
| self predictions × order | −.02 | −.04 | .07 | |
| IAT score predictions other | .34*** | |||
| other predictions × order | −.00 | |||
| Explicit therm. ratings | .27*** | .03 | ||
| Exp. Therm. rating × order | .07 | .07 | ||
|
| ||||
| Random effect variances | ||||
| IAT score predictions self | .028 | .009 | .019 | |
| IAT score predictions other | .033 | |||
| Explicit therm. ratings | .111** | .077** | ||
| Residuals | .505*** | .452*** | .655*** | .451*** |
|
| ||||
| Goodness of fit | ||||
| −2 log likelihood | 1313.49 | 1268.38 | 1501.44 | 1306.61 |
p<.01
p<.001
All level-1 variables are standardized for each individual participant before they are entered in the analysis. “Order” represents a level-2 (between-subjects) condition assignment, one half predicted their own scores first (assigned code −1), another half predicted the score of the average participant first (coded 1).
Predictions for the average participant
Mean pattern
As expected, participants predicted very similar patterns of responses for the average participant as they predicted for themselves. The mean within-subject correlation was r= .73 (see Figure 3). The distribution of these correlations was highly skewed and showed a median of r=.86.16 To examine mean differences in self versus other predictions, we conducted a 2(prediction for self vs. prediction for other) by 5(social groups) by 2(order) mixed-model analysis with repeated measures on the first two factors. The principal effect of interest was an interaction of self vs. other by groups, F(4, 468)=28.63, p<.001, ηp2=.20. Simple effect contrasts showed that participants predicted that the average participant would show more bias than they themselves would show in favor of Whites as opposed to Blacks, F(1, 117)=25.25, p<.001, ηp2=.18, Asians, F(1, 117)=10.05, p=.002, ηp2=.08, and Latinos, F(1, 117)=24.96, p<.001, ηp2=.18; and more bias than they would show in favor of celebrities over regular people, F(1, 117)=44.86, p<.001, ηp2=.28, but less bias than they would show in favor of children over adults, F(1, 117)=4.07, p=.046, ηp2=.03.
Figure 3.

Study 3: Mean predictions of participants’ own IAT score and predictions for IAT scores of the average participant participating in the same study. Scales range from 1–7 with scores above 4 indicating more bias in favor of the comparison group (White, regular, or adult), and score below 4 indicating bias in favor of the target group (Black, Asian, Latino, celebrity, or child). All pairwise differences between predictions for self and predictions for the average participant are significant (see text). Error bars are calculated from mean square errors from a 2 (self vs. other) x 5 (targets) x 2 (self first vs. other first) ANOVA.
Accuracy of IAT predictions for self vs. predictions for other
In order to see whether participants had insight into their own implicit responses over and above the pattern they predicted for the average participant, we regressed participants’ IAT scores simultaneously on their predictions for themselves and their predictions for the average participant on level 1 (within-subjects), and looked at how these relationships were moderated by task order on level 2 (between-subjects). Results are shown in the second column of Table 4. Participants’ predictions for the average participant were significantly related to their IAT scores, b = .34, t(266.18) = 6.70, p <.001. However, their predictions for themselves explained IAT variance over and above this relationship, b = .34, t(241.72) = 7.10, p <.001, suggesting unique insight into their own pattern of implicit responses. None of these relationships were moderated by task order, all |t|’s <= 1.
Explicit ratings
For better comparison to IAT scores, each explicit attitude reported for the self was computed as the difference between two thermometer ratings (White minus each of the three ethnic groups, adult minus child, and regular person minus celebrity), and these were used as predictors of IAT scores. Results are summarized in the two right-most columns of Table 4. Participants’ thermometer ratings were moderately correlated with their IAT scores, b = .27, t(118) = 5.61, p <.001. However, this relationship disappeared when participants’ IAT predictions (for self) were included in the model, b = .03, t(136.42) = .59, p =.56. The random components in this model indicated that these implicit-explicit relationships were highly variable across participants. The highly accurate implicit attitude predictions, on the other hand, showed non-significant random variance across participants, as in the previous studies.
Discussion
Study 3 showed that participants have unique insight into their own implicit responses, over and above normative assumptions. Specifically, the predictions participants made for themselves explained variance in actual IAT scores over and above the predictions they made for an average student participating in the same study. Despite making the explicit attitude scores more comparable to IAT scores, the relationship between implicit and explicit attitudes followed similar patterns as in the previous studies.
Study 4
The purpose of Study 4 was to examine the necessity of the IAT training procedure used in the previous 3 studies. That is, participants in our prior studies were given extensive explanation about the meaning of implicit attitudes and the IAT as a measure of such attitudes, including direct experience with two practice IATs. We were curious to see how much explanation and experience with implicit-attitude measurement was in fact necessary for participants to make accurate predictions. An exploration of this issue would also be informative about people’s general insight into the difference between their spontaneous reactions and deliberate attitudes.
To test this question, we manipulated both the amount of explanation and experience with the IAT in a 2 (minimal explanation vs. full explanation) by 2 (no experience vs. full experience) between-subjects factorial design.
Method
Participants
One hundred and fifty-seven participants completed this study in exchange for partial course credit. One participant was excluded for responding faster than 300 milliseconds on 55% of the IAT trials (Greenwald et al., 2003). Due to computer errors, demographic information was available for only 154 of the remaining 156 participants. Of those, 62% were female, and 77% self-identified as White. The remaining 23% self-identified as Black (2), Latino (7), Asian (16), Native American (1), Middle-Eastern/Arab (3) or as multi-ethnic (7). Ages ranged from 18–32 years, with a median age of 19.
Design
Using a multi-level design, the continuous relationship between participants’ IAT score predictions and their actual IAT scores were modeled for each participant separately at level 1. At level 2 we modeled this relationship as a function of a 2 (minimal explanation vs. full explanation) by 2 (no experience vs. full experience) between-subjects factorial design.
Materials and Procedure
The procedure and design of Study 4 are graphically depicted in Table 5. After completing explicit thermometer ratings, as in Study 3, participants were randomly assigned to one of four conditions.
Table 5.
Design and procedure Study 4.
| Procedure | Condition | Full explanation | Minimal explanation | ||
|---|---|---|---|---|---|
| Full experience | No experience | Full experience | No experience | ||
| I) Explicit thermometer ratings | !! | ||||
| II) IAT training procedure | Step 1: Explanations and writing tasks: Implicit & explicit attitudes; IAT procedure. | !! | -- Instead: Filler writing task and prediction prompt |
||
| Step 2: IAT experience and feedback with insect-flower IAT & dog-cat IAT | !! | -- | !! | -- | |
| Step 3: Explanatory writing task: Reflect on your IAT results | !! On real results |
!! On hypothetical results |
-- | -- | |
| III) 5 social group IATs | Score predictions | !! With reference to “gut reactions” |
!! Without reference to “gut reactions” |
||
| Actual test completions | !! | ||||
| IV) Explicit thermometer ratings | !! | ||||
| V) Demographics | !! | ||||
As can be seen in Table 5, the IAT training procedure used in the previous studies can be organized into 3 steps: (1) two explanatory writing tasks on the meaning and measurement of implicit attitudes; (2) experience with predicting, completing, and receiving feedback on an insect-flower and a dog-cat IAT; and (3) reflecting on the meaning of the results of the two training IATs. Experience with the IAT (full vs. no) and explanation of the difference between implicit and explicit attitudes (full vs. minimal) was manipulated by systematically eliminating steps in this training procedure.
Specifically, as can be seen in Table 5, participants in the full-explanation/full-experience condition completed all steps as in the previous studies, using the materials from Study 3. Participants in the full-explanation/no-experience condition did not complete the two practice IATs (step 2). Accordingly, step 3 for these participants involved writing a hypothetical interpretation about what their results would mean if they were to complete an insect-flower and a dog-cat IAT.
Participants in the minimal-explanation/full-experience condition completed only step 2 of the training procedure, but did not complete steps 1 and 3. Instead of step 1, they completed a filler task that had the same title, “Do you know yourself?”, but asked participants to describe in detail what they had done on the previous afternoon. Participants in this condition then continued to step 2 and completed the insect-flower and dog-cat IATs and received feedback on their actual results. These participants’ predictions were thus informed by experience with the IAT, but not by theoretical reflection about its meaning.
Lastly, participants in the minimal-explanation/no-experience condition did not complete any of the three training steps. After completing the thermometer ratings, participants in this condition only completed the filler writing task.
After the training procedure (or no training), participants in all conditions predicted their IAT scores for the five social-group IATs in an order randomized for each participant, and then completed the actual IATs, also in individually randomized orders.
In order to explain the prediction task to participants in both minimal-explanation conditions, they were given the following prompt before making their predictions, modeled after the IAT webpage’s introductory portal (www.projectimplicit.com, Nosek et al., 2006):
“This study uses a method that examines some of the divergences that may occur between people’s implicit and their explicit attitudes. This new method is called the Implicit Association Test, or IAT for short. In a minute you will complete some IATs and we are interested in whether you can predict your performance on each one. Past research shows that people are actually pretty good at predicting their scores, even if they aren’t entirely sure. So even if the predictions seem difficult, just try your best to be as accurate as possible.”
The predictions themselves for the minimal-explanation conditions were also slightly modified in that they did not encourage participants to listen to their gut reactions. Instead, the screen where participants were asked to make their predictions showed the same pictures that would be used in the IATs and asked participants “if you took an IAT to measure your implicit attitude, what would it show?” The prediction scale itself (taken from Study 3) was the same for participants in all conditions. After completing the IATs, all participants repeated the explicit thermometer ratings, and were asked to provide demographic information.
Results
Effects of condition assignments on accuracy
Participants’ IAT scores, standardized for each participant, were regressed onto their within-subject standardized predictions, for each participant separately on level 1. The resulting slopes (reflecting accuracy of predictions) were modeled as a function of training condition on level 2. Specifically, we analyzed the effects of two binary contrast-coded between-subjects predictors on level 2, one for full explanation vs. minimal explanation (coded −1 and 1, respectively), and one for full experience vs. no experience (also coded −1 and 1, respectively), as well as their interaction (i.e., their product). Results are depicted in Table 6.
Table 6.
Study 4: IAT D-scores regressed onto IAT score predictions and explicit thermometer ratings.
| Parameters (DV: IAT D-scores) | Prediction model estimates | Imp.-exp. model estimates | Sim. Reg. model estimates |
|---|---|---|---|
| Fixed effects | |||
| IAT score predictions | .54*** | .55*** | |
| Predictions × Explanation | −.02 | −.02 | |
| Predictions × Experience | .00 | −.01 | |
| Predictions × Explanation × Experience | .03 | .01 | |
| Explicit therm. ratings | .24*** | −.02 | |
| Therm. × Explanation | −.03 | −.02 | |
| Therm. × Experience | .05 | .03 | |
| Therm. × Explanation × Experience | .04 | .04 | |
|
| |||
| Random effect variances | |||
| IAT score predictions | .000 | .000 | |
| Explicit therm. ratings | .087** | .058* | |
| Residuals | .574*** | .686*** | .530*** |
|
| |||
| Goodness of fit | |||
| −2 log likelihood | 1297.22 | 1997.58 | 1805.64 |
p<.05
p<.01
p<.001
All level-1 variables are standardized for each individual participant before they are entered in the analysis. “Explanation”, “Experience”, and “Explanation × Experience” refer to Level-2 (between-subject) predictors that are contrast-coded “−1” for no or minimal, and “1” for full explanation or experience, respectively. The interaction term is the product of these two codes.
As in the previous studies, participants predicted their IAT results with considerable accuracy across conditions, b=.54, t(776.0) = 17.61, p < .001. The median within-participant correlation in this study was r=.66. Surprisingly, the systematic impoverishment of the training did not affect accuracy. Neither explanation, b=−.02, t(776) =−.64, n.s., nor experience, b =.00, t(776) =.08, n.s, nor their interaction, b =.00, t(776) =.08, n.s, had any effects on the accuracy of IAT predictions. The average within-subjects correlations per condition are graphed in Figure 4. As can be seen, results went in unexpected directions. Although none of these differences were significant, participants in the minimal-explanation/no-experience condition tended to be the most accurate in predicting their results.
Figure 4.

Study 4: Average within-participant correlation between IAT score predictions and actual IAT scores by condition. Error bars are calculated from mean square errors from a 2 (explanation) x 2 (experience) ANOVA on participants’ individual correlations calculated separately in a first step.
Relationship of IAT scores with explicit ratings
As in Study 3, the thermometer ratings based on group comparisons showed a significant, if moderate, within-participant relationship with IAT scores, b=.24, t(154.00) = 5.92, p < .001 (see middle and right column of Table 6). However, once controlling for participants’ IAT predictions, these relationships dropped to nil, b=−.02, t(206.60) = −.48, p =.63. The degree to which the predictions explained the relationships between thermometer ratings and IAT scores was constant across the four conditions (all |t|’s < 1, n.s.). Also consistent with Study 3, the random components indicated that there was no meaningful variation in participants’ predictions of their IAT results (non-significant random error component for prediction), but a significant random error component for the thermometer ratings-IAT relationships.
Relationship between explicit thermometer ratings and IAT predictions
The lack of condition effects on accuracy is puzzling in many ways. In concert with the repeated finding that participants’ explicit thermometer ratings were only moderately related to their IAT scores, this finding poses the question of how participants differentiated between making an explicit thermometer rating and (explicitly) predicting an IAT score. In order to further investigate this process, we ran a series of additional analyses on the relationship between the thermometer ratings and IAT predictions. The main questions of interest were (1) the extent to which participants’ predictions were related to their initial explicit attitude ratings; (2) whether variance in participants’ IAT predictions that was not related to their explicit attitude ratings could be explained by their actual IAT results, as the previous findings would indicate; and, (3) whether these effects would be moderated by condition assignments. In other words, did all participants in all conditions deliberately indicate different attitudes when predicting their IAT results than when completing the thermometer ratings? And does the extent to which they indicated different predictions accurately reflect their IAT scores in all conditions?
Results of these analyses are presented in Table 7. As can be seen, there was a significant within-subjects relationship between IAT predictions and thermometer ratings, b=.47, t(151.00)=11.80, p<.001. And, although smaller in size, this relationship held when controlling for participants’ actual IAT scores, b=.37, t(143.08)=10.30, p<.001. Importantly, the simultaneous regression also confirmed that the variance in participants’ predictions that was left unexplained by the thermometer ratings could be explained by participants’ IAT scores to a substantial degree, b=.43, t(149.65)=14.97, p<.001. Crucially, results indicated that none of these effects were moderated by condition, all |t|’s <=1.09. That is, all participants in all conditions deliberately indicated different attitudes when they predicted their IAT results than when they completed the thermometer ratings, even those in the minimal-explanation/no-experience condition. And in all conditions, these differences accurately reflected participants’ actual IAT scores.
Table 7.
Study 4: The effect of explicit thermometer ratings on participants’ implicit-attitude predictions
| Parameters (DV: Score predictions) | Model 1 estimates | Model 2 estimates |
|---|---|---|
| Fixed effects | ||
| Explicit thermometer ratings | .47*** | .37*** |
| Therm. × Explanation | −.01 | .00 |
| Therm. × Experience | .04 | .03 |
| Therm. × Explanation × Experience | −.01 | −.03 |
| IAT D-scores | .43*** | |
| IAT score × Explanation | −.01 | |
| IAT score × Experience | −.03 | |
| IAT score × Explanation × Experience | .02 | |
|
| ||
| Random effect variances | ||
| Explicit thermometer ratings | .122*** | .091*** |
| IAT D-scores | .011 | |
| Residuals | .517*** | .388*** |
|
| ||
| Goodness of fit | ||
| −2 log likelihood | 1815.75 | 1624.92 |
p<.001
All level-1 variables are standardized for each individual participant before they are entered in the analysis. “Explanation”, “Experience”, and “Explanation × Experience” refer to Level-2 (between-subject) predictors that are contrast-coded “−1” for no or minimal, and “1” for full explanation or experience, respectively. The interaction term is the product of these two codes.
Discussion
The purpose of Study 4 was to assess whether people would be able to predict their IAT results even without substantial explanation of the differences between implicit and explicit attitudes, and without experience with the implicit attitude measure. Results indicated that neither of these factors were necessary conditions for making accurate predictions about one’s implicit responses. Participants were as accurate in their predictions when they received minimal explanation and had no immediate experience with the implicit attitude measure, as they were with full training.
Recall that the purpose of the current set of studies was to investigate the question of whether people can be aware of their implicit reactions, even if they consider these reactions invalid for explicit attitudes. Hence, the methods used throughout the studies were designed to estimate awareness by having participants predict their IAT results while obviating the validation process presumed to underlie the reporting of explicit attitudes. The current study shows that, in order to achieve this, it is not necessary to explain the concept of implicit attitudes at length. This raises the question of why participants in the no-explanation/no-experience condition predicted IAT results that were different from the explicit attitudes they had reported just moments earlier? To shed light on this question, it might be helpful to take a deeper look at the differences between the explicit thermometer ratings and the IAT predictions. The four most striking differences are discussed below:
First, as already mentioned, the prediction task stated that we were interested in “divergences” in attitudes. Participants were thus sanctioned to make predictions that diverged from the explicit attitudes they had just reported. Second, we announced, and repeated in every prediction question, that we would compare predictions to actual test outcomes. This announcement could have functioned as a “bogus pipeline” instruction (Jones & Sigall, 1971; Nier, 2005), suggesting that any self-presentational or other distortions made in reporting explicit attitudes would be dysfunctional for these predictions if the “truth” would soon be revealed. Third, predictions about implicit attitude responses were made with reference to pictures of specific faces representing each group. Participants may have felt that their reactions towards the specific exemplars are different from their feelings towards the groups in the abstract. Fourth and last, participants made IAT predictions as group comparisons (“more positive towards group X than towards group Y”), whereas thermometer ratings were made for each group and we computed difference scores afterwards. Previous research suggests that such differences have only a small effect on implicit-explicit correlations (Hofmann et al., 2005a), but participants might bring different considerations to mind when social groups are considered in isolation than conjointly.
In sum, there are several factors that could have contributed to participants’ beliefs that a prediction of their implicit attitude responses should be different from their explicit attitude responses. What remains surprising, however, is that the differences between explicit attitude reports and implicit attitude predictions were in fact in line with participants’ actual IAT scores. That is, what Study 4 shows more overwhelmingly than any of the previous studies, is that people really do have awareness of their implicit attitude responses, and one does not have to dig very deeply to see them. Future research is needed to explain exactly how people construe implicit attitudes in contrast to explicit attitudes, and why so few of the standard self-report attitude measures have captured the former.
An important shortcoming of Study 4 is that we did not ask participants about their pre-study experience with the IAT. Although we verified with instructors that the topic was not covered in the classes from which participants were recruited (General Psychology – the first, introductory psychology class offered in the department), participants could have taken an IAT before entering our study. With the exception of the Black-White IAT, the group IATs we included in our studies are not widely available for people to experience (i.e., they do not appear on the IAT website). Nonetheless it is possible that at least some participants had experience with the IAT more generally, and that remains an important caveat for this study.
Additional Analyses
All analyses reported so far support the main point we wished to make: Participants were able to accurately predict the pattern of their implicit attitude responses, even when they indicated different explicit attitudes towards the same targets. Going beyond this basic issue, our data provided the opportunity to address other questions, two of which are considered here.
Within- vs. between-subjects assessment of accuracy
In all analyses reported thus far, we examined relationships between participants’ IAT predictions and their actual IAT scores within-subjects, across five group comparisons. Given that most research on implicit-explicit attitude correspondence is conducted and analyzed between-subjects, we were curious to see how participants’ IAT predictions would fare looking between-subjects as well. As described in the beginning, this analysis answers a very different question: to what extent do participants’ predictions of their IAT responses correspond to their actual “location” on that attitude continuum vis-a-vis other people? That is, a high between-subjects correlation indicates that the labels participants chose for their implicit attitudes (e.g., “moderately more positive towards children over adults”) accurately describe the degree of personal bias in line with the labels other participants chose for themselves. To see whether or not this was the case, we examined the between-subjects relationships between IAT predictions and actual scores for each group comparison. Results presented in Table 8 for all four studies, collapsing across manipulated conditions.17
Table 8.
Average correlations between IAT D-scores, and both IAT score predictions and Thermometer ratings by study.
| Within-subjects | Between-subjects | |||
|---|---|---|---|---|
|
| ||||
| Pred.-IAT | Therm.-IAT | Pred.-IAT | Therm.-IAT | |
| Study 1 (N=65) | .51 | −.01 | .33 | .23 |
| Study 2 (N=90) | .53 | .20 | .39 | .23 |
| Study 3 (N=119) | .59 | .27 | .28 | .21 |
| Study 4 (N=156) | .53 | .24 | .31 | .21 |
| Average across studies | .54 | .20 | .31 | .22 |
Within-subject correlations are computed for each participant and then averaged across all participants in one study, or across all 430 participants in the last row. Between-subject correlations are computed per IAT and then averaged across 5 IATs per study. Thermometer ratings are simple scores in Studies 1 and 2, but reverse-scored here for easier comparability. Thermometer ratings in Studies 3 and 4 are computed as difference scores comparable to the IATs. Predictions are made on discrete 7-point scales (1–7) in Studies 1 and 2, and on continuous 61-point scales (1.0–7.0) in Studies 3 and 4. All average correlations presented here are significant at p<.05 (except the within-subject Thermometer-IAT correlation in Study 1).
As can be seen, the average prediction-IAT relationship, although significant, was lower when computed between-subjects than when it was computed within-subjects. That is, participants were reasonably accurate in predicting the pattern of their own IAT results (comparing IAT results to each other). However, their assessment of whether their biases were “slight”, “moderate,” or “strong,” had more limited predictive value when compared to the predictions of other (unknown) people. There was little difference, however, in the within- versus between-subjects analyses of the thermometer-IAT relationship.
Another way to look at this difference comes from an examination of the average IAT predictions and the average IAT scores, shown in Figure 5, across studies. At first glance, one can again see the accuracy with which participants predicted the pattern of their IAT results. When taking labeling conventions into consideration, however, one can also see that participants mostly perceived their own implicit biases to be “slight” (the area that would qualify as a “slightly more positive attitude” on the predictions scales – scale points 3 and 5 – is shaded grey in the graph). In contrast, according to scoring conventions for IAT D scores (Personal communication from N. Sriram to I. Blair on July 6, 2009), participants on average had “moderate” preferences, at least for White compared to Black and Latino (the area for a “slight” preference is again shaded grey in Figure 5).
Figure 5.

Average IAT score predictions (1–7 scale) and average actual IAT D scores across all four studies. Shaded areas represent the areas in which an implicit attitude would be labeled as “slightly more positive” on the predictions scales or as a “slight preference” according to conventions from the IAT webpage (www.projectimplicit.com, Nosek et al. 2006, personal communication from N. Sriram to I. Blair on July 6, 2009).
One could thus argue that participants in fact underestimated their biases. Note, however, that while the IAT cut-offs are based on statistical conventions for effect sizes, they have no absolute value in social reality. That is, whether or not the reaction a person feels toward a social group is “slight”, “moderate”, or “strong,” is entirely subjective and has no objective truth value attached to it. These considerations suggest that examining accuracy of self-insight with between-subjects analyses might be misleading, because different subjective interpretations and labeling preferences skew such analyses. The inevitable subjectivity of psychological experience makes a within-subject analysis a better way to study accuracy in awareness and self-insight.
Adaptation of Explicit Ratings to Implicit Attitudes
The thermometer ratings we have analyzed up to this point were the ones that participants made before they were told that their implicit attitudes would be measured. However, as described in the method sections, participants were asked to repeat their thermometer ratings toward the end of the study, after predicting their implicit attitude responses and completing the IATs. These additional ratings allow us to examine how participants’ perceptions of their explicit attitudes may have changed as a consequence of going through the full study. On the one hand, studies suggest that people are able to distinguish between “spontaneous activations” and “fully considered attitudes” (Ranganath et al., 2011). Hence, participants could be certain of their explicit attitudes towards the groups, regardless of their IAT experiences. On the other hand, explicit attitudes can be malleable and sensitive to contextual changes (Tesser, 1978; Tourangeau & Rasinski, 1988). Spending time thinking about implicit attitudes and experiencing the IAT might lead participants to reconsider their explicit attitudes in light of those experiences.
To investigate this question, we first looked at changes in participants’ average thermometer ratings from the beginning to end of each study. Results are depicted in Figure 6. Across studies, participants significantly changed their explicit attitudes towards all groups on average. They reduced their evaluations of Whites, t(429) = 2.43, p=.016, ηp2=.01, Blacks, t(429) = 8.83, p<.001, ηp2=.15, Asians, t(429) = 5.97, p<.001, ηp2=.08, Latinos, t(429) = 5.33, p<.001, ηp2=.06, children, t(429) = 2.57, p=.010, ηp2=.02, adults, t(274) = 7.76, p<.001, ηp2=.18, and regular people, t(274) = 8.54, p<.001, ηp2=.21; and they increased their evaluations of celebrities, t(429) = −11.44, p<.001, ηp2=.23.18
Figure 6.

Mean thermometer ratings before participants made their IAT score predictions (time 1) and after they completed all IATs (time 2) across all four studies (N=430). Scales range from 0–100 with higher score indicating more positive evaluations. Ratings of “regular people” and “adults” were only assessed in Studies 3 and 4. Hence, those means are based on a smaller sample (N=275). Error bars reflect standard errors.
To see whether these changes were in line with participants’ implicit attitudes, we ran a series of within-subject analyses in which we regressed participants’ post-IAT explicit thermometer ratings onto their earlier ratings (both standardized for each participant) as a first step, and then looked at whether any remaining variation in post-IAT scores could be explained by participants’ actual IAT scores. That is, did our participants adapt their explicit attitudes to their IAT performances?
Results indicated that they did. As can be seen in Table 9, participants’ IAT scores significantly explained variation in their post-IAT thermometer ratings that was unexplained by their earlier thermometer ratings.19 Random components indicated that the degree to which this was true was highly variable across participants. It thus seems that participants did not continue to make strong distinctions between their implicit reactions and explicit attitudes, after they had considered their implicit reactions and IAT performances. Instead, most participants changed their self-reported explicit attitudes to be more in line with those implicit reactions.
Table 9.
Time-2 thermometer ratings regressed on participants’ time-1 thermometer ratings and IAT D-scores.
| Parameters (DV: thermometer t2) | Study 1 estimates | Study 2 estimates | Study 3 estimates | Study 4 estimates |
|---|---|---|---|---|
| Fixed effects | ||||
| Thermometer t1 | .64*** | .74*** | .52*** | .55*** |
| IAT D-scores | .28*** | .20*** | .39*** | .34*** |
|
| ||||
| Random effect variances | ||||
| Thermometer t1 | .152*** | .058*** | .072*** | .101*** |
| IAT D-scores | .107*** | .050** | .025 | .044** |
| Residuals | .206*** | .176*** | .295*** | .277*** |
|
| ||||
| Goodness of fit | ||||
| −2 log likelihood | 572.86 | 646.73 | 1089.10 | 1449.41 |
p<.01
p<.001
Thermometer t1: Thermometer ratings completed before participants made their IAT score predictions; thermometer t2: Thermometer ratings completed after participants completed all predictions and IATs. All level-1 variables are standardized for each individual participant before they are entered in the analyses. Level-2 condition assignments are included in the analyses as control variables, but not represented here for simplicity. Thermometer ratings are simple scores in Studies 1 and 2, but reverse-scored in this table for easier comparability. Thermometer ratings in Studies 3 and 4 are computed as difference scores comparable to the IATs.
General Discussion
The purpose of these studies was to investigate the extent to which people may be aware of their implicit group attitudes. Arguing that low correlations between implicit and explicit attitudes do not necessarily indicate that people are unaware of their implicit attitudes, we asked participants to predict their future results on measures of implicit attitudes (IATs). We hypothesized that people would be reasonably accurate in their predictions, even when they report very different explicit attitudes. Results from all four studies supported this hypothesis by showing that participants’ predictions were considerably accurate under a variety of testing conditions, including one in which participants were given only limited explanation and no experience with the measure before making their predictions (Study 4). We interpret these results to mean that our participants had some awareness of their implicit attitudes – the extent to which they spontaneously respond more positively or negatively toward one target relative to another. Before we discuss the implications of these findings, it is important to place them in an appropriate context and consider alternative explanations.
We focused our studies on a particular measure of implicit attitudes, the IAT, because it is the most widely used implicit attitude measure. However the IAT is not the only test that is used to measure implicit attitudes, and different implicit attitude tests are often not highly correlated with one another (Bar-Anan & Nosek, 2013; Bosson et al., 2000; Cunningham, Preacher, & Banaji, 2001; Olson & Fazio, 2003). Aside from measurement error, the low inter-test correlations suggest that different tests might capture different aspects of the underlying implicit attitude, and thus our results cannot speak to people’s awareness of those aspects not captured by the IAT. Relatedly, our studies showed large variations in accuracy across participants. Some participants predicted the patterns of their IAT scores with near-perfect accuracy, whereas others’ predictions were entirely inaccurate.20 These findings might indicate that aspects of the mental construct that presumably influences IAT responses (i.e., the underlying implicit attitudes) are more accessible to some people than others. Random components in our models indicated no significant variation across participants in their accuracy slopes. This could indicate that the variation in the accuracy slopes that we found is in fact random, or that our paradigm based on only five IATs per participant might not be powerful enough to pick up meaningful inter-individual variations in accuracy that do exist. Future research is needed to more precisely delineate the limits of introspection of implicit attitudes.
In sum, our studies have shown that it is possible to accurately predict one’s IAT score, even in light of diverging explicit attitudes. Thus, our participants must have been aware of important aspects of the underlying mental construct that is responsible for their test performances, but not reflected in their explicit attitude reports.
An alternative interpretation of our results might be that once participants had given their predictions, they modified their performance on the IATs so that their scores would match the predictions they had made. We believe this interpretation to be unlikely for the following reasons. There is considerable evidence that it is very difficult if not impossible to fake an IAT result (Asendorpf, Banse, & Mücke, 2002; Banse, Seise, & Zerbes, 2001; Egloff and Schmukle, 2002; Kim, 2003; see Greenwald et al., 2009). Intentionally changing one’s IAT score requires a specific strategy of speeding up or slowing down in certain blocks (Greenwald et al., 2009, Hu, Rosenfeld & Bodenhausen, 2012) and Greenwald and colleagues report that few participants spontaneously discover it. Furthermore, even if participants had knowledge of how to change their scores, they would have to remember their predictions and very precisely adjust their performances on five tests, taken in random order. In sum, we think it unlikely that our accuracy results stem from participants willfully producing IAT scores that matched their predictions.
Another possibility might be that participants had accurate naive theories about how their culture portrays certain social groups and how this might affect them “implicitly”, and thus they based their predictions on these normative assumptions. Our data suggest that there was indeed a normative pattern across IAT responses, especially when comparing responses on the three ethnicity IATs with responses on the other two IATs. Importantly, however, this normative pattern was not redundant with participants’ accuracy. Participants’ predictions remained accurate when we only looked at IATs that measured biases against the three ethnic or racial groups, even though the pattern of those biases was not consistent or normative across participants. Furthermore, participants’ implicit attitudes were better explained by their own predictions than by the predictions of a random other participant (Study 2) and own predictions explained variance in IAT scores over and above predictions made for a “typical participant” (Study 3). These findings support the notion that participants have unique insight into their own patterns of implicit responses over and above normative ideas.
If we believe, then, that participants were in fact able to predict their own unique pattern of IAT responses, the question remains: How did they arrive at these accurate predictions? We see several possible routes through which participants could have engaged in accurate introspection.21 One possibility would be that participants remembered instances in which they had reacted to the attitude targets, and correctly inferred their implicit attitudes from these encounters, even in the absence of directly sensing those reactions. Another possibility is that when they were presented with the attitude targets, participants did in fact “feel” their affective reactions and reported on those reactions as their implicit attitudes, even though they might have invalidated those same responses as a basis for their explicit attitudes. We believe that it is this latter process that produced accurate predictions. Our reasoning is as follows.
Nisbett and Wilson (1977) famously argued that people have limited access to the sources of their cognitions, and considerable research shows that people’s memories are largely constructed ad hoc, rather than objective retrievals of past experience (e.g., Loftus, 2005). Research by Wilson and colleagues (Wilson, Dunn, Bybee, Hymann, & Rotondo, 1984, Wilson, Dunn, Kraft, & Lisle, 1989) further shows that attempts to define the sources of one’s attitudes are most often inaccurate and weaken attitude-behavior correspondence. Additionally, as discussed earlier, Monteith et al. (2001) found that most people did not attribute their biased behavior (IAT performance) to biased attitudes. In light of these findings, it seems unlikely that people would in fact have accurate access to the relevant past experiences that might indicate their implicit attitudes, let alone draw accurate inferences from them. Nonetheless, we cannot exclude such a process as responsible (at least in part) for the results we obtained.
Can participants sense their implicit attitudes, as gut feelings, intuitions, or some other internal process in response to seeing the targets or from mentally simulating encounters with them? Previous research shows that people can consider and make use of their intuitions or gut feelings when directed to do so, and that such processes increase the correspondence of explicit and implicit attitudes (e.g., Jordan et al., 2007; Richetin, et al., 2007; Ranganath et al., 2008; Smith & Nosek, 2011). Our own findings show that participants adapted their explicit attitudes to their IAT results after the prediction procedure (and thus considered their newly introspected-upon implicit reactions “feelings”), even though they never received objective feedback on the outcomes of those IATs. Lastly, as outlined earlier, support for this process is derived from the APE model (Gawronski & Bodenhausen, 2006) in that people may feel their spontaneous affective reactions to an attitude target but can invalidate those feelings when answering explicit attitude questions, producing an implicit-explicit dissociation that has nothing to do with their awareness of the underlying mental constructs. Altogether, the findings suggest that people can sense their internal spontaneous reactions, making it more plausible that this sense behind their ability to accurately predict their implicit attitude scores in the present studies. Although our data are consistent with this account, future research is needed to show how exactly participants arrive at accurate predictions for their IAT scores.
Different analyses aimed at investigating the extent to which self-presentational concerns would play a role in accurate predictions yielded some interesting results. On the one hand, a manipulation aimed at directly influencing the threat an accurate prediction would cause for a participant’s desired self-concept yielded no support (Studies 1 and 2). On the other hand, an analysis of the mean bias values participants predicted did show that participants interpreted their biases towards minorities to be very mild, and weaker than the biases of other people (i.e., the average study participant in Study 3). Additionally, an analysis that focused solely on the three minority IATs also yielded somewhat lower within-subject correlations than the analyses including all five target pairs. This could be due to the reduction in variance that comes from estimating correlations based on only three data points that are close to one another, but could also be interpreted as a result of higher social-desirability concerns for these IATs involving minority groups. These findings lend some support to the notion that people might be hesitant to admit the scope and strength of their ingroup biases, even if they are generally aware of their existence.
Re-examining Relations Between Implicit and Explicit Attitudes
While our data show that predictions of implicit attitudes were quite accurate, relations between implicit and explicit attitudes followed a rather different pattern. First, the relationships between implicit and explicit attitudes were always lower in these data than the relationship between implicit attitudes and implicit-attitude predictions. Second, relationships between explicit attitudes and IAT scores were explained by participants’ predictions of their implicit attitudes. These results are quite consistent with the APE model’s prediction that people can be aware of their implicit reactions but decide on different explicit attitudes after considering other propositions (Gawronski & Bodenhausen, 2006). Specifically, participants are able to note their implicit reactions, but differ in how much attention and weight they give this implicit reaction for an explicit attitude rating. The result will be low and highly variable implicit-explicit relationships. But this low and variable relationship is independent of participants’ high ability to predict implicit attitude scores.
Interestingly, an examination of participants’ explicit attitudes after they had made their predictions and completed the IATs indicated that they altered their explicit attitudes to be more in line with their implicit attitudes. This is especially interesting as we never gave participants feedback on their IAT scores. It was still thus their own conscious perception of these IAT scores that drove this adaptation. A variety of procedural factors may have contributed to a higher weighting of implicit attitudes in these later explicit reports. For example, we likely validated participants’ implicit reactions by asking them to report those separately, and such reactions would have been highly salient after they had made their predictions and completed their IATs, further validating them as a basis for an explicit judgment (Gawronski & Bodenhausen, 2006; Tesser, 1978; Tourangeau & Rasinksi, 1988). Furthermore, anecdotal reading of participants’ essays in Studies 3 and 4 showed that many participants considered their implicit attitudes to be more truthful than their initial explicit thermometer ratings. In fact, we administered the same questions in Studies 3 and 4 that were used as manipulation checks in Studies 1 and 2. Results showed that participants generally agreed with the idea that their implicit attitudes reflect their “true underlying attitudes” – even though they were not told anything about this in these two studies.22
The possibility that participants modified their explicit attitudes after they predicted their implicit attitudes and, after taking the IATs, considered these to be their “true attitudes,” raises some important practical considerations. That is, in light of the extensively reported implicit bias most Americans hold against racial and ethnic minorities (instead favoring the white majority), this effect could be considered troublesome if people use their newly formed explicit attitudes to guide behavior. On the other hand, some models of prejudice reduction (e.g., Monteith & Mark, 2005) suggest that awareness of one’s implicit biases is a good and healthy first step for the effortful control of prejudiced reactions. That is, participants might use their newly acquired knowledge to be more careful in their behavior, and more aware of their possibly biased reactions. Indeed, during one debriefing session a participant pointedly noted her conflict about the newly acquired information: “I feel guilty because I think that I am an intuitive person. Yet, based on this test, it shows that if I go with my initial gut instinct about race and value judgments I am actually quite judgmental.” Future research is needed to assess the effects of introspection and knowledge of implicit processes on subsequent behavior and other processes, and the conditions that influence subsequent reactions.
Implicit Associations and the IAT
We have so far interpreted our results as showing that participants are aware of the spontaneous affective reactions towards social groups that are captured by IATs. It is important to note in that respect, that the IAT is not in fact a process-pure measure of only such reactions. As many authors have noted (Conrey et al., 2005; Payne, 2005, 2008), an IAT score reflects not only a person’s automatic associations, but also his or her distinct ability to overcome this bias and press the correct button when required.23 Since the results of IATs are generally referred to as implicit attitudes, we chose to use this terminology for the current paper. However, it is an interesting question what cognitive processes participants are considering when they predict their upcoming IAT performances: Their spontaneous associations, how fast they will be at overcoming them, or both? On the one hand, Study 4 showed that participants were able to predict the pattern of their IAT scores even when they did not know how the IAT worked, minimizing the possibility that they were making predictions based on awareness of their executive abilities on reaction time tasks in general, or how those could possibly alter a specific IAT score. This would support an interpretation that participants are predicting only their affective associations. On the other hand, a participant’s ability to control a spontaneously activated association and press the correct button might reflect a general disposition for behavioral and emotional control that is an integral part of his or her self-knowledge. In that case, participants might be predicting both their spontaneous associations and their ability to control them, as reflected in an IAT score. One might argue that such control would likely be constant for one person across several IATs and thus irrelevant for within-subject correlations. Nonetheless, future research should investigate what specific cognitive processes that play into IAT scores people are aware of.
Other Limitations
Our studies were focused on people’s awareness of the content of their implicit attitudes. As noted in the beginning, there are many other aspects of implicit attitudes of which people might or might not be aware. In addition to awareness of contents, Gawronski et al. (2008) add two: Awareness of the source of an attitude, and awareness of the impact an attitude can have on subsequent judgments and behavior. Although people may acknowledge that they could be influenced by intergroup biases (Bar-Anan & Nosek, 2012; Payne et al., 2013), directly instructing them to avoid such an influences seems to have little effect (Cameron, Brown-Iannuzzi, & Payne, 2012; Payne, Cheng, Govorun, & Steward, 2005; Payne et al., 2013). These studies suggest that either participants are aware of an influence but don’t know how to control it, or they are aware of the possibility of influence but not aware of specific influences in a particular task. These are important aspects of automaticity and awareness to which the present studies cannot speak.
Additionally, it is important to note that we inferred content awareness from within-subject correlations. That is, participants in our studies were able to predict how their biases towards different social groups related to each other. Their predictions fared less well when compared to the predictions of others. Together with the findings that our participants tended to label their biases as “weak”, this might suggest that people have limited awareness of the scope and severity of their biases. Our studies furthermore showed that participants were able to predict the pattern of implicit attitudes when we asked them the questions we asked them. We cannot speak to whether people are generally aware of their attitudes, or whether they would have thought of them if we hadn’t asked them. Reports of the surprise people feel at their first experience with an IAT suggest that many people do not think of these spontaneous reactions before they are confronted with an implicit attitude measure (see Banaji, 2001; Dateline NBC, 2007; Gladwell, 2005; Tierney, 2008b). Future research is needed to delineate the limits of introspection and awareness in implicit social cognition.
Conclusion
Implicit attitude measures, and especially the IAT, have received considerable attention both among researchers and the popular media (Dateline NBC, 2007; Gladwell, 2005; Operah.com, 2006; The Economist, 2012; Tierney, 2008a, 2008b). In most academic and popular representations, implicit attitudes are portrayed as “unconscious” and inaccessible to introspection. The current set of studies showed that, contrary to this widespread presentation, it is possible to accurately predict the pattern of one’s implicit attitudes, without information from a test, even when the implicit attitudes are quite different from explicit “feelings” towards the same targets, and even when these attitudes might shed a possibly uncomfortable light on a person. In light of these findings, it is important that the characterization of implicit attitudes be carefully considered, both in the academic community and for the general public.
Acknowledgments
We thank Bernadette Park and the other members of the CU Stereotyping and Prejudice lab for helpful comments throughout the course of these studies. We also thank Bertram Gawronski, as well as Jan de Houwer, Anthony Greenwald, and four anonymous reviewers for their helpful comments on an earlier version of this paper. Finally, we wish to thank the following research assistants for help in conducting these studies: Natalie Wheeler, Jack Hager, Nicole Hein, Brian Krantz, A. Kismet Smith, Laura Durkin, Owen Alexander, and Daniel Milman. During the course of this work, Adam Hahn was supported by a graduate fellowship from the German National Academic Foundation and another fellowship from the University of Colorado Boulder Graduate School. Irene Blair received funding from grant HL088198 by the National Heart, Lung, and Blood Institute of the National Institutes of Health. This research was part of Adam Hahn’s dissertation, completed at the University of Colorado Boulder.
Footnotes
The term implicit attitude was derived from research on implicit memory to describe attitudes that reflect “traces of memory” of which a person is not aware (Greenwald & Banaji, 1995; Payne & Gawronski, 2010). Some may question whether awareness can be applied to a phenomenon that is defined as implicit. Note in this regard, that the term implicit was originally chosen to refer to unawareness of the sources of an attitude (i.e., the memories or traces of past events that underlie the attitude), and was only later misinterpreted by many to mean unawareness of the attitude itself (Gawronski, Hofmann, & Wilbur, 2006). We agree with others that awareness of the content of implicit attitudes is an empirical question (Gawronski and Bodenhausen, 2006; Gawronski et al., 2006) and it is this question we address in the current paper. Furthermore, researchers have recently emphasized the importance of distinguishing the underlying latent attitude construct from the manifest outcome of a measurement procedure (e.g., De Houwer, Gawronski, & Barnes-Holmes, in press). We generally agree with these concerns and tried to be mindful of this important distinction in the presentation of our own results. However, to remain in line with existing conventions in the literature, we do not use separate terms to refer to measurement outcomes and underlying constructs. We return to this topic in the General Discussion.
It is important to note that the IAT is not a process-pure measure of implicit associations. Rather, IAT scores reflect responses that are the result of a variety of processes, including an activated association and a person’s desire and ability to overcome that association by making a different response (Conrey, Sherman, Gawronski, Hugenberg, & Groom, 2005; Payne, 2005 2008). As such, IATs merely approximate associations by limiting the influence of controlled processes, while never entirely eliminating them. We return to the topic of underlying processes in the General Discussion.
Participants also completed two shorter practice IATs described below. The valence words were sorted alone during the first practice IAT. Because good and bad words were sorted the same way for all IATs, this block was not repeated after the initial practice.
Varying the order of the blocks imposes differing executive demands on participants (the second pairing is more difficult and will take longer, regardless of the evaluative associations a person holds). Counterbalancing block order would thus introduce a source of systematic error variation between different IATs and different participants beyond the evaluative associations that this study is concerned with. Hence, the order was held constant. For a more detailed explanation of the logic of not counter-balancing IATs for individual difference studies, see Egloff & Schmukle, 2002; Gawronski, 2002; Hofmann et al., 2008).
Results for these second thermometer ratings are discussed at the end of the paper.
All of the multi-level analyses were conducted using the mixed-model commands in SPSS/PASW 19 with its associated default settings for statistical conventions, unless otherwise noted.
We also repeated all these analyses only mean-centering each participant’s predictions, but not standardizing each participant’s scores. The sizes of the slopes resulting from these analyses based on un-standardized values, however, are influenced by a variety of factors other than accuracy. For instance, a person who uses the prediction scale more conservatively (e.g., refuses to use the end points of the scale to describe his or her bias) could result in a higher slope for the relationship between predictions and IAT scores than a person with the same IAT scores that uses the prediction scale less conservatively. This could happen even in cases where both participants estimate the pattern of their biases accurately. Because we were interested in how well participants were able to predict the pattern of their IAT results (see “current research” section), we thus decided to focus our analyses on slopes based on standardized values that are a clearer indication of accuracy. Notwithstanding these theoretical considerations, results are in fact similar when using unstandardized, group-mean-centered, values for all analyses reported in this paper.
In the model with standardized values, each participant’s mean IAT score, and thus the level-one intercepts equal zero. Accordingly, these intercepts do not vary and cannot be modeled as a function of condition. Analyses run on unstandardized, but group-mean-centered level-1 IV values (cp. footnote 7), showed no condition effects on the intercepts. That is, the absolute size of bias (IAT scores) was not affected by condition in this or any other studies reported in this paper.
The model does not include Condition as a level-2 predictor because the participants were randomly assigned to condition after they gave their explicit thermometer ratings.
Note that the negative sign of this relationship is theoretically consistent: The thermometers were scored as more liking of the target group, whereas the IATs were scored as pro-White (and thus anti-target-group) bias.
The same analyses conducted on Study 1 data yielded similar results.
We also ran an analysis in which we averaged all participants’ predictions and compared the relationship of this average prediction and every person’s IAT scores with the relationship of each person’s own unique predictions and his or her scores in a simultaneous multi-level regression. Results indicated again that there was in fact a normative pattern, and thus the average participant’s prediction was related to every person’s IAT score to some degree, b = .32, t(126.14) = 6.24, p<.001. Importantly, participants own unique prediction explained variance over and above this average prediction, b=.33, t(128.87) = 6.71, p=.001. That is, deviations of participants’ IAT scores from the normative pattern could be explained by their own unique prediction for their own scores.
This large sample size for the two between-subject conditions happened due to an unfortunate miscommunication with the research assistant who administered this study. Still, data were not analyzed until the full sample was collected. And the only between-subjects factor (the counterbalancing factor) did not have a significant effect despite this unintended increase in power (see results section).
The cut-offs that were used to categorize the bias were modified to describe intervals of equal size. The new cut-offs were <|.13| for “same” (no preference), >|.13| for “slightly more positive towards group x”, >|.39|: “moderately more positive towards group x”, and >|.65|: “a lot more positive towards group x”. Scores higher than .78 or lower than −.78 were reported as “7” or “1”, respectively. The formula that was used to transform the scores into the 1–7 point scale was (D score*3.84615…)+4, with the result rounded to one decimal.
Results for these second explicit ratings are reported in the end.
We also conducted a multi-level analysis with participants’ prediction for themselves regressed on their prediction for the average participant on level 1 (both variables person-standardized), and the effect of order on this relationship analyzed on level-2. This analysis revealed that the correlation between participants’ predictions for themselves and their predictions for the average participant was marginally higher when participants predicted the score for the average student first than when they predicted their own score first, b = .06, t(118) =1.85, p =.07. Since none of the other effects of theoretical interest were influenced by this order effect, it is not discussed further.
Condition effects (and lacks thereof) were largely replicated in the between-subject analyses. Specifically, as in the within-subject analyses, there were no significant condition effects in Studies 2, 3 or 4; and there was a marginal trend for predictions to be more accurate in the attitudes condition as opposed to the associations conditions in Study 1, b=.09, t(321.0) = 1.73, p=.09.
There was considerable variation across the four studies considering whether the changes were significant. Specifically, only the changes of evaluations of Blacks, Celebrities, regular people, and adults were significant in every study where they were assessed. The reduction in evaluations of Whites was only significant in Study 4 (but not Studies 1–3); Asian in Studies 3 and 4 (but not 1 and 2); reduction in evaluations of children was only significant in Study 3 (but none of the other studies), and changes in evaluations of Latinos were only significant in Studies 1, 3, and 4 (but not 2). These interpretations are based on an α-level of p<.05.
Interactions of all these relationships with condition assignments are included as predictors in the models, but not presented in Table 8 for simplicity. There were no meaningful condition effects in any of the studies. That is, participants adapted their explicit thermometer ratings to their implicit attitudes independent of framing in Studies 1 and 2, both |t|’s < 1; and independent of order condition in Study 3, b=.04 t(118.51) = 1.38, p=.17. There was an effect of the explanation-by-experience-by-IAT-score three-way interaction in Study 4, b=.08, t(147.09) = 2.79, p=.006. This interaction said that IAT scores explained more remaining variance in post-IAT thermometer ratings in the full-explanation/full-experience and the minimal-explanation/no-experience condition than in the other two conditions. We did not find this effect to be theoretically meaningful and it is not interpreted further.
Precisely, the 15% most accurate of our participants (63 out of 430) showed correlations of .90 or higher, and the 15% least accurate of our participants (also 63 out of 430) showed correlations below .10. Nosek (2007) reports reliability estimates for the IAT of .70–.90.
We define introspection as any process of observing one’s own cognitions or behaviors.
Results for the mean ratings of the “true attitudes” scale: Study 3: M=4.60, SE=.10, difference from the neutral mid-point of 4: t(118) = 5.84, p<.001 ηp2=.22; Study 4: M=4.39, SE=.10, difference from the neutral midpoint of 4: t(153) = 3.83, p<.001, ηp2=.09.
In Conrey et al.’s (2005) analysis based on error terms, two additional parameters play into IAT completion: A person’s ability to discriminate the target objects (D), and a possible general propensity for preferring the left or right button in general, in cases where a person cannot discriminate the targets and guesses at random (G). However, since neither of these two parameters is correlated with IAT D scores, which are based on reaction times and not error rates (Conrey et al., 2005), they are irrelevant for the current analyses. That is, of the four processes, only a person’s associations and his or her ability to overcome them are reflected in IAT D scores.
References
- Agerström J, Rooth DO. The role of automatic obesity stereotypes in real hiring discrimination. Journal of Applied Psychology. 2011;96(4):790–805. doi: 10.1037/a0021594. [DOI] [PubMed] [Google Scholar]
- Asendorpf JB, Banse R, Mücke D. Double dissociation between implicit and explicit personality self-concept: The case of shy behavior. Journal of Personality and Social Psychology. 2002;83:380–393. [PubMed] [Google Scholar]
- Banaji MR. Implicit attitudes can be measured. In: Roediger HL, Nairne JS, Neath I, Surprenant A, editors. The nature of remembering: Essays in remembering Robert G. Crowder. Washington, DC: American Psychological Association; 2001. pp. 117–150. [Google Scholar]
- Banaji MR, Heiphetz L. Attitudes. In: Fiske ST, Gilbert DT, Lindzey G, editors. Handbook of Social Psychology. New York: John Wiley & Sons; 2010. pp. 348–388. [Google Scholar]
- Banse R, Seise J, Zerbes N. Implicit attitudes towards homosexuality: Reliability, validity, and controllability of the IAT. Zeitschrift für Experimentelle Psychologie. 2001;48:145–160. doi: 10.1026//0949-3946.48.2.145. [DOI] [PubMed] [Google Scholar]
- Bar-Anan Y, Nosek BA. Reporting Intentional Rating of the Primes Predicts Priming Effects in the Affective Misattribution Procedure. Personality and Social Psychology Bulletin. 2012;38:1194–1208. doi: 10.1177/0146167212446835. [DOI] [PubMed] [Google Scholar]
- Bar-Anan Y, Nosek BA. A comparative investigation of seven implicit measures of social cognition. Unpublished manuscript. 2013 Available at SSRN: http://ssrn.com/abstract=2074556 or http://dx.doi.org/10.2139/ssrn.2074556.
- Bargh JA. The four horsemen of automaticity: Awareness, intention, efficiency, and control in social cognition. In: Wyer RS Jr, Srull TK, editors. Handbook of social cognition. 2. Hillsdale, NJ: Lawrence Erlbaum Associates, Inc; 1994. pp. 1–40. [Google Scholar]
- Bosson JK, Swann WB, Pennebaker JW. Stalking the perfect measure of implicit self-esteem: The blind men and the elephant revisited? Journal of Personality and Social Psychology. 2000;79:631–643. [PubMed] [Google Scholar]
- Blair IV. Implicit stereotypes and prejudice. In: Moskowitz GB, editor. Cognitive social psychology. Mahwah, NJ: Lawrence Erlbaum Associates Inc; 2001. [Google Scholar]
- Blair IV, Steiner JF, Fairclough D, Hanratty R, Price DW, Hirsh HK, Wright LA, Bronsert M, Karimkhani E, Magid DJ, Havranek EP. Clinicians’ Implicit Ethnic/Racial Bias and Perceptions of Care Among Black and Latino Patients. Annals of Family Medicine. 2013;11(1):43–52. doi: 10.1370/afm.1442. [DOI] [PMC free article] [PubMed] [Google Scholar]
- Cameron CD, Brown-Iannuzzi JL, Payne BK. Sequential Priming Measures of Implicit Social Cognition: A Meta-Analysis of Associations With Behavior and Explicit Attitudes. Personality and Social Psychology Review. 2012;16:330–350. doi: 10.1177/1088868312440047. [DOI] [PubMed] [Google Scholar]
- Conrey FR, Sherman JW, Gawronski B, Hugenberg K, Groom CJ. Separating Multiple Processes in Implicit Social Cognition: The Quad Model of Implicit Task Performance. Journal of Personality and Social Psychology. 2005;89:469–487. doi: 10.1037/0022-3514.89.4.469. [DOI] [PubMed] [Google Scholar]
- Cunningham WA, Nezlek JB, Banaji MR. Implicit and explicit ethnocentrism: Revisiting the ideologies of prejudice. Personality and Social Psychology Bulletin. 2004;30:1332–1346. doi: 10.1177/0146167204264654. [DOI] [PubMed] [Google Scholar]
- Cunningham WA, Preacher KJ, Banaji MR. Implicit attitude measurement: Consistency, stability, and convergent validity. Psychological Science. 2001;12:163–170. doi: 10.1111/1467-9280.00328. [DOI] [PubMed] [Google Scholar]
- Dateline NBC (producer) Dateline NBC: Psychological dispositions in Black & White [video webcast][Television series episode] Dateline NBC; 2007. Apr 16, Retrieved May 2, 2012 from http://www.youtube.com/watch?v=sYQVDik69Nw. [Google Scholar]
- De Houwer J, Gawronski B, Barnes-Holmes D. A functional-cognitive framework for attitude research. European Review of Social Psychology (in press) [Google Scholar]
- Dempsey M, Mitchell A. The influence of implicit attitudes on choice when consumers are confronted with conflicting attribute information. Journal of Consumer Research. 2010;37(4):614–625. [Google Scholar]
- Devos T. Implicit attitudes 101: Theoretical and empirical insights. In: Crano WD, Prislin R, editors. Attitudes and attitude change. New York, NY: Psychology Press; 2008. pp. 61–84. [Google Scholar]
- Devine PG. Stereotypes and prejudice: Their automatic and controlled components. Journal of Personality and Social Psychology. 1989;56:5–18. [Google Scholar]
- Dovidio JF, Kawakami K, Gaertner SL. Implicit and explicit prejudice and interracial interaction. Journal of Personality and Social Psychology. 2002;82:62–68. doi: 10.1037//0022-3514.82.1.62. [DOI] [PubMed] [Google Scholar]
- Egloff B, Schmukle SC. Predictive validity of an Implicit Association Test for assessing anxiety. Journal of Personality and Social Psychology. 2002;83:1441–1455. [PubMed] [Google Scholar]
- Fazio RH, Jackson JR, Dunton BC, Williams CJ. Variability in automatic activation as an unobtrusive measure of racial attitudes: a bona-fide pipeline? Journal of Personality and Social Psychology. 1995;69:1013–1027. doi: 10.1037//0022-3514.69.6.1013. [DOI] [PubMed] [Google Scholar]
- Friese M, Hofmann W, Schmitt M. When and why do implicit measures predict behavior? Empirical evidence for the moderating role of opportunity, motivation, and process reliance. European Review of Social Psychology. 2008;19:285–338. [Google Scholar]
- Galdi S, Arcuri L, Gawronski B. Automatic mental associations predict future choices of undecided decision-makers. Science. 2008;321:1100–1102. doi: 10.1126/science.1160769. [DOI] [PubMed] [Google Scholar]
- Gawronski B. What does the Implicit Association Test measure? A test of the convergent and discriminant validity of prejudice-related IATs. Experimental Psychology. 2002;49:171–180. doi: 10.1026//1618-3169.49.3.171. [DOI] [PubMed] [Google Scholar]
- Gawronski B, Bodenhausen GV. Associative and propositional processes in evaluation: An integrative review of implicit and explicit attitude change. Psychological Bulletin. 2006;132:692–731. doi: 10.1037/0033-2909.132.5.692. [DOI] [PubMed] [Google Scholar]
- Gawronski B, Brochu PM, Sritharan R, Strack F. Cognitive consistency in prejudice-related belief systems: Integrating old-fashioned, modern, aversive and implicit forms of prejudice. In: Gawronski B, Strack F, editors. Cognitive consistency: A fundamental principle in social cognition. New York: Guilford Press; 2012. pp. 369–389. [Google Scholar]
- Gawronski B, Hofmann W, Wilbur CJ. Are “implicit” attitudes unconscious? Consciousness and Cognition. 2006;15:485–499. doi: 10.1016/j.concog.2005.11.007. [DOI] [PubMed] [Google Scholar]
- Gawronski B, Payne BK. Handbook of implicit social cognition: Measurement, theory, and applications. New York, NY, US: Guilford Press; 2010. [Google Scholar]
- Gladwell M. Blink: The power of thinking without thinking. New York City, NY: Little, Brown and Company; 2005. [Google Scholar]
- Green AR, Carney DR, Pallin DJ, Ngo LH, Raymond KL, Iezzoni L, et al. Implicit bias among physicians and its prediction of thrombolysis decisions for black and white patients. Journal of General Internal Medicine. 2007;22(9):1231–1238. doi: 10.1007/s11606-007-0258-5. [DOI] [PMC free article] [PubMed] [Google Scholar]
- Greenwald AG, Banaji MR. Implicit social cognition: Attitudes, self-esteem, and stereotypes. Psychological Review. 1995;102:4–27. doi: 10.1037/0033-295x.102.1.4. [DOI] [PubMed] [Google Scholar]
- Greenwald AG, McGhee DE, Schwartz JLK. Measuring individual differences in implicit cognition: The implicit association test. Journal of Personality and Social Psychology. 1998;74:1464–1480. doi: 10.1037//0022-3514.74.6.1464. [DOI] [PubMed] [Google Scholar]
- Greenwald AG, Nosek BA, Banaji MR. Understanding and using the Implicit Association Test: I. An improved scoring algorithm. Journal of Personality and Social Psychology. 2003;85:197–216. doi: 10.1037/0022-3514.85.2.197. [DOI] [PubMed] [Google Scholar]
- Greenwald AG, Poehlman TA, Uhlmann EL, Banaji MR. Understanding and using the Implicit Association Test: III. Meta-analysis of predictive validity. Journal of Personality and Social Psychology. 2009;97:17–41. doi: 10.1037/a0015575. [DOI] [PubMed] [Google Scholar]
- Gschwendtner T, Hofmann W, Schmitt M. Synergistic moderator effects of situation and person factors of awareness and adjustment on the consistency of implicit and explicit attitudes. Journal of Individual Differences. 2006;27:47–56. [Google Scholar]
- Hahn A, Gawronski B. Do implicit evaluations reflect unconscious attitudes? Behavioral and Brain Sciences. doi: 10.1017/S0140525X13000721. (in press) [DOI] [PubMed] [Google Scholar]
- Hofmann W, Gawronski B, Gschwendner T, Le H, Schmitt M. A meta-analysis on the correlation between the implicit association test and explicit self-report measures. Personality and Social Psychology Bulletin. 2005a;31:1369–1385. doi: 10.1177/0146167205275613. [DOI] [PubMed] [Google Scholar]
- Hofmann W, Gschwendner T, Nosek BA, Schmitt M. What moderates implicit-explicit consistency? European Review of Social Psychology. 2005b;16:335–390. [Google Scholar]
- Hofmann W, Gschwendner T, Wiers R, Friese M, Schmitt M. Working memory capacity and self-regulation: Towards an individual differences perspective on behavior determination by automatic versus controlled processes. Journal of Personality and Social Psychology. 2008;95:962–977. doi: 10.1037/a0012705. [DOI] [PubMed] [Google Scholar]
- Hu X, Rosenfeld JP, Bodenhausen GV. Combating automatic autobiographical associations: The effect of instruction and training in strategically concealing information in the autobiographical implicit association test. Psychological Science. 2012;23:1079–1085. doi: 10.1177/0956797612443834. [DOI] [PubMed] [Google Scholar]
- Jones EE, Sigall H. The bogus pipeline: A new paradigm for measuring affect and attitude. Psychological Bulletin. 1971;76:349–364. [Google Scholar]
- Jordan CH, Whitfield M, Zeigler-Hill V. Intuition and the correspondence between implicit and explicit self-esteem. Journal of Personality and Social Psychology. 2007;93:1067–1079. doi: 10.1037/0022-3514.93.6.1067. [DOI] [PubMed] [Google Scholar]
- Jost JT, Pelham BW, Carvallo MR. Non-conscious forms of system justification: Implicit and behavioral preferences for higher status groups. Journal of Experimental Social Psychology. 2002;38:586–602. [Google Scholar]
- Kassin S, Fein S, Markus HR. Social Psychology. 8. Belmont, CA: Wadsworth Cengage Learning; 2011. [Google Scholar]
- Kenrick DT, Neuberg SL, Cialdini RB. Social psychology: Goals in interaction. 5. Boston, MA: Allyn & Bacon; 2010. [Google Scholar]
- Kihlstron JF. Implicit methods in social psychology. In: Sansone C, Morf CC, Panter AT, editors. The Sage handbook of methods in social psychology. Thousand Oaks, CA: Sage Publications; 2004. pp. 195–212. [Google Scholar]
- Kim DY. Voluntary controllability of the Implicit Association Test (IAT) Social Psychology Quarterly. 2003;66:83–96. [Google Scholar]
- Krueger J. On the perception of social consensus. Advances in Experimental Social Psychology. 1998;30:163–240. [Google Scholar]
- Loftus EF. Planting misinformation in the human mind: A 30-year investigation of the malleability of memory. Learning & Memory. 2005;12(4):361–366. doi: 10.1101/lm.94705. [DOI] [PubMed] [Google Scholar]
- McConnell AR, Dunn EW, Austin SN, Rawn CD. Blind spots in the search for happiness: Implicit attitudes and nonverbal leakage predict affective forecasting errors. Journal of Experimental Social Psychology. 2011;47(3):628–634. [Google Scholar]
- Minear M, Park DC. A lifespan database of adult facial stimuli. Behavior Research Methods, Instruments, & Computers. 2004;36:630–633. doi: 10.3758/bf03206543. [DOI] [PubMed] [Google Scholar]
- Monteith MJ, Mark AY. Changing one’s prejudice ways: Awareness, affect, and self-regulation. European Review of Social Psychology. 2005;16:113–154. [Google Scholar]
- Monteith MJ, Voils CI, Ashburn-Nardo L. Taking a look underground: Detecting, interpreting, and reacting to implicit biases. Social Cognition. 2001;19:395–417. [Google Scholar]
- Newell BR, Shanks DR. Unconscious Influences on Decision Making: A Critical Review. Behavioral and Brain Sciences (Target Article) doi: 10.1017/S0140525X12003214. (in press) [DOI] [PubMed] [Google Scholar]
- Nier JA. How dissociated are implicit and explicit measures of racial attitudes? A bogus pipeline approach. Group Processes and Intergroup Relations. 2005;8:39–52. [Google Scholar]
- Nisbett RE, Wilson TD. Telling more than we can know: Verbal reports on mental processes. Psychological Review. 1977;84:231–259. [Google Scholar]
- Nosek BA. Moderators of the relationship between implicit and explicit evaluation. Journal of Experimental Psychology: General. 2005;134:565–584. doi: 10.1037/0096-3445.134.4.565. [DOI] [PMC free article] [PubMed] [Google Scholar]
- Nosek BA. Implicit-explicit relationships. Current Directions in Psychological Sciences. 2007;16:65–69. [Google Scholar]
- Nosek BA, Banaji MR, Greenwald AG. Harvesting implicit group attitudes and beliefs from a demonstration web site. Group Dynamics: Theory, Research, and Practice. 2002;6:101–115. [Google Scholar]
- Nosek BA, Banaji MR, Greenwald AG. All information cited was last retrieved on June. 2006;15:2012. Website: http://implicit.harvard.edu/ [Google Scholar]
- Nosek BA, Hansen JJ. The associations in our heads belong to us: Searching for attitudes and knowledge in implicit evaluation. Cognition and Emotion. 2008;22:553–594. [Google Scholar]
- Nosek BA, Hawkins CB, Frazier RS. Implicit social cognition: From measures to mechanisms. Trends in Cognitive Sciences. 2011;15:152–159. doi: 10.1016/j.tics.2011.01.005. [DOI] [PMC free article] [PubMed] [Google Scholar]
- Nosek BA, Hawkins CB, Frazier RS. Implicit Social Cognition. In: Fiske S, Macrae CN, editors. Handbook of Social Cognition. New York, NY: Sage; 2012. pp. 31–53. [Google Scholar]
- Nosek BA, Smyth FL. A multitrait-multimethod validation of the implicit association test. Implicit and explicit attitudes are related by distinct constructs. Experimental Psychology. 2007;54:15–29. doi: 10.1027/1618-3169.54.1.14. [DOI] [PubMed] [Google Scholar]
- Olson MA, Fazio RH. Relations between implicit measures of prejudice: What are we measuring? Psychological Science. 2003;14:636–639. doi: 10.1046/j.0956-7976.2003.psci_1477.x. [DOI] [PubMed] [Google Scholar]
- Oprah.com (producer) Overcoming Prejudice. Oprah.com; 2006. Jan 1, Retrieved May 2, 2012 from http://www.oprah.com/oprahshow/Overcoming-Prejudice/13. [Google Scholar]
- Payne BK. Conceptualizing Control in Social Cognition: How executive control modulates the expression of automatic stereotyping. Journal of Personality and Social Psychology. 2005;89:488–503. doi: 10.1037/0022-3514.89.4.488. [DOI] [PubMed] [Google Scholar]
- Payne BK. What mistakes disclose: A process dissociation approach to automatic and controlled processes in social psychology. Social and Personality Psychology Compass. 2008;2:1073–1092. [Google Scholar]
- Payne BK, Brown-Iannuzzi J, Burkley M, Arbuckle NL, Cooley E, Cameron CD, Lundberg KB. Intention Invention and the Affect Misattribution Procedure: Reply to Bar-Anan and Nosek (2012) Personality and Social Psychology Bulletin. 2013;39:375–386. doi: 10.1177/0146167212475225. [DOI] [PubMed] [Google Scholar]
- Payne BK, Cheng CM, Govorun O, Stewart B. An inkblot for attitudes: Affect misattribution as implicit measurement. Journal of Personality and Social Psychology. 2005;89:277–293. doi: 10.1037/0022-3514.89.3.277. [DOI] [PubMed] [Google Scholar]
- Petty RE, Fazio RH, Brinol P. Attitudes: Insights from the new implicit measures. Vol. 2008 New York, NY, US: Psychology Press; 2008. [Google Scholar]
- Phelps EA, O’Connor KJ, Cunningham WA, Funayama ES, Gatenby JC, Gore JC, Banaji MR. Performance on indirect measures of race evaluation predicts amygdala activation. Journal of Cognitive Neuroscience. 2000;12:729–738. doi: 10.1162/089892900562552. [DOI] [PubMed] [Google Scholar]
- Quillian L. Does unconscious racism exist? Social Psychology Quarterly. 2008;71(1):6–11. [Google Scholar]
- Ranganath (Ratliff) KA, Smith CT, Nosek BA. Distinguishing automatic and controlled components of attitudes from direct and indirect measurement methods. Journal of Experimental Social Psychology. 2008;44:386–396. doi: 10.1016/j.jesp.2006.12.008. [DOI] [PMC free article] [PubMed] [Google Scholar]
- Richetin J, Perugini M, Adjali I, Hurling R. The moderating role of intuitive versus deliberative decision making for the predictive validity of implicit and explicit measures. European Journal of Personality. 2007;21:529–546. [Google Scholar]
- Ross L, Greene D, House P. The “false-consensus effect:” An egocentric bias in social perception and attribution processes. Journal of Experimental Social Psychology. 1977;13:279–301. [Google Scholar]
- Rudman LA, Greenwald AG, Mellott DS, Schwartz JLK. Measuring the automatic components of prejudice: Flexibility and generality of the Implicit Association Test. Social Cognition. 1999;17:437–465. [Google Scholar]
- Rydell RJ, McConnell AR. Understanding implicit and explicit attitude change: A systems of reasoning analysis. Journal of Personality and Social Psychology. 2006;91:995–1008. doi: 10.1037/0022-3514.91.6.995. [DOI] [PubMed] [Google Scholar]
- Smith CT, Nosek BA. Affective focus increases the concordance between implicit and explicit attitudes. Social Psychology. 2011;42:300–313. [Google Scholar]
- Strack F, Deutsch R. Reflective and impulsive determinants of social behavior. Personality and Social Psychology Review. 2004;8:220–247. doi: 10.1207/s15327957pspr0803_1. [DOI] [PubMed] [Google Scholar]
- Spalding LR, Hardin CD. Unconscious unease and self-handicapping: Behavioral consequences of individual differences in implicit and explicit self-esteem. Psychological Science. 1999;10:535–539. [Google Scholar]
- Tesser A. Self-generated attitude change. In: Berkowitz L, editor. Advances in experimental social psychology. Vol. 11. Academic; 1978. pp. 289–338. [Google Scholar]
- The Economist. JF You may not think what you think you think. The Economist. 2012 Feb 22; Retrieved May 2, 2012 from http://www.economist.com/node/21548123.
- Tierney J. In bias test, shades of gray. The New York Times. 2008a Nov 17; Retrieved May 2nd, 2012, from http://www.nytimes.com/2008/11/18/science/18tier.html.
- Tierney J. A shocking test of bias. The New York Times. 2008b Nov 18; Retrieved May 2nd, 2012 from http://tierneylab.blogs.nytimes.com/2008/11/18/a-shocking-test-of-bias/
- Tourangeau R, Rasinski KA. Cognitive processes underlying context effects in attitude measurement. Psychological Bulletin. 1988;103:299–314. [Google Scholar]
- Uhlmann EL, Nosek BA. My culture made me do it: Lay theories of responsibility for automatic prejudice. Social Psychology. 2012;43:108–113. [Google Scholar]
- Uhlmann EL, Poehlman TA, Nosek BA. Automatic associations: Personal attitudes or cultural knowledge? In: Hanson J, editor. Ideology, Psychology, and Law. Oxford, UK: Oxford University Press; 2012. pp. 228–260. [Google Scholar]
- Van den Bergh L, Denessen E, Hornstra L, Voeten M, Holland RW. The implicit prejudiced attitudes of teachers: Relations to teacher expectations and the ethnic achievement gap. American Educational Research Journal. 2010;47(2):497–527. [Google Scholar]
- Wilson TD, Dunn DS, Bybee JA, Hyman DB, Rotondo JA. Effects of analyzing reasons on attitude-behavior consistency. Journal of Personality and Social Psychology. 1984;47:5–16. [Google Scholar]
- Wilson TD, Dunn DS, Kraft D, Lisle DJ. Attitude change, and attitude-behavior consistency: The disruptive effects of explaining why we feel the way we do. In: Berkowitz L, editor. Advances in experimental social psychology. Vol. 22. Orlando, FL: Academic Press; 1989. pp. 287–343. [Google Scholar]
- Wilson TD, Lindsey S, Schooler TY. A model of dual attitudes. Psychological Review. 2000;107:101–126. doi: 10.1037/0033-295x.107.1.101. [DOI] [PubMed] [Google Scholar]
- Wittenbrink B, Schwarz N. Implicit measures of attitudes. New York, NY, US: Guilford Press; 2007. [Google Scholar]