

A deeper understanding of the mechanisms of tumor cell extravasation is essential in creating therapies that target this crucial step in cancer metastasis. Here, we use a microfluidic platform to study tumor cell extravasation from in vitro microvascular networks formed via vasculogenesis. We demonstrate tight endothelial cell-cell junctions, basement membrane deposition and physiological values of vessel permeability. Employing our assay, we demonstrate impaired endothelial barrier function and increased extravasation efficiency with inflammatory cytokine stimulation, as well as positive correlations between the metastatic potentials of MDA-MB-231, HT-1080 and MCF-10A and their extravasation capabilities. High-resolution time-lapse microscopy reveals the highly dynamic nature of extravasation events, beginning with thin tumor cell protrusions across the endothelium followed by extrusion of the remainder of the cell body through the formation of small (~1 μm) openings in the endothelial barrier which grows in size (~8μm) to allow for nuclear transmigration. No disruption to endothelial cell-cell junctions is discernible at 60X, or by changes in local barrier function after completion of transmigration. Tumor transendothelial migration efficiency is significantly higher in trapped cells compared to non-trapped adhered cells, and in cell clusters versus single tumor cells.
Introduction
Cancer cells disseminate in the body by undergoing several steps, including the invasion of surrounding tissues, intravasation into the blood vessel, transport in the circulation, extravasation from the vasculature and proliferation at a secondary site. Extravasation involves a cascade of events consisting of (1) tumor cell arrest on the endothelium resulting in the formation of dynamic contacts that give rise to significant cytoskeletal changes, and (2) tumor cell transendothelial migration (TEM) and subsequent invasion into the surrounding matrix1. Although the mechanisms of intravasation have been widely studied, the precise cellular interactions and molecular alterations associated with extravasation are poorly understood. In fact, most data are gathered from low-resolution in vivo studies and endpoint assays that indirectly observe tumor cells via quantification of secondary tumor formation in existing animal models 2–6. As such, direct observation of tumor cell arrest on and subsequent migration across an endothelium in a precisely controlled and physiologically relevant microenvironment would provide important insight into extravasation mechanisms.
Currently, in vitro models such as the Boyden chamber-Transwell assays provide a relatively simple and high throughput method for parametric cell migration studies 7, 8, yet do not allow monitoring of the entire process of extravasation and are limited in their physiological relevance. Conversely, in vivo models of extravasation such as rat-tail vein injection of tumor cells 9 mostly do not allow for high-resolution visualization of extravasation events. More recently, intravital microscopy performed on optically transparent transgenic zebrafish has enabled high spatial and temporal resolution imaging 5; however, as with most in vivo platforms, the ability to perform parametric studies is restricted. Recently, microfluidic technologies have been developed to enable high resolution and dynamic study of both tumor cell intravasation and extravasation10–14. In the latter, devices consist of microchannels connected by 3D ECM hydrogels, where tumor cells are seeded in one channel, arrest onto and extravasate across an endothelial cell (EC) monolayer and into a hydrogel14. However, the use of polydimethylsiloxane (PDMS) posts to contain the gel often prevents the formation of a continuous, low-permeable EC monolayer. It is also difficult to predict how changes in stiffness between the PDMS and gel affect extravasation mechanisms. Furthermore, most studies of extravasation or TEM across planar EC monolayers 12, 13, 15, 16 are limited in their physiological relevance.
3D microvascular networks (μVNs) have been widely explored in vitro and are particularly amenable to the study of vascular biology and modeling of disease in a more physiologically relevant configuration than endothelial lined tubes or monolayers. μVNs can be formed from self-organized, physiologically relevant vascularization processes, including sprouting angiogenesis and vasculogenesis. Recently, several groups have developed microfluidic platforms capable of generating perfusable 3D μVNs 17–19. While no in vitro system can fully recapitulate the complexity of an in vivo situation, such vasculature have the potential to more closely model the in vivo tumor cell extravasation environment.
Here, we present a microfluidic platform for the modeling of the entire process of extravasation from within in vitro μVNs assembled via vasculogenesis. Our platform offers key advantages over existing in vitro extravasation models by enabling all of the following: (1) high temporal and spatial resolution of extravasation events, (2) the ability to perform parametric studies in a tightly controlled and high throughput microenvironment and (3) increased physiological relevance compared to 2D and 3D planar monolayer models. We employ our model to demonstrate the effect of inflammatory cytokine stimulation on endothelial barrier function and TEM efficiency, and the positive correlation between metastatic potentials of different tumor cell lines and their extravasation capabilities. We demonstrate high spatiotemporal visualization of the sequential steps of extravasation from in vitro μVNs, and observe the TEM patterns of different tumor cell subpopulations including mechanically entrapped cells, single arrested tumor cells and cell clusters. Findings from our platform result in a deeper understanding of tumor cell extravasation mechanisms and demonstrate our assay’s potential to be employed for the discovery of factors that could inhibit this crucial step in metastasis.
Materials and Methods
Microvascular network formation
Microfluidic devices were fabricated via standard soft lithography as described previously 10. Fibrinogen solution was prepared by reconstituting 5 mg/mL or 10 mg/mL of bovine fibrinogen (Sigma, MO) in PBS and dissolving the mixture in a 37°C water bath for 2 h. The solution was then filtered using a 0.2 μm filter and stored at 4°C. Human umbilical vein endothelial cells (HUVECs) (Lonza, MA) were cultured in supplemented endothelial growth medium (EGM-2, Lonza) and grown to passage 5 before they were trypsinized and resuspended at a concentration of 8 million cells/mL in a solution of EGM with 0.15U/mL GM-6001 (PeproTech, NJ) and thrombin (0.5 U/mL, Sigma). The cell suspension was then mixed in a 1:1 ratio with 20 μL of 5mg/mL fibrinogen to achieve a final concentration of 4 million cells/mL and immediately injected into the HUVEC gel channel. Normal lung fibroblasts (NHLFs) (Lonza, MA) cultured in supplemented FGM (Sigma, MO) until passage 5 were similarly dissociated and suspended with the 10 mg/mL fibrinogen solution to reach a final cell density of 9 million cells/mL, and was injected into the NHLF channel. Devices were placed in a humidity box at room temperature and gels were allowed to cure for 20 minutes before filling the media channels with supplemented EGM. Media was replenished every 24 h for the duration of the culture. All cells were maintained in a humidified incubator at 37°C and 5% CO2.
Tumor cell seeding in μVNs
MDA-MB-231, HT-1080 (from Dr. Frank Gertler, MIT) cultured in DMEM (Sigma, MO) supplemented with 10% FBS and 1% Pen-Strep (Invitrogen, CA), and MCF-10A cells (from the Brugge Lab, cultured as described previously 20) were trypsinized and resuspended at a final concentration of 0.4 M cells/mL in EGM. Media from the reservoirs of the two channels flanking the HUVEC channel were aspirated and 40 μL of the tumor cell suspension was introduced into one of the reservoirs of the central media channel. This creates a pressure drop of 5.2 mmH2O across the vascular network, drawing the tumor cells into the vasculature. Devices were placed in an incubator immediately after seeding and left to equilibrate for 30 min, after which devices were washed by applying fresh media via a pressure drop in the same direction as the tumor cell seeding to remove any non-adherent cells.
Quantification of vessel permeability
The method used to quantify vessel permeability was based on that described previously55. Briefly, background fluorescence images of the vascular network were obtained (Ib). The media in all reservoirs were aspirated and the three reservoirs on one side were injected with 45 μL of 10 μM 70 kDa MW Texas red dextran solution (Invitrogen, CA) simultaneously. Devices were placed in an incubator for 20 min, and then transferred to the microscope environmental chamber for another 10 min, to account for time required for dextran diffusion into the vessels and recovery from agitation during transfer. Once equilibrium was established (i.e. intensity inside the vessels remained constant), fluorescent images were captured every 5 min for 60 min. The permeability coefficient was calculated by obtaining the average intensity in a measuring window containing both the vessel segment and surrounding gel, at the initial and final time points. Individual sections of the vessel network of length ~80 μm each (2 sections/ROI, 4 ROI/device, n=3) were selected for analysis. The length of each section varied slightly, in order to capture a segment that was relatively uniform in diameter. Care was taken to select vessel segments in the central region of the channel, which was far enough from the media-gel boundary. Permeability coefficients were computed as:
where Ii, If and Ib are the initial, final and background average intensities, Δt is the time between the two captured images, and d is the average diameter of the vessel segment. All imaging was performed using a confocal microscope (Olympus, Japan).
Immunofluorescent and live staining
To quantify extravasation events, HUVECs were fixed and stained with rhodamine phalloidin (Alexa Fluor 568, Invitrogen) at the final time point to visualize the position of the tumor cell relative to the endothelial barrier. For live tracking of extravasation events, a plasma membrane cell tracker was used (Cell Mask Deep Red Stain, Invitrogen) on HUVECs via incubation at 5μg/mL for 30 min. Cell viability assays were performed using a Live/dead cytotoxicity kit (Invitrogen) containing SYTO 10 (2 μM) and ethidium homodimer (4 μM), and following the manufacturer’s instructions.
To verify the presence of tight cell-cell junctions, rabbit monoclonal primary antibody for human VE cadherin (Abcam, MA) and secondary antibodies (Alexa Fluor 568, Invitrogen) were used. To verify the presence of basement membrane deposition, mouse monoclonal antibody for human collagen IV (Abcam) was used, followed by a secondary antibody (Alexa Fluor, 488, Invitrogen). Devices were washed once with PBS, fixed with 4% (w/v) paraformaldehyde in PBS for 20 min and permeabilized with 0.1% Triton X-100 (Sigma) for 10 min. Samples were blocked with 5% BSA (Sigma) and 2% goat serum (Sigma) for 2 h at room temperature, and incubated with primary antibodies for 24 h at 4° (VE-cadherin, 1:100; Collagen IV, 1:100). This was followed by washing and incubation with secondary antibodies (1:200) at room temperature for 3 h. Devices were then counterstained with rhodamine phalloidin for actin (1:200) and DAPI for nuclei (1:1000, Invitrogen). All images were obtained via confocal microscopy and processed using the IMARIS imaging software.
Quantification of extravasation
Using the IMARIS imaging software, the nuclei of each tumor cell in an ROI was identified and marked using the IMARIS Spot tracker function. Only cells with nuclei found on the basal side of the endothelial barrier (either directly adjacent to or migrated away from the barrier) were counted as an extravasation event. ROIs were selected such that the edge effects at the boundary between the gel and media channel were avoided, as such areas may contain cells that have migrated into the gel from the outside media channel. As a further precaution, time-lapse confocal microscopy was performed for each device for the entire duration of the culture period, to ensure that cells migrated from media channel were not considered in the final calculation. We calculated the extravasation efficiency as the ratio of extravasated cells to the total number of cells found inside the microvasculature by analyzing a minimum of 6 ROI per device, which are selected randomly out of 30 total ROI per device. The dimensions of each ROI were 750 μm by 750 μm by 300 μm (height).
For the quantification of extravasation efficiency of different subpopulations, tumor cells whose diameter was larger than the segment of vessel immediately downstream was categorized as entrapped, while all other cells that remained after washing with medium were considered to be part of the adhered non-trapped population. The extravasation efficiency of each subpopulation was defined as the ratio of the number of extravasated cells to the total number of cells classified in the subpopulation. Likewise, clusters were defined as a group of 2 or more tumor cells in direct contact with one another, while single cells were those not in contact with any other tumor cell. In these experiments, extravasation events were analyzed via live fluorescent-bright field overlay images. The location of the vessel wall was determined by live images taken at 0 hr. Extravasated cells were identified as those with a spread morphology and protrusions past the vessel wall into the matrix, and non extravasated cells were identified as generally rounded cells within the vessel.
TNF-α stimulation of HUVECs
For cytokine stimulation experiments, HUVECs were stimulated with 2, 5 or 10 ng/mL of TNF-α (R&D systems, MI), at 96 h after endothelial seeding, for 12 h. To ensure that the results observed were not due to the direct modulation of TNF-α on tumor cell migration, devices were washed and incubated in normal media for 30 min prior to tumor cell seeding.
Statistical Analysis
The values reported correspond to an average value over a minimum of 3 independent experiments, with 3 devices per experimental condition and a minimum of 6 ROI per device. Data are presented as mean ± SD. Comparisons were performed using one-way ANOVA with pairwise comparisons by the Tukey test. Statistical significance is taken as *p<0.05. All statistical analyses were done via SigmaStat 3.5 (Systat Software Inc., IL).
Results
Formation and characterization of in vitro μVNs in microfluidic devices
In order to model a physiologically relevant tumor cell extravasation microenvironment, we employ a microfluidic platform 13, 18 to develop stable, functional and perfusable in vitro μVNs via vasculogenesis. We use a two gel-channel device to allow the co-culture of HUVECs and NHLFs in a 3D ECM hydrogel (Fig. 1a–b). This spatial patterning of both HUVECs and stromal cells allows diffusion-dependent, non-juxtracrine, and paracrine cell-cell interactions that give rise to more natural blood vessels, compared with HUVEC monoculture 17, 18. Single HUVECs begin to spread and organize into tubule-like structures within the gel by day 2, and by day 4, μVNs with lumens ranging from 8 to 96 μm in diameter are formed. Lumens communicate with the two flanking media channels, allowing vessel perfusion. Vessels are relatively quiescent, with individual vessel diameters increasing by 5.1±4.7% from days 4 to 5, and 5.7±5.4% from days 5 to 6 (Fig. S1a). Similarly, the normalized number of vessel branches exhibited no statistically significant changes (Fig. S1b), indicating minimal EC remodeling and apoptosis.
Figure 1. Characterization of microfluidic microvascular network platform.

(A) A schematic of the microfluidic device and cell-seeding configuration. Suspended HUVECs form microvascular networks in a gel matrix communicating with NHLFs in a paracrine fashion across the central media channel through the inter-post regions. Micro-posts (black) allow for surface tension-assisted gel filling via ports at the ends of each gel region. Medium is replenished every 24 hours via hydrostatic pressure applied between the media reservoirs on each end of the media channels. (B) Photograph of 2-gel region microfluidic device. (C) Visualization of VE-cadherin (red) at 60X reveals continuous cell-cell junctions. (D) Collagen IV basement membrane deposition (green) around the lumen (red) and in the perivascular space suggests vessel maturation. (E) Perfusion of vessels with 70 kDa dextran reveals patent lumens void of local leaks. Scale bars are 20 μm.
To confirm the integrity of the endothelial barrier, staining of the networks at 96 h with anti-VE-cadherin showed the presence of continuous cell-cell junctions spanning the entire circumference of the lumen (Fig. 1c). We further detected the presence of collagen IV in the perivascular extracellular matrix, a sign of vessel maturation and stabilization (Fig. 1d). Perfusion of the vasculature with 70 kDa dextran revealed patent lumens that were void of local leaks (Fig. 1e) and exhibited a diffusive permeability of (8.92±1.47) ×10−7 cm/s (n=24 vessel segments over 3 devices) at 96 h after HUVEC seeding.
Extravasation in μVNs
Cells were seeded at a density low enough to prevent clogging of the lumen openings and be reflective of the low cell density in vivo 21, yet high enough to observe at least one extravasation event per region of interest (ROI). After varying tumor seeding densities (Fig. S2a), we selected 0.4 million MDA-MB-231 cells/mL, which produced an average of 21.2 ±8.7 tumor cells per ROI (24 ROIs over 3 devices) (Fig. 2a). This corresponds to an estimated 0.63 million cells/mL of vascular volume.
Figure 2. Visualization of MDA-MB-231 extravasation events.

(A) A region of interest 30 minutes after seeding MDA-MB-231 (green) at 0.4 M cells/mL in live RFP-labeled μVN (red). Scale bar is 200 μm. (B) The various positions of tumor cells (green) relative to the endothelial barrier (red) that can be found during a 24-hour culture period, imaged in fixed samples. These include cells that are (i) spread but contained within the lumen, (ii) transmigrated and spread on the outside of the lumen, (iii) circular with protrusions penetrating the HUVEC barrier and contacting the matrix, (iv) transmigrated away from the lumen, (v) circular and adhered within the lumen, and (vi) circular and trapped in vessels with diameters smaller than that of the cell. (C) Extravasation rates of MDA-231 in HUVEC vessels over 48 hours (9 total devices over 3 independent experiments). Data is represented as mean ± SD. Statistical significance was tested with one-way ANOVA (*p<0.05). Scale bars are 20 μm.
Tumor cells were seeded into the vascular network via the application of a 5.2 mm H2O pressure drop across the HUVEC channel, 96 h after HUVEC seeding (SI Video 1). This corresponds to estimated shear stress values in the range of 0.012 to 0.48 Pa during cell seeding, comparable to the range of wall shear stresses found in venular microvessels, (< 1 Pa) 22. Fixed sample images of seeded MDA-MB-231 revealed their possible locations and morphologies throughout a 4-hour observation period (Fig. 2b). These include cells that are (i) spread but contained within the lumen, (ii) transmigrated and spread on the outside of the lumen, (iii) circular with protrusions penetrating the HUVEC barrier and contacting the matrix, (iv) transmigrated away from the lumen, (v) circular and adhered within the lumen, and (vi) circular and trapped in vessels with diameters smaller than that of the cell.
In untreated HUVECS, we quantified an MDA-MB-231 extravasation efficiency of 12.3±3.4% after 6 h and 23.6±4.5% after 24 h (Fig. 2c, Fig. S2b, SI Video 2). Extravasation could be observed as early as 30 min after tumor cell introduction into the vasculature, while the number of extravasated cells plateaued at around 24 h, with no significant difference in the number of extravasated cells at 48 h (p=0.298). The average number of tumor cells found in each ROI exhibited a slight yet insignificant (p=0.37) increase between 0 h and 24 h (Fig. S2c). These results suggest that most extravasation events occur in the first 24 h, which is similar to the time scales witnessed in vivo 9, 23 and in other in vitro platforms 13. Cell viability was 95.2±3.7% at 24 h, suggesting that the adhered yet non-migratory and/or circular cells were likely not due to tumor cell apoptosis. Lastly, 10 μm fluorescent beads introduced into the vasculature were lodged but never extravasated, confirming that extravasation from within the vessels is not a passive process inherent to the platform.
Endothelial barrier function and TEM efficiency is sensitive to TNF-α
Inflammation can play a mediating role in cancer progression and metastasis 24–26. For instance, elevated levels of pro-inflammatory cytokines including IL-1B, TNF-α and IL-6 have been found in the circulation of cancer patients, and may upregulate the expression of adhesion molecules on the endothelium or in target organs 25. Here, we investigated the response endothelial barrier function and tumor cell TEM rates to TNF-α. Treatment of μVNs with 2 ng/mL TNF-α for 12 h resulted in a 2.1-fold increase in HUVEC permeability ((18.4 ± 1.1) ×10−7 cm/s compared to (8.68 ± 0.6) ×10−7 cm/s) to 70 kDa dextran, with no significant difference in cell viability (Fig. 3a). Stimulation with 10 ng/mL TNF-α led to a 4.6-fold increase in permeability ((41.5 ± 7.21) ×10−7 cm/s). The high standard deviation in the 10 ng/mL treatment was investigated; upon closer inspection, we observed what appeared to be focal leaks, and cell viability was found to be significantly lower compared to the control, indicating that such a high concentration of TNF-α led to endothelial cell-death induced ruptures in the lumen (Fig. 3b). Consistent with this, in TNF-α stimulated (2 ng/mL) HUVECs, tumor cell TEM rates increased 2.3-fold (32.3±5.1% compared to 13.1±2.12%) (Fig. 3c). These increases in both TEM rate and endothelial permeability to TNF-α stimulation suggest that impaired endothelial function may regulate transendothelial migration.
Figure 3. The effect of TNF-α on barrier function and TEM and the correlation of metastatic potential and TEM capabilities.

(A) Graded response of vessel permeability to TNF-α perturbation. (B) High concentrations of TNF-α (10 ng/mL) results in cell-death induced ruptures and focal leaks (red arrow) seen by 70 kDa dextran (white). (C) Effect of TNF-α stimulation on TEM efficiency of MDA-MB-321. (D) Extravasation rates of cell lines with different metastatic potentials (MDA-MB-231, HT-1080 and MCF-10A). Data is represented as mean ± SD, with 9 total devices over 3 experiments for each condition. Statistical significance was tested with one-way ANOVA and Tukey’s Test (*p<0.05). Scale bars are 20 μm.
Tumor cell metastatic potential correlates with extravasation capabilities
We investigated the dependency of tumor cell extravasation efficiency on their corresponding metastatic potential. In untreated HUVECs, highly invasive HT-1080 fibrosarcoma cells were found to exhibit a 27.34±4.9% extravasation efficiency, which was significantly different from the 13.23±3.2% extravasation rate for MDA-MB-231, 4 h after tumor cell seeding (Fig. 3d). Furthermore, the non-metastatic normal epithelial cell line MCF-10A exhibited a 5.31±2.3% extravasation rate. These results indicate that human tumor cells exhibiting different metastatic potentials exit the vascular system with different efficiencies and that our platform possesses the sensitivity to detect such variations.
Visualization of dynamics of extravasation events
Time-lapse confocal microscopy of TC-EC interactions can offer important insights into the temporal and spatial mechanisms of tumor cell extravasation. Analysis of a sequence of images of a transmigrating MDA-MB-231 cell (Fig. 4a) revealed that (1) transmigrating tumor cells first penetrate the EC barrier by extending thin fillipodial protrusions (<1μm in width) into the subendothelial matrix, (2) protrusions continue to increase and branch out while the remaining body on the apical side of the lumen maintains its sphericity (3), the spherical body decreases in diameter as more of the cell and the nucleus clears the barrier (4), the tumor cell undergoes significant shape changes as it adopts a final spread morphology upon exiting the lumen.
Figure 4. Visualization of extravasation dynamics.

(A) High resolution time-lapse confocal microscopy (40X) of an extravasating entrapped MDA-MB-231 (green). Lumens were labeled with a far-red plasma membrane stain (purple). Tumor cells transmigrate through the endothelium and into the 3D matrix over a period of 4 h. The white arrow at 3:30 h indicates the location of a vessel opening at the site of tumor cell TEM. (B) Confocal images taken at a single slice shows a small gap ~1–2 μm forming in the EC barrier at the initial stages of TEM. (C) Gaps in the EC plasma membrane grow in size (~8–10μm) to allow TEM of the nucleus. (D) A circular is hole is seen in the vessel lumen at the location and instant of tumor cell nuclear TEM. (E) EC membrane gaps diminish in size and (F) eventually become indiscernible after complete TEM. (G) Staining of VE-cadherin (red) after tumor cell (green) extravasation in fixed samples. Images of VE-cadherin and two tumor cells (H) merged and (I) unmerged reveal no apparent disruptions in EC junctional staining after complete TEM. (J) MDA-MB-231 extravasates through a small gap in the EC barrier, as seen by a thin segment of the cell joining the apical/basal portions of the tumor cell (red arrow). All scales bars are 10 μm.
Live time-lapse microscopy at 40X did not reveal a discernable gap in the endothelial plasma membrane at the site of transmigration, suggesting that the area through which tumor cell protrusions penetrate is relatively small, and likely paracellular rather than transcellular. A definitive opening in the barrier was only observed near the end of the extravasation event (i.e. at 3:30 h, Fig. 4a), which was presumably larger to allow the transmigration of the nucleus. This was confirmed via higher resolution imaging at 60X, which revealed small gaps (~1–2 μm) in the endothelial barrier during the initial stages of transmigration (Fig. 4b). Gaps then gradually increased in size to form holes ~8–10 μm in diameter upon the transmigration of the tumor cell nuclei (Fig. 4c–d). The remaining portion of the cell body on the apical side remains spherical, even after transmigration of the nucleus, suggesting that the sphericity is not due to that of the nucleus. Furthermore, live nuclear staining at 40X reveals that transmigration of the nucleus occurs within a relatively short time frame (~15 min) compared to the total time required for complete tumor cell TEM (Fig. 5). Microscopy at 90X revealed a thin segment of the tumor cell joining the two parts of the cell body on each side of the lumen, suggesting that TEM of most of the cell body occurs via extrusion through a gap of sub nuclear dimensions (Fig. 4j). After transmigration of the tumor cell nucleus, gaps in the EC barrier decreases in size and eventually becomes indiscernible after complete TEM (Fig. 4e–f).
Figure 5. Dynamics of nuclear TEM.
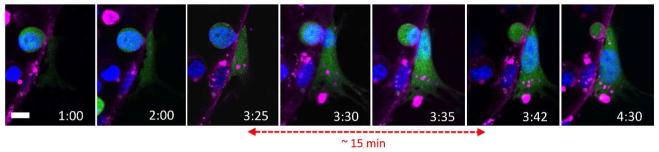
Time-lapse confocal microscopy at 40X reveals the dynamic nature of the transmigration of the tumor cell nucleus (blue). Transmigration of the nucleus occurs within a relatively short time frame (~15 min) compared the total time required for complete cell TEM (~4 h).
Interestingly, staining of VE-cadherin in samples fixed at different time points throughout extravasation events revealed largely intact cell-cell junctions as discerned by confocal microscopy at 60X. Images of MDA-MB-231 sending out protrusions through the EC barrier before the transmigration of the nucleus revealed localization of the tumor cell protrusions at EC cell-cell junctions (Fig. S3a). Notably, ECs adjacent to tumor cells that had undergone nuclear (Fig. S3b) and complete (Fig. 4g–i) transmigration also showed no discernable signs of junction disruption. Importantly, perfusion of the live vessels with 70 kDa dextran revealed no apparent leaks at the sites of complete TEM (Fig. S3c).
Different tumor cell subpopulations exhibit different TEM capabilities
We are able to observe arrested cells on the endothelium that are either mechanically trapped, or adhered and non-trapped. Non-trapped cells remained adhered onto the luminal side of the endothelium in vessels with diameters larger than that of the tumor cell, even after vessel perfusion (Fig. 6a). This suggests the presence of purely adhesive interactions with the endothelium in contrast to cells lodged mechanically in narrow constrictions (Fig. 6b), which composed an average of 16.2 ± 12.3% of the total number of tumor cells found in each ROI. Analysis of each subpopulation revealed that trapped cells exhibited a significantly higher rate of TEM (47.8±4.67%) compared to arrested non-trapped cells (9.8±3.3%) (Fig. 6d).
Figure 6. TEM efficiencies of different tumor cell subpopulations.

(A) Non-trapped adhered tumor cell at 30 min and 4 h after seeding. (B) Entrapped tumor cell at 30 min and 4 h after seeding. (C) Tumor cell cluster (>2 adjacent cells) at 30 min and 4 h after seeding. (D) TEM efficiency of adhered non-trapped and trapped subpopulations. (E) TEM efficiency of single cell and collective cells. Data are represented as mean ± SD, with 9 total devices over 3 independent experiments for each condition. Statistical significance was tested with one-way ANOVA and Tukey’s Test (*p<0.001). All scale bars are 20 μm.
Furthermore, we visualized TEM events of both single adhered tumor cells and tumor cell clusters, which is defined as a group of more than 2 contacting cells (Fig. 6c). Cells classified in the cluster population exhibited a TEM rate of 67.8±7.2% while single cells exhibited a significantly lower rate of 8.3±2.6% (Fig. 6e).
Discussion
Our extravasation platform features the advantages of microfluidic technology, including tight control of tumor microenvironment factors and high spatiotemporal resolution, combined with the increased physiological relevance of self-organized 3D μVNs. Vessel permeability values found were comparable to that of in vivo venules 27 and similar to existing in vitro μVN platforms produced via angiogenic sprouting 18 suggesting a strong and more physiologically relevant barrier compared to those reported in in vitro EC monolayers 13, 14, 28, 29. Moreover, the relative quiescence of these microvessels allows us to justify the decoupling of vessel remodeling and extravasation occurring within the time frame in which the events are studied. Together, these results confirm that TEM in our platform is an active process of endothelial barrier penetration by the invading tumor cell.
Although progress has been made in identifying critical regulators of endothelial-tumor interactions in the context of intravasation 30–32, it remains unclear whether impaired barrier function is a necessary precursor to TEM in extravasation. Here, the increased TEM efficiency and endothelial permeability observed in response to TNF-α stimulation corroborates the findings of our previous work involving increased intravasation rates of HT-1080 cells across TNF-α activated HUVEC monolayers 14. The positive correlations observed between extravasation rates and vessel permeability have also been observed in in vivo rat tail-vein 9 and transparent zebrafish 5 models subject to VEGF overexpressing tumor cells, which induced endothelial barrier disruption. Although not explored in this study, in addition to promoting vascular leak, TNF-α is known to upregulate cell surface adhesion molecule expression on endothelial monolayers 33 and promotes tumor cell adhesion to endothelial cells 33, 34. It is well accepted that leukocyte adhesion, and more recently, tumor cell adhesion to the endothelium is a precursor to TEM 16, 35, 36.
Although the metastatic potentials of different tumor cell lines are well characterized in various in vivo models 37–39, the dependence of extravasation efficiency on metastatic abilities remains unclear. Koop et al demonstrated similar extravasation kinetics of highly metastatic PAP2, non-metastatic NIH3T3 and primary fibroblast cells from mouse embryos, suggesting that extravasation is independent of metastatic potential in chick CAM models 40. Contrarily, Stoletov et al showed a clear positive correlation between the metastatic potentials of different tumor cell lines and their extravasation abilities (HT1080>MDA-MB-231>MDA-MB-435) in an in vivo zebrafish model 5. Interestingly, the results obtained from our platform corroborate those observed in the zebrafish model, with HT1080 exhibiting a higher extravasation rate than MDA-MB-231. MCF-10A is a non-tumorigenic cell line often used as a control condition in TEM assays. Here, they exhibit a significantly decreased tendency to extravasate compared to metastatic cells lines. The basal level of extravasation present (~5%) is likely dependent on the level of robustness of the endothelial barrier in the in vitro platform, and is consistent with the basal levels of MCF-10A extravasation observed in in vitro 2D transwell assays41. These results indicate tumor cell extravasation correlates with metastatic potential, and that our platform possesses the sensitivity to detect such differences in invasiveness.
Visualization of the cellular mechanisms of extravasation in mouse and chick chorioallantoic membrane assays have established the existence of complex tumor-endothelial interactions that may involve passive or active tumor cell movement, adhesion and transmigration; however, the precise mechanisms at the single cell level are poorly characterized 2, 42–44. Understanding these mechanisms are important because metastasis is inherently a mechanical transport phenomenon characterized by the release of single cells from a primary tumor, which invade through small pores of the tissue matrix, extravasate across EC barriers, and circulate in the vasculature. The effects of tumor cell extravasation on the structure and viability of the endothelium have also been studied, although the precise nature of these events remains unclear 16, 32. Using our assay, we demonstrate, for the first time, the dynamic EC-TC interactions during TEM in high spatiotemporal resolution from within in vitro microfluidic μVNs. The portion of the tumor cell body on the apical side of the lumen was found to retain its sphericity, while extending fillipodial protrusions into the matrix through a small gap in the endothelial barrier through which the rest of the cell body extrudes. This gap gradually increases in size from ~ 1 μ to 8 μ as the tumor cell nucleus transmigrates. Cells then finally achieve spread morphology upon transit of the entire cell body through the vascular wall and gaps in the EC barrier are repaired. Furthermore, via immunofluorescent visualization of VE-cadherin, we hypothesize that any disruption to endothelial junctions associated with TEM may be (1) only transient, (2) indiscernible by high magnification confocal imaging at 60X, (3) small enough to allow continued local barrier function against 70 kDa dextran, or (4) non-existent due to transcellular instead of paracellular TEM. The ability of tumor cells to migrate past narrow constrictions was recently demonstrated via the transit of MDA-MB-231 through mechanical confinements of sub nuclear dimensions by undergoing significant cell elongation and nuclear deformations 45. Furthermore, the observed TEM mechanism resembles paracellular leukocyte diapedisis, where cells penetrate the endothelial junction by insertion of microvilli-like projections and migrate between ECs by squeezing through a narrow channel of sub nuclear dimensions while maintaining extensive membrane contact, and imposing only a small transient disruption to the endothelial junction 46–48. Lastly, comparison with intravasation events in a planar EC monolayer platform 14 leads to a hypothesis regarding the mechanistic differences between two processes. In the intravasation assay, traction forces are likely only generated at the leading edge of the migrating cell and may be limited to the 2D apical and basal surfaces of the contacting endothelium. In contrast, extravasating cells are likely to adhere to the 3D subendothelial matrix by extending extensive protrusions and generate traction forces via the matrix, possibly allowing them to pull their body past the endothelial barrier.
Currently, two theories exist regarding the mechanisms of cell arrest on the vessel wall. Paget’s “seed and soil” hypothesis describes the selective adherence of tumor cells to the endothelium prior to TEM 49. In another mode, tumor cells can become physically trapped in small vessels due to their size and eventually become activated and transmigrate 50–52. However, current experimental data using various types of assays reveal contradictory results regarding the specificity of the initial interactions between the endothelium and circulating tumor cells. Using our platform, we observe a subpopulation of physically occluded tumor cells within the μVNs, which exhibited a markedly higher TEM rate than adhered nontrapped cells. This may be attributed to the fact that lodged cells have access to more adhesion sites on the endothelium, as the area of TC-EC contact is greater. In future studies, the perfusability of our μVNs will enable us to elucidate the mechanisms of tumor cell extravasation under dynamic conditions, including the mechanisms of cell rolling and adhesion under continuous flow.
Similarly, our platform enables the observation of tumor clusters, which exhibited a significantly higher TEM efficiency compared to single adhered cells. The increased TEM rate of clusters may be attributed to several mechanisms including (1) an increase in the local concentration of tumor-secreted biochemical factors that regulate endothelial permeability, (2) access to the subendothelial matrix provided by a previously transmigrated cell, and (3) the inability to repair the endothelial damage before the transmigration of another tumor cell in the cluster. In particular, tumor paracrine factors can contribute to increased TEM efficiency via the modulation of endothelial permeability, such as impairment of the endothelial barrier function by tumor secreted VEGF 53, 54. As such, tumor cell clusters may induce a higher localized concentration of permeability enhancing paracrine factors. Furthermore, studies have revealed the irreversibility of endothelial barrier damage after transmigration of tumor spheroids 16 compared to the reversibility after single cell transmigration 5, indicating that there may exist differences in single and collective cell behavior. As such, the increased TEM efficiency of cell clusters may be attributed to an irreversibly damaged endothelium, induced by the loss of ECM contacts, endothelial retraction and apoptosis.
Conclusions
We have presented a microfluidic extravasation assay consisting of self-organized perfusable 3D vasculature that allows for the study of tumor extravasation from within in vitro μVNs. We demonstrate the effect of inflammatory cytokine stimulation on endothelial barrier function and TEM efficiency, and the positive correlation between metastatic potentials of different cell lines and their extravasation capabilities. We characterize, for the first time, the mechanisms of tumor cell extravasation dynamics in high spatiotemporal resolution from within in vitro μVNs and observe the TEM patterns of different tumor cell subpopulations, including mechanically trapped tumor cells, single adhered cells and tumor clusters. Our ability to enable high-throughput parametric studies in a tightly controlled environment coupled with increased physiological relevance compared to 2D and 3D planar monolayer models will give rise to new insights regarding the complex endothelial-tumor cell interactions in extravasation and facilitate the identification of factors to target this crucial step in cancer metastasis.
Supplementary Material
Figure S1. Formation of microvascular networks in microfluidic devices. (A) Change in individual vessel diameters (n=40 vessels) during time frame of extravasation experiments (days 4 to 6). (B) Changes in total vessel branches normalized by the total number of cells over time (6 ROI/device, 3 devices). Data are presented as mean ±SD, with *p<0.05.
Figure S2. Extravasation in μVNs. (A) Tumor cell seeding density versus the number of tumor cells found per ROI (n=18 ROI over 3 devices). (B) Example of the distribution of the number of extravasated cells in different ROIs in a single device. (C) No significant increase in the number of tumor cells from 0 to 24 h is found. Data are presented as mean ±SD, with *p<0.05.
Figure S3. VE-cadherin staining at extravasation sites. (A) An MDA-MB-231 cell that has extended protrusions into the subendothelial matrix, before transmigration of the nucleus. Tumor cell (green) protrusions appear localized at EC cell-cell junctions (red). (B) Tumor cell in mid-TEM, after transmigration of the nucleus. Unmerged and merged images of VE-cadherin and tumor cells in all images show indiscernible delocalization in junctional staining. Scale bars are 10 μm. (C) Perfusion with 70-kDa dextran revealed no leaks at the sites of extravasation (red: dextran, green: MDA-MB-231). Scale bar is 20 μm.
Video of MDA-MB-231 being seeded into the microvascular network via a pressure drop of 5.2 mmH2O across the gel region of a device.
Bright field-fluorescent overlay time-lapse imaging over a period of 24 hours of MDA-MB-231 (green) extravasating from a microvascular network in one region of interest in a device.
Insight, Innovation, Integration.
The lack of tumor cell extravasation models that are both high-resolution, high throughput and physiologically relevant has limited our understanding of the mechanisms involved in this rate-limiting step in metastasis. Here, we present a microfluidic platform capable of modeling the entire process of extravasation from within in vitro microvascular networks. We show its ability to distinguish between cell lines of varying invasiveness and study the extravasation patterns of different subpopulations including mechanically trapped and adhered cells. We demonstrate - in high spatial and temporal resolution – the tumor-endothelial interactions during extravasation. This merging of microfluidics and cell biology will allow deeper insights into the mechanisms extravasation, and facilitate the discovery of factors that can inhibit it.
Acknowledgments
We acknowledge Ioannis Zervantonakis and William Polacheck for helpful discussions. We gratefully acknowledge support from the National Cancer Institute (R33 CA174550-01) and the National Science Foundation (Graduate Fellowship support for MBC).
Notes and references
- 1.Nicolson GL. Curr Opin Cell Biol. 1989;1:1009–1019. doi: 10.1016/0955-0674(89)90073-2. [DOI] [PubMed] [Google Scholar]
- 2.Luzzi KJ, MacDonald IC, Schmidt EE, Kerkvliet N, Morris VL, Chambers AF, Groom AC. Am J Pathol. 1998;153:865–873. doi: 10.1016/S0002-9440(10)65628-3. [DOI] [PMC free article] [PubMed] [Google Scholar]
- 3.Podsypanina K, Du YC, Jechlinger M, Beverly LJ, Hambardzumyan D, Varmus H. Science. 2008;321:1841–1844. doi: 10.1126/science.1161621. [DOI] [PMC free article] [PubMed] [Google Scholar]
- 4.Sahai E. Nat Rev Cancer. 2007;7:737–749. doi: 10.1038/nrc2229. [DOI] [PubMed] [Google Scholar]
- 5.Stoletov K, Kato H, Zardouzian E, Kelber J, Yang J, Shattil S, Klemke R. J Cell Sci. 2010;123:2332–2341. doi: 10.1242/jcs.069443. [DOI] [PMC free article] [PubMed] [Google Scholar]
- 6.Townson JL, Chambers AF. Cell cycle. 2006;5:1744–1750. doi: 10.4161/cc.5.16.2864. [DOI] [PubMed] [Google Scholar]
- 7.Hendrix MJ, Seftor EA, Seftor RE, Fidler IJ. Cancer Lett. 1987;38:137–147. doi: 10.1016/0304-3835(87)90209-6. [DOI] [PubMed] [Google Scholar]
- 8.Dimilla QJPA, Albelda SM, Lauffenburger DA. AIChE J. 1992;38:1092–1104. [Google Scholar]
- 9.Al-Mehdi AB, Tozawa K, Fisher AB, Shientag L, Lee A, Muschel RJ. Nat Med. 2000;6:100–102. doi: 10.1038/71429. [DOI] [PubMed] [Google Scholar]
- 10.Shin Y, Han S, Jeon JS, Yamamoto K, Zervantonakis IK, Sudo R, Kamm RD, Chung S. Nat Protoc. 2012;7:1247–1259. doi: 10.1038/nprot.2012.051. [DOI] [PMC free article] [PubMed] [Google Scholar]
- 11.Song JW, Cavnar SP, Walker AC, Luker KE, Gupta M, Tung YC, Luker GD, Takayama S. PLoS One. 2009;4:e5756. doi: 10.1371/journal.pone.0005756. [DOI] [PMC free article] [PubMed] [Google Scholar]
- 12.Zhang Q, Liu T, Qin J. Lab on a chip. 2012;12:2837–2842. doi: 10.1039/c2lc00030j. [DOI] [PubMed] [Google Scholar]
- 13.Jeon JS, Zervantonakis IK, Chung S, Kamm RD, Charest JL. PLoS One. 2013;8:e56910. doi: 10.1371/journal.pone.0056910. [DOI] [PMC free article] [PubMed] [Google Scholar]
- 14.Zervantonakis IK, Hughes-Alford SK, Charest JL, Condeelis JS, Gertler FB, Kamm RD. Proc Natl Acad Sci U S A. 2012;109:13515–13520. doi: 10.1073/pnas.1210182109. [DOI] [PMC free article] [PubMed] [Google Scholar]
- 15.Chaw KC, Manimaran M, Tay EH, Swaminathan S. Lab on a chip. 2007;7:1041–1047. doi: 10.1039/b707399m. [DOI] [PubMed] [Google Scholar]
- 16.Heyder C, Gloria-Maercker E, Entschladen F, Hatzmann W, Niggemann B, Zanker KS, Dittmar T. J Cancer Res Clin Oncol. 2002;128:533–538. doi: 10.1007/s00432-002-0377-7. [DOI] [PMC free article] [PubMed] [Google Scholar]
- 17.Hsu YH, Moya ML, Abiri P, Hughes CC, George SC, Lee AP. Lab on a chip. 2013;13:81–89. doi: 10.1039/c2lc40787f. [DOI] [PMC free article] [PubMed] [Google Scholar]
- 18.Kim S, Lee H, Chung M, Jeon NL. Lab on a chip. 2013;13:1489–1500. doi: 10.1039/c3lc41320a. [DOI] [PubMed] [Google Scholar]
- 19.Song JW, Munn LL. Proc Natl Acad Sci U S A. 2011;108:15342–15347. doi: 10.1073/pnas.1105316108. [DOI] [PMC free article] [PubMed] [Google Scholar]
- 20.Muthuswamy SK, Li D, Lelievre S, Bissell MJ, Brugge JS. Nat Cell Biol. 2001;3:785–792. doi: 10.1038/ncb0901-785. [DOI] [PMC free article] [PubMed] [Google Scholar]
- 21.Nagrath S, Sequist LV, Maheswaran S, Bell DW, Irimia D, Ulkus L, Smith MR, Kwak EL, Digumarthy S, Muzikansky A, Ryan P, Balis UJ, Tompkins RG, Haber DA, Toner M. Nature. 2007;450:1235–1239. doi: 10.1038/nature06385. [DOI] [PMC free article] [PubMed] [Google Scholar]
- 22.Sheikh S, Rainger GE, Gale Z, Rahman M, Nash GB. Blood. 2003;102:2828–2834. doi: 10.1182/blood-2003-01-0080. [DOI] [PubMed] [Google Scholar]
- 23.Qian DYB, Im JH, Muschel RJ, Zou Y, et al. PLoS One. 2009:4. doi: 10.1371/journal.pone.0006562. [DOI] [PMC free article] [PubMed] [Google Scholar]
- 24.McDonald B, Spicer J, Giannais B, Fallavollita L, Brodt P, Ferri LE. Int J Cancer. 2009;125:1298–1305. doi: 10.1002/ijc.24409. [DOI] [PubMed] [Google Scholar]
- 25.Mantovani A, Allavena P, Sica A, Balkwill F. Nature. 2008;454:436–444. doi: 10.1038/nature07205. [DOI] [PubMed] [Google Scholar]
- 26.Tremblay PL, Huot J, Auger FA. Cancer Res. 2008;68:5167–5176. doi: 10.1158/0008-5472.CAN-08-1229. [DOI] [PubMed] [Google Scholar]
- 27.Yuan W, Lv Y, Zeng M, Fu BM. Microvasc Res. 2009;77:166–173. doi: 10.1016/j.mvr.2008.08.004. [DOI] [PubMed] [Google Scholar]
- 28.Chrobak KM, Potter DR, Tien J. Microvasc Res. 2006;71:185–196. doi: 10.1016/j.mvr.2006.02.005. [DOI] [PubMed] [Google Scholar]
- 29.Zheng Y, Chen J, Craven M, Choi NW, Totorica S, Diaz-Santana A, Kermani P, Hempstead B, Fischbach-Teschl C, Lopez JA, Stroock AD. Proc Natl Acad Sci U S A. 2012;109:9342–9347. doi: 10.1073/pnas.1201240109. [DOI] [PMC free article] [PubMed] [Google Scholar]
- 30.Mierke CT. J Biol Chem. 2011;286:40025–40037. doi: 10.1074/jbc.M111.256172. [DOI] [PMC free article] [PubMed] [Google Scholar]
- 31.Peng HH, Dong C. Cellular and molecular bioengineering. 2009;2:375–385. doi: 10.1007/s12195-009-0067-5. [DOI] [PMC free article] [PubMed] [Google Scholar]
- 32.Weis S, Cui J, Barnes L, Cheresh D. J Cell Biol. 2004;167:223–229. doi: 10.1083/jcb.200408130. [DOI] [PMC free article] [PubMed] [Google Scholar]
- 33.Teo GS, Ankrum JA, Martinelli R, Boetto SE, Simms K, Sciuto TE, Dvorak AM, Karp JM, Carman CV. Stem Cells. 2012;30:2472–2486. doi: 10.1002/stem.1198. [DOI] [PMC free article] [PubMed] [Google Scholar]
- 34.Haraldsen G, Kvale D, Lien B, Farstad IN, Brandtzaeg P. J Immunol. 1996;156:2558–2565. [PubMed] [Google Scholar]
- 35.Miles FL, Pruitt FL, van Golen KL, Cooper CR. Clin Exp Metastasis. 2008;25:305–324. doi: 10.1007/s10585-007-9098-2. [DOI] [PubMed] [Google Scholar]
- 36.Zen K, Liu D-Q, Guo Y-L, Wang C, Shan J, Fang M, Zhang C-Y, et al. PloS one. 2008:3. doi: 10.1371/journal.pone.0001826. [DOI] [PMC free article] [PubMed] [Google Scholar]
- 37.Hewitt RE, McMarlin A, Kleiner D, Wersto R, Martin P, Tsokos M, Stamp GW, Stetler-Stevenson WG. J Pathol. 2000;192:446–454. doi: 10.1002/1096-9896(2000)9999:9999<::AID-PATH775>3.0.CO;2-K. [DOI] [PubMed] [Google Scholar]
- 38.Stoletov K, Montel V, Lester RD, Gonias SL, Klemke R. Proc Natl Acad Sci U S A. 2007;104:17406–17411. doi: 10.1073/pnas.0703446104. [DOI] [PMC free article] [PubMed] [Google Scholar]
- 39.Zijlstra A, Mellor R, Panzarella G, Aimes RT, Hooper JD, Marchenko ND, Quigley JP. Cancer Res. 2002;62:7083–7092. [PubMed] [Google Scholar]
- 40.Koop S, Schmidt EE, MacDonald IC, Morris VL, Khokha R, Grattan M, Leone J, Chambers AF, Groom AC. Proc Natl Acad Sci U S A. 1996;93:11080–11084. doi: 10.1073/pnas.93.20.11080. [DOI] [PMC free article] [PubMed] [Google Scholar]
- 41.Sahni A, Arevalo MT, Sahni SK, Simpson-Haidaris PJ. Int J Cancer. 2009;125:577–584. doi: 10.1002/ijc.24340. [DOI] [PubMed] [Google Scholar]
- 42.Colmone A, Amorim M, Pontier AL, Wang S, Jablonski E, Sipkins DA. Science. 2008;322:1861–1865. doi: 10.1126/science.1164390. [DOI] [PubMed] [Google Scholar]
- 43.Kienast Y, von Baumgarten L, Fuhrmann M, Klinkert WE, Goldbrunner R, Herms J, Winkler F. Nat Med. 2010;16:116–122. doi: 10.1038/nm.2072. [DOI] [PubMed] [Google Scholar]
- 44.Sipkins DA, Wei X, Wu JW, Runnels JM, Cote D, Means TK, Luster AD, Scadden DT, Lin CP. Nature. 2005;435:969–973. doi: 10.1038/nature03703. [DOI] [PMC free article] [PubMed] [Google Scholar]
- 45.Mak M, Reinhart-King CA, Erickson D. Lab on a chip. 2013;13:340–348. doi: 10.1039/c2lc41117b. [DOI] [PMC free article] [PubMed] [Google Scholar]
- 46.Vicente-Manzanares M, Sanchez-Madrid F. Nat Rev Immunol. 2004;4:110–122. doi: 10.1038/nri1268. [DOI] [PubMed] [Google Scholar]
- 47.Petri B, Bixel MG. The FEBS journal. 2006;273:4399–4407. doi: 10.1111/j.1742-4658.2006.05439.x. [DOI] [PubMed] [Google Scholar]
- 48.Nourshargh S, Hordijk PL, Sixt M. Nat Rev Mol Cell Biol. 2010;11:366–378. doi: 10.1038/nrm2889. [DOI] [PubMed] [Google Scholar]
- 49.Fidler IJ. Nat Rev Cancer. 2003;3:453–458. doi: 10.1038/nrc1098. [DOI] [PubMed] [Google Scholar]
- 50.Crissman JD, Hatfield JS, Menter DG, Sloane B, Honn KV. Cancer Res. 1988;48:4065–4072. [PubMed] [Google Scholar]
- 51.Koop S, Khokha R, Schmidt EE, MacDonald IC, Morris VL, Chambers AF, Groom AC. Cancer Res. 1994;54:4791–4797. [PubMed] [Google Scholar]
- 52.EJ . Philadelphia: W. B. Saunders; 1928. [Google Scholar]
- 53.Hu L, Ferrara N, Jaffe RB. Exp Biol Med (Maywood) 2006;231:1646–1652. doi: 10.1177/153537020623101010. [DOI] [PubMed] [Google Scholar]
- 54.Utoguchi N, Mizuguchi H, Saeki K, Ikeda K, Tsutsumi Y, Nakagawa S, Mayumi T. Cancer Lett. 1995;89:7–14. doi: 10.1016/0304-3835(95)90151-5. [DOI] [PubMed] [Google Scholar]
- 55.Curry FE, Huxley VH, Adamson RH. Am J Physiol. 1983;245:H495–505. doi: 10.1152/ajpheart.1983.245.3.H495. [DOI] [PubMed] [Google Scholar]
Associated Data
This section collects any data citations, data availability statements, or supplementary materials included in this article.
Supplementary Materials
Figure S1. Formation of microvascular networks in microfluidic devices. (A) Change in individual vessel diameters (n=40 vessels) during time frame of extravasation experiments (days 4 to 6). (B) Changes in total vessel branches normalized by the total number of cells over time (6 ROI/device, 3 devices). Data are presented as mean ±SD, with *p<0.05.
Figure S2. Extravasation in μVNs. (A) Tumor cell seeding density versus the number of tumor cells found per ROI (n=18 ROI over 3 devices). (B) Example of the distribution of the number of extravasated cells in different ROIs in a single device. (C) No significant increase in the number of tumor cells from 0 to 24 h is found. Data are presented as mean ±SD, with *p<0.05.
Figure S3. VE-cadherin staining at extravasation sites. (A) An MDA-MB-231 cell that has extended protrusions into the subendothelial matrix, before transmigration of the nucleus. Tumor cell (green) protrusions appear localized at EC cell-cell junctions (red). (B) Tumor cell in mid-TEM, after transmigration of the nucleus. Unmerged and merged images of VE-cadherin and tumor cells in all images show indiscernible delocalization in junctional staining. Scale bars are 10 μm. (C) Perfusion with 70-kDa dextran revealed no leaks at the sites of extravasation (red: dextran, green: MDA-MB-231). Scale bar is 20 μm.
Video of MDA-MB-231 being seeded into the microvascular network via a pressure drop of 5.2 mmH2O across the gel region of a device.
Bright field-fluorescent overlay time-lapse imaging over a period of 24 hours of MDA-MB-231 (green) extravasating from a microvascular network in one region of interest in a device.