. 2014 Jun 3;3:e02743. doi: 10.7554/eLife.02743

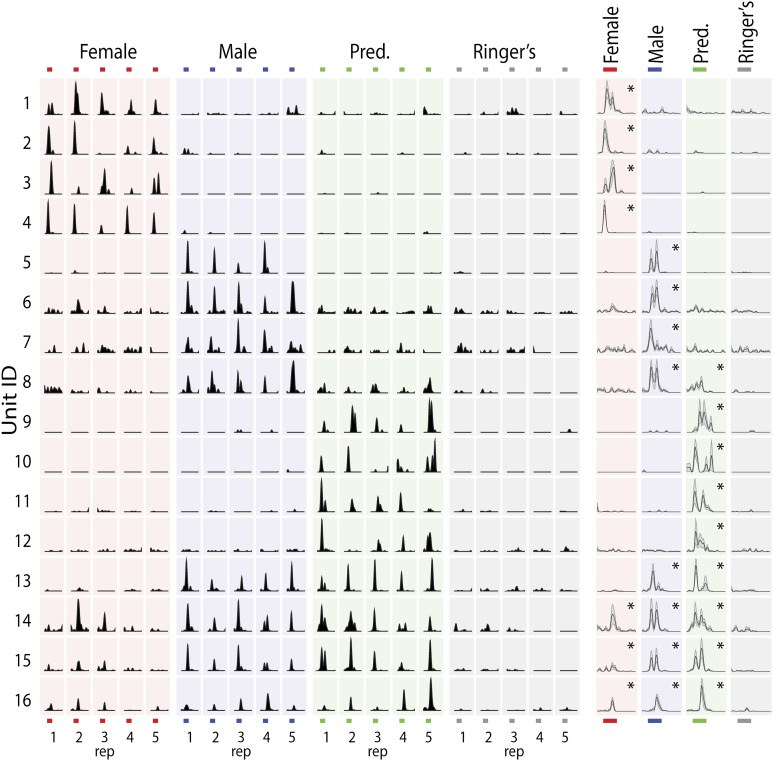
Figure 2. MeA sensory responses to VNO stimuli.

(Left) Each row shows the responses elicited in a single MeA unit by four different VNO stimuli, with each stimulus presented 5 times. The order of stimulus presentation was randomized during the experiment, but is shown grouped by stimulus for clarity. (Right) Histograms showing the mean response and standard error (shaded region) for each unit. Responses were aligned to the onset of stimulus presentation. All significant responses (p<0.01; Nonparametric ANOVA) are indicated by an asterisk in the top right corner of the average histogram plots. Response magnitudes for each unit were normalized to the maximum response for all stimuli. Colored bars (top and bottom) indicate the 40 s epoch following stimulus presentation that was considered for all analyses.

DOI: http://dx.doi.org/10.7554/eLife.02743.007

Figure 2.

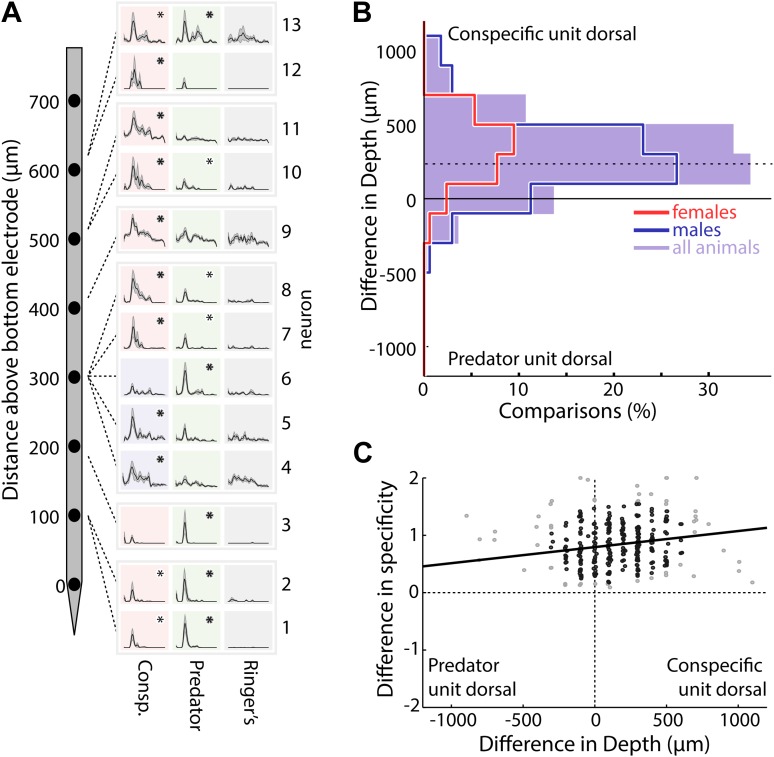
Figure 2—figure supplement 1. MeA units responsive to different stimulus categories are spatially segregated.

Figure 2—figure supplement 1.

(A) A single electrophysiological probe was positioned in the MeA of an adult male mouse (left) and 13 MeA units were simultaneously recorded on 8 evenly spaced recording sites (right: rows). Dashed lines indicate the recording sites/depth. The average responses to four stimuli (columns) are shown for each unit (asterisks indicate significant responses; bold asterisks indicate unit classification as ‘predator’ or ‘conspecific’). (B) The dorsoventral distance between pairs of neurons with different stimulus classifications (either ‘conspecific’ or ‘predator’) is shown for all simultaneously recorded pairs. Positive values indicate the conspecific unit was dorsal to the predator unit. Red, blue, and shaded purple curves represent data obtained from female, male, and all animals respectively with each curve skewed towards conspecific units being located dorsally (p<0.00001 for all distributions: signrank test; horizontal dashed line indicates the mean for all animals: 160, 95% CI = 123 to 189 µm). (C) The dorsoventral distance is plotted against the difference in stimulus specificity for all unit pairs. Regression analysis indicates a weak relationship between the dorsoventral distance and the difference in stimulus specificity for unit pairs (R2 = 0.033, F = 8.6, p=0.003; black line; light gray points omitted due to high leverage). Therefore, the dorsoventral topography is largely a result of quantitative biases in the numbers of ‘conspecific’ and ‘predator’ neurons located dorsal vs ventral, while only 3% of the variance is explained by a smooth transition from ‘predator’ selective neurons (ventral) to ‘conspecific’ selective neurons (dorsal).
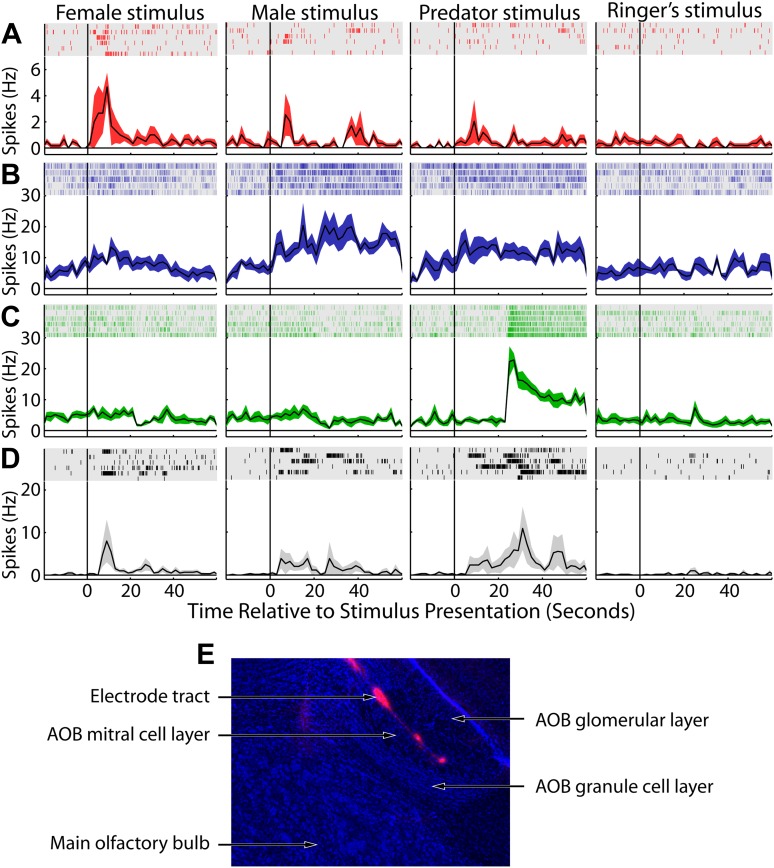
Figure 2—figure supplement 2. AOB sensory responses to VNO stimuli.

Figure 2—figure supplement 2.

Each row (A-D) shows data obtained from a single well-isolated AOB unit, and each column indicates the stimulus presented (female, male, predator, Ringer's). For each panel, raster plots (top, shaded region) show the timing of spikes that occurred during each of 5–7 trials. Histograms of the mean spiking response are shown below each raster plot with standard error (shaded color region). (E) Sagittal section through the olfactory bulb. DAPI staining is shown in blue and the electrodes were coated with DiI (red) prior to insertion.