

Abstract
Traditionally, muscle physiology experiments require multiple tissue samples to obtain morphometric, electrophysiological, and contractility data. Furthermore, these experiments are commonly completed one at a time on cover slips of single cells, isotropic monolayers, or in isolated muscle strips. In all of these cases, variability of the samples hinders quantitative comparisons among experimental groups. Here, we report the design of a “heart on a chip” that exploits muscular thin film technology – biohybrid constructs of an engineered, anisotropic ventricular myocardium on an elastomeric thin film – to measure contractility, combined with a quantification of action potential propagation, and cytoskeletal architecture in multiple tissues in the same experiment. We report techniques for real-time data collection and analysis during pharmacological intervention. The chip is an efficient means of measuring structure-function relationships in constructs that replicate the hierarchical tissue architectures of laminar cardiac muscle.
Introduction
Early stage drug discovery and safety assessment is hampered by the lack of technologies for attaining high-throughput and high quality data in a cost effective manner.1 Cardiovascular pharmacology studies are particularly challenging due to the difficulty of replicating tissue microenvironments in vitro and measuring both contractility and electrophysiology. In vivo, cardiac myocytes polarize their intracellular contractile apparatus and align with neighboring cells to facilitate the rapid spread of electrical activation and to increase the force of contraction.2-5 Replicating these functionalities in vitro may increase the accuracy of these experimental efforts. Recent report of new methods for cardiac cell and tissue engineering suggest a means to replicate hierarchal cardiac tissue structure in vitro.6-11
A range of tools have been developed to measure various biomechanical properties of single cells in vitro.12 Methods reported for measuring the contractility of single cardiomyocytes include computing stresses based on the deformation of elastic substrates,13 optically measuring cardiomyocyte, or sarcomere, shortening,14,15 calculating stresses based on the deflection of vertical micro-pillars,16-19 and measuring stress, or strain, by attaching carbon fibers to cardiomyocytes.20-22 Microfluidic systems have also been constructed to characterize electrophysiological properties of isolated cardiomyocytes by constraining them in a micro-channel and measuring extracellular potential,23 transmembrane currents,24 or calcium transients.14 However, single cardiomyocytes are not necessarily an appropriate model for all toxicology studies. For example, a recent report suggests pharmacological response may vary with the number of cardiomyocytes within a cellular ensemble.25 Furthermore, even though these chips can increase throughput of cardiac experiments, they do not fully recapitulate tissue-scale functions such as action potential (AP) propagation or contractile stress generated.3-5
A variety of techniques has been reported as effective means of measuring tissue contractility.26-28 Collectively, these techniques lack one or more features, such as an ability to replicate the anisotropic structure of the cardiac ventricles, the ease of manufacture of the assay, high throughput, ability to collect electrophysiological or morphological data, or efficient data analysis protocols. Previously, we reported a means of using tissue engineered myocardium in a two-dimensional (2D) tissue construct to measure contractile strength in a tissue with designer architecture.29,30 This technique is referred to as muscular thin films (MTF) and incorporates 2D bilaminate constructs consisting of an anisotropic tissue composed of muscle cells cultured on a deformable elastic thin film.29 The contractility of the tissue is observed in the three-dimensional (3D) deformations of the MTF, and the extent of the deformation will depend on film geometry and the tissue organization.29 We have also reported a model to directly correlate the film’s curvature to the systolic stress generated by the tissue.30 Thus, the MTF system is amenable to 2D culture and analysis techniques and direct calculation of contractile stresses of an engineered laminar tissue.
In this report, we detail a “heart on a chip” technology based on the MTF platform. The chip is an assay where the contraction of up to eight MTFs can be measured simultaneously. Furthermore, we demonstrated the feasibility of the “heart on a chip” for both structure-function and pharmacological studies. In summary, the “heart on a chip” provides several key advances in screening technology, including the ability to measure contractile stress as a function of time, AP propagation, and inter- and intracellular architecture.
Results and discussion
Chip design and fabrication
We fabricated the chip by blocking the edges of a 25 mm cover slip with a protective film (Fig. 1a(i)) and spin coating a layer of poly(N-isopropylacrylamide) (PIPAAm) on the surface (Fig. 1a(ii)), which dissolves at temperatures below 35 °C. The protective film was peeled away leaving an island of PIPAAm (Fig. 1a(iii)), and then polydimethylsiloxane (PDMS) was spin coated over the cover slip and cured for 8 h (Fig. 1a(iv)). Several cover slips were manufactured simultaneously by placing a protective film over both surfaces of a large glass section (Fig. 1b(i)) and cutting out rectangular sections (10 × 6 mm) from the top protective film with a straight-edge razor blade. PIPAAm was spin coated onto the exposed glass, and the top protective film was removed (Fig. 1b(ii)). PDMS was spin coated onto the glass surface and cured for 8 h (Fig. 1b(iii)). The bottom protective film was removed to expose the bare glass, which was scored with a diamond glass cutter for customized substrates (Fig. 1b(iv)).
Fig. 1.
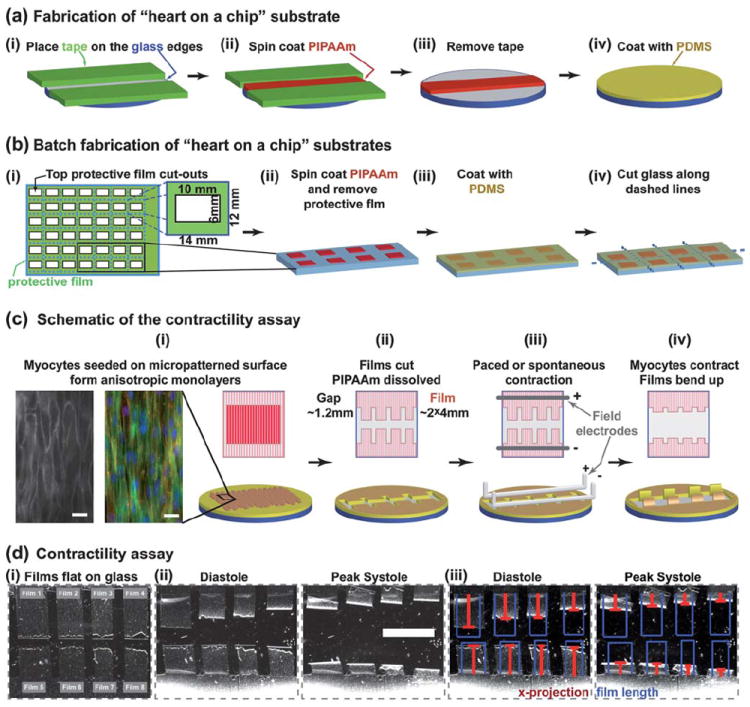
“Heart on a chip” assembly and use. (a) Fabrication of 25 mm round substrates; (b) schematic representation of batch fabrication of substrates with large glass sections for higher throughput; (c) contractility assay is run using anisotropic layers of myocytes; bottom row shows a 3D schematic representation, top row shows the view from above; the insets in (i): RH237 membrane dye stain (left) and an immunostain of α-actinin – red, actin – green, nuclei – blue (right), scale bar 20 μm; (d) Contractility experiment (PDMS layer = 18.6 μm): (i) Brightfield images of films attached to the substrate, (ii) films bend up at diastole and peak systole, and (iii) the length of films (blue) and x-projection (red) overlaid on “heart on a chip” images – scale bar 5 mm.
The “heart on a chip” was designed to be compatible with well established 2D cell culture techniques, such as microcontact printing of extracellular matrix proteins.6,10,31 Therefore, to organize myocytes into anisotropic tissues, we microcontact printed a fibronectin (FN) “brick wall” pattern on the PDMS surface and seeded neonatal rat ventricular myocytes onto the functionalized substrate (Fig. 1c(i)). The myocytes self-organized with respect to the FN pattern into an electromechanically coupled anisotropic monolayer (insets-Fig. 1c(i)). The contractility experiments were performed by placing the chip in normal Tyrode’s solution and manually cutting the thin films into an array of two opposing rows of two to four rectangles (Fig. 1c(ii)). The extraneous MTFs were peeled away, and the PIPAAm layer dissolved as the media cooled to room temperature. The chip was placed in a temperature-controlled bath, and the tissues were field-stimulated by placing platinum electrodes (1 mm diameter) above and below the rows of MTFs (Fig. 1c(iii)). To ensure that cardiomyocytes were consistently 5 mm below the electrodes, the platinum wires were built into a standard 35 mm Petri dish top. The MTFs, fixed to the substrate by one edge, would have the free edge deflect vertically away from the cover slip plane during systole (Fig. 1c(iv)). For a 4 mm MTF, the projection on the culture plane ranged ~1–4 mm (Fig. 1d(i)). The films’ kinematics were recorded with a video camera mounted on a stereomicroscope (Fig. 1d(ii), Video 1, ESI‡), and the film’s length and projection on the culture plane were calculated using ImageJ and MatLab analysis software (Fig. 1d(iii), Videos 2–3, ESI‡).
Calculating tissue stress and the radius of curvature during the contractile cycle
When the film lies flat on the glass, its radius of curvature (r) is infinite, so the length of the film (L) can be measured directly (Fig. 1d(i), Fig. 2a). After PIPAAm dissolved, the films bent to a curvature corresponding to the diastolic stress in the tissue. During contraction, the radius of curvature decreased until peak systole (Fig. 2a). In the previously published MTF assay,30 the curvature of the films could be observed directly (curving lines in Fig. 2a). In the “heart on a chip” experiments, the films are viewed from above, where only the horizontal projection is visible (grey rectangles in Fig. 2a). During systole, this projection shortens, and we refer to the length between the film’s attached edge and the visible projection edge (red bars in Fig. 1d(iii), 2a, and 2b) as the x-projection (x). The schematic of concentrically overlaid films (blue, Fig. 2b) illustrates the quantities measured by the x-projection during the contraction cycle. Until the film makes an arc with an angle (θ = L/r) greater or equal to π/2, the projection decreases as x = rsin(L/r) with decreasing r. Thereafter, the x-projection is the radius of curvature, x = r, as long as the film does not come into contact with itself (θ < 2π). Therefore, the expected measurement of the x-projections is in the range of (L/2π) < x ≤ L. Because the radius of curvature would no longer be constant throughout the MTF if the film comes into contact with itself, we did not cut the films long enough to make a full circle and designed the analysis code to eliminate any experiments in which the measured x-projection was x < (L/2π). The relationship between the x-projection and the radius of curvature is fully defined as long as the length of the film is known (Fig. 2c). For x-projections approaching the length of the film, the radius of curvature increases rapidly; however, that does not negatively impact the accuracy of the stress calculations because the stress at large radius of curvature is very small compared to peak systole. For films with a thicker layer of PDMS, or with weak myocytes, it was possible to cut one row of longer films (2–4 films, ~8mm long) to extend the observed range of motion and improve accuracy.
Fig. 2.
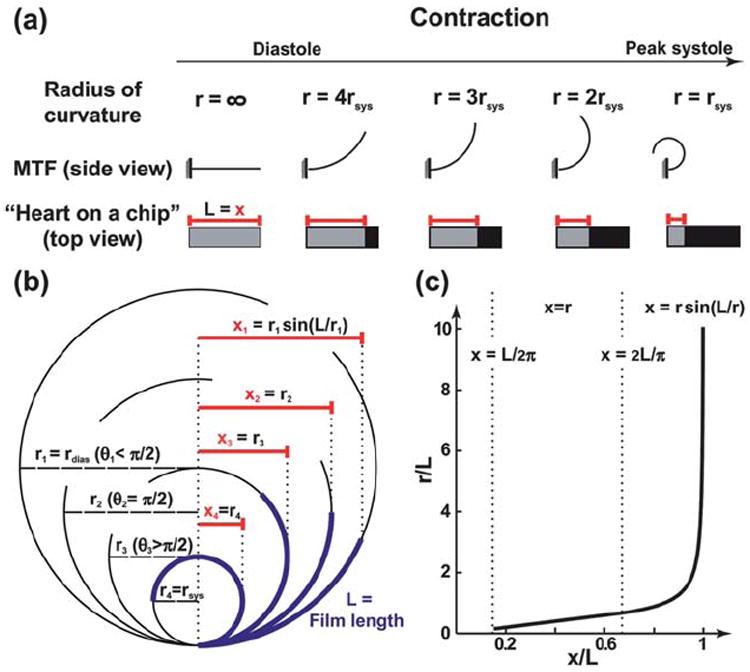
Calculation of the radius of curvature. (a) A schematic drawing contrasting the view of the regular MTF assay with the “heart on a chip”, through the contraction cycle; (b) The x-projection measured during the running of the assay, as the radius of curvature increases; (c) Plot showing the relationship between the measured x-projection and the radius of curvature, with appropriate equations to use in each region.
The radius of curvature was used to compute the stress for each frame by considering the film as a two layer plane strain beam, and the volume growth method was used with the PDMS film and cardiomyocyte monolayer as the passive and active layers, respectively.30 Unlike the analysis developed for other biohybrid films,27,28 this method for calculating stress is designed for contractions of anisotropic tissues, yet it is not as computationally intensive as finite element models of MTFs.32 As shown in the parametric studies by Alford et al.,30 the observed radius of curvature for the same stress depends on both the PDMS and cell layer thickness. While an average cardiomyocyte layer thickness was assumed to be the same as used previously in the work by Alford et al.30 (~4 μm), the PDMS layer thickness was measured for every experiment with a profilometer. Each chip can have its own PDMS layer thickness, and we report it in the figure legends for every experiment. However, unlike the observed radius of curvature, the calculated stress could be compared among MTFs from chips with different PDMS thicknesses. The ability to vary the thickness of the PDMS layer extends the range of measurable stresses within the deformation limit ((L/2π) < x ≤ L).
In the “heart on a chip” experiments, each film represents an independent experimental sample, with its own stress profile (Fig. 3a). Calculated from three chips with a total of 20 independent films, the systolic and diastolic stresses at 37 °C and 2 Hz pacing were within the range previously reported for isolated rat right ventricular papillary muscle strips (Fig. 3b).33 Although, the chips consisted of a 2D monolayer of cardiomyocytes, which cannot fully replicate the 3D myocardium structure, the average systolic stress (20.7 ± 5.6 kPa) and diastolic stress (8.0 ± 2.0 kPa) lie within the stress range previously measured in isolated muscle strip experiments (11–30 kPa and 7–14 kPa, respectively).33,34 The peak systolic stresses were higher than those reported in engineered cardiac tissues paced at 0.5 Hz at room temperature (9.2 ± 3.5 kPa),30 likely due to the fact that the chip experiments were conducted at physiological temperatures.
Fig. 3.

Cardiac contractility recorded with “heart on a chip”. (a) Stress traces for each film from chip in Fig. 1d; (b) stress summary for 20 films in 3 chips compared to isolated right ventricular muscle(dashed lines);33 PDMS layer thicknesses for three chips: 18.6, 15.6, 14.5 μm.
Applications of the chip
One of the applications of the “heart on a chip” technology is to simultaneously measure the contractile function of multiple tissues during pharmacological interventions. MTF bending due to spontaneous contraction of cardiomyocytes was observed for a cumulative drug dose-response experiment with epinephrine, a standard chronotropic agent. The stress profiles generated at each concentration were used to calculate the average frequency of contraction (Fig. 4a). The resulting dose-response curve exhibited the expected chronotropic effect with frequencies rising by a factor of four as the concentration of epinephrine increased from 10−9 M to 10−6 M (Fig. 4b). The results from this experiment recapitulated previously reported epinephrine dose response curves from isolated atria strips of adult rats.35
Fig. 4.

Drug dose-response and structural studies. (a) Epinephrine drug dose assay stress traces (PDMS layer = 28 μm). (b) The epinephrine dose-response summarized for a two film assay. (c) Bright field and fluorescent images of a “heart on a chip” tissue: (i) image of an 8-film chip; (ii) a stain of two of the films, actin (green), nuclei (blue); (iii) actin fibers (green), nuclei (blue); (iv) sarcomeres (α-actinin). (d)(i) Example stress traces; (ii) sarcomeres (α-actinin); (iii) sarcomere orientation histograms; (iv) summary of OOP, peak systole and diastole stresses. Scale bars = 2mm for (b), (c)(i)–(ii); 20μm for (d)(iii)–(iv), (e)(i); PDMS layer thickness: chip 1–20 μm, chip 2–15.6 μm.
We also compared the stress generated by each tissue on the chip relative to its sarcomere organization. To visualize intracellular architecture after the contractility experiments were completed, the tissues (Fig. 4c(i)) were stained for nuclei, actin (Fig. 4c(ii)–(iii)), and sarcomeric α-actinin (Fig. 4c(iv)). Prior to mounting the chip on a microscope slide for imaging, the films were flattened on the glass, which did not disrupt the cytoskeleton because the cardiomyocytes were originally cultured on the flat substrate. We compared the contractility of two tissues with different architecture: isotropic (chip 1) and anisotropic (chip 2) cellular alignment (Fig. 4d(i)). As evident from the sarcomeric α-actinin stain, on chip 1 the monolayer was isotropic, and on chip 2 it was anisotropic (Fig. 4d(ii)). The distribution of sarcomere orientation angles (Fig. 4d(iii)) was used to calculate the orientational order parameter (Fig. 4e(iv)), which was significantly different for the two types of tissues (p < 0.001). As expected from previous reports3,29 a high degree of alignment corresponds to significantly (p < 0.01) higher diastolic and peak systolic stresses (Fig. 4d(iv)). Thus, the “heart on a chip” is useful for quantitative, correlative studies between cytoskeleton organization and contractility.
Measuring excitation and contraction in a single tissue
The “heart on a chip” is also amenable to measurement of electrophysiological properties of engineered tissues with an optical mapping system (OMS), where tissues are stained with a voltage-sensitive membrane dye.10 After contractility measurements, we moved the chip to the OMS (Fig. 5a), and the tissues were point stimulated by platinum electrodes placed at the fixed edge of the MTF (Fig. 5b). The cardiomyocytes were incubated with RH237 voltage membrane dye for five minutes (Fig. 5c), and an excitation-contraction decoupler, Blebbistatin (10 μM), was added to suppress motion artifacts. To collect electrophysiological data, the tissue was exposed to an excitation light beam, and the emitted light was filtered through an array of optical fibers (overlaid on the RH237 image in Fig. 5c). The transmembrane potential of the myocytes was proportional to the amount of photocurrent passed by the photodiodes coupled to the fiber array.36,37
Fig. 5.
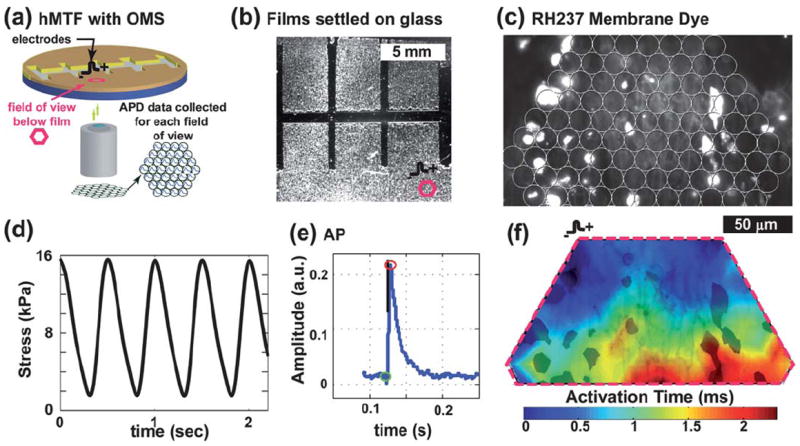
Contractility and electrophysiology experiments: (a) Chip in OMS. (b) Brightfield image of a chip marked with a field of view (fov) (PDMS layer = 23μm); (c) RH237 membrane dye image, overlaid with the fiber array location (outlined as fov in (b)). (d) Example stress trace from two chips. (e) Mean optical AP trace. (f) Activation map plot (blue to red contour plot) over an image of the RH237 dye (in black).
Thus, in a “heart on a chip” experiment, the contractile stresses (Fig. 5d), AP morphology (Fig. 5e), and action potential wavefronts (Fig. 5f) can be measured. These data reveal a contractile tissue with an action potential morphology and wavefront shape consistent with previous reports.10 The only limitation of the current design is the necessity to measure the contractility on a stereoscope and the electrophysiology on an inverted fluorescent microscope coupled to the OMS. The transfer of the chip from one system to the other prolongs the experiment beyond the viability of cardiomyocytes. To overcome this problem and to collect the contractility and electrophysiological data simultaneously, a microscope could be built where the MTF kinematics could be observed from above with low magnification while the OMS data are taken from below with a high magnification objective. These experiments suggest that the current chip design will support a variety of morphological and physiological experiments on a single preparation.
Experimental
Substrate fabrication
The muscular thin film chips were made with a multi-step fabrication process on round or rectangular glass cover slips. The circular chips were made with 25 mm cover slips to fit into standard assay setups (e.g. heating stages). The substrates were cleaned by sonicating for 60 min in 95% ethanol and air dried. For round cover slips, two pieces of protective film (regular Scotch tape) were attached on the edges approximately 1 cm apart (Fig. 1a(i)). Next, poly(N-isopropylacrylamide), (PIPAAm, Polysciences, Inc., Warrington, PA) was dissolved in 99.4% 1-butanol at 10%wt (w/v). An excess of the PIPAAm solution (~1 μL mm−2) was deposited onto the portions of glass not covered with the protective film and spin coated onto the surface at 6000 RPM for 1 min (Fig. 1a(ii)). The top protective film was peeled off without disturbing the layer of PIPAAm (Fig. 1a(iii)). Next, Sylgard 184 (Dow Corning, Midland, MI) polydimethylsiloxane (PDMS) elastomer was mixed at a 10 : 1 base to curing agent ratio and cured at room temperature for 3 to 6 h prior to further spin coating. PDMS properties for different curing times were described in detail in previous publications.29 PDMS was spin coated over the whole glass section (Fig. 1a(iv)) with a 2.5 min ramp protocol and 4000 RPM as the maximum rotation speed. PDMS-coated glass was cured at 65 °C for 8 h. For round cover slips, every seventh sample was saved to measure the thickness of the PDMS thin film.
For batch production of multiple chips, we attached protective film (Static Cling Film, McMaster-Carr, Robbinsville, NJ) on both the top and the bottom of a large glass section (7 cm × 11.5 cm) and used a razor blade to cut strips out of the top film (10 × 6 mm) that were separated by 4 mm horizontally and by 6 mm vertically (Fig. 1b(i)). Next, we spin coated PIPAAm onto the surface, and then peeled off the top film, leaving small patches of PIPAAm (Fig. 1b(ii)). The PDMS was spin coated over the glass section (Fig. 1b(iii)) and, after curing, we cut the glass, using a diamond glass cutter, into 42 rectangular cover slips (14 × 12 mm) to fit into differently sized multi-well plates (Fig. 1b(iv)). Two samples from each glass section were saved for thickness measurements. The thickness of the PDMS thin film was measured using a profilometer and ranged 10–30 μm (Dektak 6M, Veeco Instruments Inc., Plainview, NY).
Fibronectin (FN, Sigma, St. Louis, MO or BD Biosciences, Sparks, MD), an extracellular matrix protein, was microcontact printed onto the surface of the substrate to provide guidance cues for self-assembly of the chemically disassociated myocytes.29,31,33,34,38 PDMS stamps with “brick wall” patterns (each brick was 20 μm wide and 100 μm long, and each short edge terminated with 5 μm long “saw-tooth”) were sterilized by sonicating for 30 min in 50% ethanol and air dried in a biohood under sterile conditions. The patterned surface of the dry stamps was covered in 250 μL of 50 μg mL−1 FN and incubated for 60 min. The surface of the cover slips was sterilized and functionalized by exposing them for 8 min to UV ozone (Model No. 342, Jetlight Company, Inc., Phoenix, AZ). The stamps were dried with compressed air and used to transfer the FN pattern to the cover slips. The cover slips were then transferred to multi-welled plates and covered with 1% Pluronics F127 (BASF Group, Parsippany, NJ) in DI water for five minutes and washed three times with Phosphate Buffered Saline (PBS). Alternatively, for isotropic tissues, the cover slips were incubated in 25 μg mL−1 FN for 15 min and washed three times with PBS. Following previously developed procedures all cover slips were stored dry at 4 °C for no more than three days prior to myocyte seeding.29,30
Myocyte harvest, seeding, and culture
The use of all laboratory animals in this study was conducted in accordance with the guidelines of Institutional Animal Care and Use Committee of Harvard University. Cardiac ventricular myocytes were harvested from two day old neonatal Sprague-Dawley rats (Charles River Laboratories, Wilmington, MA) based on published protocols.7 Briefly, ventricles were extracted and homogenized by washing in Hanks balanced salt solution, then incubated with 1 mg mL−1 trypsin overnight at 4 °C. Ventricular tissue was digested with 1 mg mL−1 collagenase at 37 °C for several minutes to release the myocytes into solution. Cells were re-suspended in M199 culture medium supplemented with 10% (v/v) heat-inactivated fetal bovine serum (FBS), 10 mM HEPES, 0.1 mM MEM non-essential amino acids, 3.5 g L−1 glucose, 2mM l-glutamine, 2 mg L−1 vitamin B-12, and 50 U/ml penicillin. The myocytes were seeded on the substrates at a density of 1 million myocytes per cover slip for six-well plates or 400,000 myocytes per cover slip for 12-well plates. The cardiac MTFs were cultured for a period of 4 days prior to conducting the experiments. The first 48 h of incubation were at 37 °C and 5% CO2 with 10% FBS media in the culture; thereafter, maintenance media (2% FBS) was used.
Contractility experiments
For the contractility assay, we transferred cover slips from the incubators to a stereomicroscope (Model MZ6 with darkfield base, Leica Microsystems, Inc., Wetzlar, Germany) in a 60 mm Petri dish filled with warm (37 °C) normal Tyrode’s solution (1.192 g of HEPES, 0.901 g of glucose, 0.265 g of CaCl2, 0.203 g of MgCl2, 0.403 g of KCl, 7.889 g of NaCl, and 0.040 g of NaH2PO4 per liter of deionized water, pH 7.4; reagents from Sigma, St. Louis, MO). To create the film formation shown in Fig. 1c(ii), a straight-blade razor was used to make two cuts perpendicular to the tissue direction in the middle of the cover slip, between 0.5 mm and 2 mm apart. The resulting strip was peeled off using tweezers. Another 6 to 10 cuts were made parallel to the tissue direction, the first spaced about 1mm to 2 mm and the next 2.5 mm to 3.5 mm away, etc. Tweezers were used to peel up the thinner strips, which were then cut at the base with a scalpel and disposed of. As a result, 4 to 8 films each between 2.5 mm and 3.5 mm wide were fixed to the substrate at one edge (Fig. 1c).
Field stimulation electrodes were built from 1 mm diameter platinum wire (VWR, Radnor, PA) and a standard 35 mm Petri dish cover with a rectangular whole in the center (1 × 2.5 cm). Each platinum wire was bent into three sections at right angles to each other (0.5 cm–1.5 cm–1 cm), and the ends were inserted into 1mm holes drilled in the Petri dish top and fixed in place using 5-minute epoxy (Devcon, Danvers, MA). During the experiments, the electrode Petri dish top was placed on top of the 35 mm Petri dish containing the chip, which ensured the electrodes were consistently 0.5 cm above the cardiomyocytes and parallel with the row of MTFs. The chip was imaged through the rectangular hole in the electrode Petri dish top.
We took an image of the MTFs while they were still attached to the substrate (Fig. 1d(i)). An image of a ruler was taken at the same magnification, which allowed us to measure the lengths of the films. The Tyrode’s in the dish equilibrated to room temperature, and the MTFs were gently peeled up as the PIPAAm dissolved (Fig. 1c). The sample was transferred to a 35 mm Petri dish with a fresh normal Tyrode’s solution and the temperature was raised to physiological (34–37 °C). An additional calibration image with a ruler was taken once all the films were in focus. Electrodes were placed into the dish spaced approximately 1cm apart, such that all the films were in the space between the two electrodes (Fig. 1c(iii)). The myocytes would contract spontaneously, or were paced at 2 Hz with 5–20 V using an external field stimulator (Myopacer, IonOptix Corp., Milton, MA) which applied a square wave pulse of 10 msec duration. The voltage was set at 20% above the capture voltage, such that all the MTFs in a dish moved simultaneously with the specified frequency. A digital video of the kinematics of the MTFs was taken for each data set (Fig. 1d(ii), Video 1, ESI‡). In a control experiment with no cardiomyocytes, it was confirmed that there was no residual stress in the PDMS. All images and movies were collected using a Basler camera (A602f Basler Inc, Exton, PA) controlled by LabView (National Instruments, Austin, TX), with all movies containing 100 to 120 frames per second.
Contractility assay data analysis
In the “heart on a chip,” the films remain fixed at one edge to the glass (Fig. 1d) and were observed from the top, unlike previously described methods,29,30 where the films were observed from the side (Fig. 2a). As a result, in our setup, the curvature of the films could not be directly observed, and we therefore employed a different method to calculate the radius of curvature. The radius of curvature was calculated by numerically solving x = r sin(L/r) for x > 2L/π and was directly measured, i.e. r = x, for L/2π < x < 2L/π, where x is the length of the film projection onto the horizontal plane (i.e. the length of the visible film in the image stack), L is the film length (taken from the initial image), and r is the radius of curvature (Fig. 2b & 2c). The digital videos made during the contractility assay were converted to image stacks and made binary using image processing software (ImageJ, NIH). The stacks of binary images were analyzed using a MatLab (Mathworks, Natick, MA) code to calculate the visible length of each film for each image in the stack (Fig. 1d(iii), Video 3, ESI‡).
The stress was calculated using the radius of curvature in the same way as in previously published work30 by considering the film as a two layer plane strain beam. As such, we assumed that there is a relationship between the film curvature and the cross-sectional stress. To calculate the stress, the finite volumetric growth method was used, with PDMS as the passive layer and the myocyte monolayer as the active layer undergoing contraction.39,40 The true stress calculated with this method is equivalent to the results of an isometric tension test, as the radius of curvature of the thin PDMS beam is much greater than its thickness and the true deformation to the myocyte layer is very small. The details of the mathematical analysis can be found in the paper by Alford et al.,30 and the methodology was implemented in a MatLab code. To characterize the contractile properties of the stress we calculated the global maximum and minimum for each contraction cycle. The systolic and diastolic stresses were defined as the averages of these maxima and minima, respectively. The frequency of contraction was found by dividing the number of contraction cycles in a data recording by the total time of the movie.
Immunofluorescent staining, imaging, and analysis
Cardiomyocytes on the films were fixed in 4% PFA with 0.01% Triton X-100 in PBS buffer for 15 min. The myocytes were then stained for actin (Alexa 488 Phalloidin, Molecular Probes, Carlsbad, CA), nuclei (4′,6′-diamidino-2- phenylindole hydrochloride, DAPI, Molecular Probes, Carlsbad, CA), and sarcomeric α-actinin (clone EA-53, Sigma, St. Louis, MO). Secondary staining was performed using tetramethylrhodamine- conjugated goat anti-mouse IgG antibodies (Alexa Fluor 594, Molecular Probes, Carlsbad, CA). A Leica DMI 6000B microscope (Leica Microsystems, Inc., Wetzlar, Germany) was used to conduct all fluorescence imaging using a 40X plan-apochromat objective. A CoolSnap HQ CCD camera (Roper Scientific, Tucson, AZ) controlled by IPLab Spectrum (BD Biosciences/Scanalytics, Rockville, MD) was used to collect immunofluorescence images.
A fingerprint, ridge detection algorithm41 coded in MatLab42 was adapted previously in our lab for identifying sarcomere orientation,43 and used here to quantify the sarcomere organization. The code produced an orientation pseudo-vector for every pixel that was not empty, and the vectors were used to calculate the orientational order tensor:
The orientational order parameter (OOP), extensively used in quantifying degrees of orientation,44,45 was defined as the maximal eigenvalue of tensor T̿; it ranges from 0 in isotropic to 1 in perfectly aligned systems. The OOP and stress data were compared with a one-way analysis of variance (ANOVA) with pair-wise comparison significance computed with a Turkey test.
Dose-response experiment
The dose-response curve was generated by cumulative 1.0 logarithmic increases in the concentration of epinephrine (Sigma, St. Louis, MO) ranging from 10−12 M to 10−4 M. The myocytes were contracting spontaneously throughout the experiment. The chip was kept in the same location on the microscope stage, while the kinematics of the films was recorded for 4–8 s at each drug concentration. The data were analyzed using the same procedures described above with user input required for the first movie set and the rest analyzed automatically.
Optical mapping experiments
To prepare the samples for optical mapping, the Tyrode’s solution was aspirated, which resulted in the PDMS films attaching to glass via hydrophobic forces. The ends of the films were further fixed to the glass with vacuum grease. In general, the procedure for optical mapping was described in previous works10,37,46 and followed in this work.
After the films were settled down onto the glass, the sample was placed into a cover slip holder with 1 mL normal Tyrode’s solution. Transmembrane potential data were collected using a custom-built optical mapping system integrated into an inverted epifluorescence microscope (Zeiss Axiovert 200, Oberkochen, Germany). Except for the transfer, the sample was kept at 34–37 °C throughout the experiment. Bipolar electrodes were placed at the base of a single MTF, stimulated at 2 Hz and the voltage increased 5–10% beyond capture (Fig. 5a–b). The sample was incubated for 5 min with 1 mL of the voltage sensitive dye RH237 at 4 μM (Invitrogen, Carlsbad, CA), then washed three times with normal Tyrode’s solution, and then the excitation-contraction was uncoupled by incubating the myocytes in 10 μM Blebbistatin (Calbiochem, Gibbstown, NJ) for the duration of the experiment.47 Using a 40x objective (Zeiss EC Plan-NEOFLUAR, numerical aperture 1.3), un-paced and paced electrophysiological data were collected from the tissue on the film that had remained attached to the substrate during the contraction experiments (Fig. 5a–b). To collect data, the films were illuminated with excitation light with wave lengths of 530 nm to 558 nm for two seconds. The emitted light, long-pass filtered at 615 nm, was focused on a hexagonal array of 1 mm diameter optical fibers. The array consisted of 124 such optical fibers coupled to photodiodes, which converted the photocurrent to voltages that were amplified and digitalized at 5 Hz at 12-bit resolution (Fig. 5c). To analyze the electrophysiological data, the signals were low-pass filtered at 100 Hz and normalized. Activation times were defined as the time it took to achieve half of the maximal action potential amplitude (Fig. 5f).
Conclusion
We reported the development of a novel chip design for in vitro cardiac contractility and pharmacological studies. Previous technologies14,16,23,24 are capable of providing correlations between single myocyte electrophysiological and contraction properties, but they cannot be used to garner tissue scale data. This need is addressed by the “heart on the chip” technology, which is used in conjunction with cell culture techniques that can recapitulate healthy, diseased, and developing cardiac tissues. Our technology is ideal to study the two factors that can contribute to the force produced by in vitro cardiac tissues: the alignment of the contractile apparatus and the gene expression profile, which is affected by the shape and deformation of cellular structures.48 In sum, we have demonstrated the chip to be a platform for quantification of stress, electrophysiology, and cellular architecture.
Supplementary Material
Acknowledgments
This work has been supported by the Nanoscale Science and Engineering Center of the National Science Foundation under NSF award number PHY-0117795, the Harvard Materials Research Science and Engineering Center under NSF award number DMR-0213805, the Harvard Stem Cell Institute and GlaxoSmithKline, NIH/NINDS grant 1 U01 NS073474-01, and NIH grant 1 R01 HL079126. We are grateful to the Center of Nanoscale Systems at Harvard University for the use of their cleanroom facilities, to Mark D. Brigham for help with the OMS experimental design, and to Alexander P. Nesmith for developing the brick patterned stamps.
Footnotes
Author Contributions: AG and KKP designed the chip and experimental protocols. AG made the chips and executed the experiments. PWA developed stress analysis algorithm for MTFs. MLM provided primary cell culture support. AG and KKP wrote the manuscript.
Electronic supplementary information (ESI) available. See DOI: 10.1039/c1lc20557a
References
- 1.Laverty HG, Benson C, Cartwright EJ, Cross MJ, Garland C, Hammond T, Holloway C, McMahon N, Milligan J, Park K, Pirmohamed M, Pollard C, Radford J, Roome N, Sager P, Singh S, Suter T, Suter W, Trafford A, Volders PGA, Wallis R, Weaver R, York M, Valentin JP. Br J Pharmacol. 2011 doi: 10.1111/j.1476-5381.2011.01255.x. [DOI] [PMC free article] [PubMed] [Google Scholar]
- 2.Streeter DD, Jr, Spotnitz HM, Patel DP, Ross J, Sonnenblick EH. Circ Res. 1969;24:339–347. doi: 10.1161/01.res.24.3.339. [DOI] [PubMed] [Google Scholar]
- 3.Chen JJ, Liu W, Zhang HY, Lacy L, Yang XX, Song SK, Wickline SA, Yu X. Am J Physiol-Heart Circul Physiol. 2005;289:H1898–H1907. doi: 10.1152/ajpheart.00041.2005. [DOI] [PubMed] [Google Scholar]
- 4.Vendelin M, Bovendeerd P, Engelbrecht J, Arts T. Am J Physiol. 2002;283:1072–1081. doi: 10.1152/ajpheart.00874.2001. [DOI] [PubMed] [Google Scholar]
- 5.Roberts DE, Scher AM. Circ Res. 1982;50:342–351. doi: 10.1161/01.res.50.3.342. [DOI] [PubMed] [Google Scholar]
- 6.Parker KK, Tan J, Chen CS, Tung L. Circ Res. 2008;103:340–342. doi: 10.1161/CIRCRESAHA.108.182469. [DOI] [PMC free article] [PubMed] [Google Scholar]
- 7.Adams WJ, Pong T, Geisse NA, Sheehy SP, Diop-Frimpong B, Parker KK. J Comput Aided Mat Des. 2007;14:19–29. [Google Scholar]
- 8.Grosberg A, Kuo PL, Guo CL, Geisse NA, Bray MA, Adams WJ, Sheehy SP, Parker KK. PLoS Comput Biol. 2011;7 doi: 10.1371/journal.pcbi.1001088. [DOI] [PMC free article] [PubMed] [Google Scholar]
- 9.Pong T, Adams WJ, Bray M-A, Feinberg AW, Sheehy SP, Werdich AA, Parker KK. Exp Biol Med. 2011;236:366–373. doi: 10.1258/ebm.2010.010239. [DOI] [PMC free article] [PubMed] [Google Scholar]
- 10.Bursac N, Parker KK, Iravanian S, Tung L. Circ Res. 2002;91:E45–E54. doi: 10.1161/01.res.0000047530.88338.eb. [DOI] [PubMed] [Google Scholar]
- 11.Entcheva E, Bien H, Yin LH, Chung CY, Farrell M, Kostov Y. Biomaterials. 2004;25:5753–5762. doi: 10.1016/j.biomaterials.2004.01.024. [DOI] [PubMed] [Google Scholar]
- 12.Addae-Mensah KA, Wikswo JP. Exp Biol Med. 2008;233:792–809. doi: 10.3181/0710-MR-278. [DOI] [PMC free article] [PubMed] [Google Scholar]
- 13.Jacot JG, McCulloch AD, Omens JH. Biophys J. 2008;95:3479–3487. doi: 10.1529/biophysj.107.124545. [DOI] [PMC free article] [PubMed] [Google Scholar]
- 14.Cheng W, Klauke N, Smith G, Cooper JM. Electrophoresis. 2010;31:1405–1413. doi: 10.1002/elps.200900579. [DOI] [PubMed] [Google Scholar]
- 15.Cheng W, Klauke N, Sedgwick H, Smith GL, Cooper JM. Lab on a Chip. 2006;6:1424–1431. doi: 10.1039/b608202e. [DOI] [PubMed] [Google Scholar]
- 16.Tanaka Y, Morishima K, Shimizu T, Kikuchi A, Yamato M, Okano T, Kitamori T. Lab on a Chip. 2006;6:230–235. doi: 10.1039/b512099c. [DOI] [PubMed] [Google Scholar]
- 17.Zhao Y, Zhang X. Sens Actuator A-Phys. 2006;127:216–220. [Google Scholar]
- 18.Zhao Y, Lim CC, Sawyer DB, Liao RL, Zhang X. Cell Motil Cytoskeleton. 2007;64:718–725. doi: 10.1002/cm.20218. [DOI] [PubMed] [Google Scholar]
- 19.Kim K, Taylor R, Sim JY, Park SJ, Norman J, Fajardo G, Bernstein D, Pruitt BL. Micro Nano Lett. 2011;6:317–322. [Google Scholar]
- 20.Sugiura S, Yasuda S, Yamashita H, Kato K, Saeki Y, Kaneko H, Suda Y, Nagai R, Sugi H. In: Molecular and Cellular Aspects of Muscle Contraction. Sugi H, editor. Kluwer Academic/Plenum Publ; New York: 2003. pp. 381–387. [Google Scholar]
- 21.Nishimura S, Yasuda S-i, Katoh M, Yamada KP, Yamashita H, Saeki Y, Sunagawa K, Nagai R, Hisada T, Sugiura S. Am J Physiol Heart Circ Physiol. 2004;287:H196–202. doi: 10.1152/ajpheart.00948.2003. [DOI] [PubMed] [Google Scholar]
- 22.Sugiura S, Nishimura S, Yasuda S, Hosoya Y, Katoh K. Nature Protocols. 2006;1:1453–1457. doi: 10.1038/nprot.2006.241. [DOI] [PubMed] [Google Scholar]
- 23.Werdich AA, Lima EA, Ivanov B, Ges I, Anderson ME, Wikswo JP, Baudenbacher FJ. Lab on a Chip. 2004;4:357–362. doi: 10.1039/b315648f. [DOI] [PubMed] [Google Scholar]
- 24.Ganitkevich V, Reil S, Schwethelm B, Schroeter T, Benndorf K. Circ Res. 2006;99:165. doi: 10.1161/01.RES.0000232321.89714.0e. [DOI] [PubMed] [Google Scholar]
- 25.Kaneko T, Kojima K, Yasuda K. The Analyst. 2007;132:892–898. doi: 10.1039/b704961g. [DOI] [PubMed] [Google Scholar]
- 26.Linder P, Trzewik J, Rueffer M, Artmann GM, Digel I, Kurz R, Rothermel A, Robitzki A, Artmann AT. Med Biol Eng Comput. 2010;48:59–65. doi: 10.1007/s11517-009-0552-y. [DOI] [PubMed] [Google Scholar]
- 27.Park J, Ryu J, Choi SK, Seo E, Cha JM, Ryu S, Kim J, Kim B, Lee SH. Anal Chem. 2005;77:6571–6580. doi: 10.1021/ac0507800. [DOI] [PubMed] [Google Scholar]
- 28.Kim J, Park J, Na K, Yang S, Baek J, Yoon E, Choi S, Lee S, Chun K, Park S. J Biomech. 2008;41:2396–2401. doi: 10.1016/j.jbiomech.2008.05.036. [DOI] [PubMed] [Google Scholar]
- 29.Feinberg AW, Feigel A, Shevkoplyas SS, Sheehy S, Whitesides GM, Parker KK. Science. 2007;317:1366–1370. doi: 10.1126/science.1146885. [DOI] [PubMed] [Google Scholar]
- 30.Alford PW, Feinberg AW, Sheehy SP, Parker KK. Biomaterials. 2010;31:3613–3621. doi: 10.1016/j.biomaterials.2010.01.079. [DOI] [PMC free article] [PubMed] [Google Scholar]
- 31.Bray MA, Sheehy SP, Parker KK. Cell Motil Cytoskel. 2008;65:641–651. doi: 10.1002/cm.20290. [DOI] [PMC free article] [PubMed] [Google Scholar]
- 32.Bol M, Reese S, Parker KK, Kuhl E. Comput Mech. 2009;43:535–544. [Google Scholar]
- 33.Effron M, Bhatnagar G, Spurgeon H, Ruano-Arroyo G, Lakatta E. Circ Res. 1987;60:238. doi: 10.1161/01.res.60.2.238. [DOI] [PubMed] [Google Scholar]
- 34.Lakatta E, Gerstenblith G, Angell C, Shock N, Weisfeldt M. J Clin Invest. 1975;55:61. doi: 10.1172/JCI107918. [DOI] [PMC free article] [PubMed] [Google Scholar]
- 35.Fujiwara M, Kuchii M, Shibata S. Eur J Pharmacol. 1972;19:1–11. doi: 10.1016/0014-2999(72)90070-2. [DOI] [PubMed] [Google Scholar]
- 36.Gillis AM, Fast VG, Rohr S, Kleber AG. Circ Res. 1996;79:676–690. doi: 10.1161/01.res.79.4.676. [DOI] [PubMed] [Google Scholar]
- 37.Rohr S, Scholly DM, Kleber AG. Circ Res. 1991;68:114–130. doi: 10.1161/01.res.68.1.114. [DOI] [PubMed] [Google Scholar]
- 38.Geisse NA, Sheehy SP, Parker KK. In Vitro Cell Dev-An. 2009;45:343–350. doi: 10.1007/s11626-009-9182-9. [DOI] [PubMed] [Google Scholar]
- 39.Rodriguez EK, Hoger A, McCulloch AD. J Biomech. 1994;27:455–467. doi: 10.1016/0021-9290(94)90021-3. [DOI] [PubMed] [Google Scholar]
- 40.Ramasubramanian A, Taber LA. Biomechanics and Modeling in Mechanobiology. 2008;7:77–91. doi: 10.1007/s10237-007-0077-y. [DOI] [PMC free article] [PubMed] [Google Scholar]
- 41.Hong L, Wan YF, Jain A. IEEE Trans Pattern Anal Mach Intell. 1998;20:777–789. [Google Scholar]
- 42.Kovesi P. MATLAB and octave functions for computer vision and image processing [Google Scholar]
- 43.Bray M-AP, Adams WJ, Geisse NA, Feinberg AW, Sheehy SP, Parker KK. Biomaterials. 2010;31:5143–5150. doi: 10.1016/j.biomaterials.2010.03.028. [DOI] [PMC free article] [PubMed] [Google Scholar]
- 44.Hamley IW. Introduction to soft matter: synthetic and biological self-assembling materials. John Wiley & Sons; Chichester, England; Hoboken, NJ: 2007. [Google Scholar]
- 45.Volfson D, Cookson S, Hasty J, Tsimring LS. Proc Natl Acad Sci USA. 2008;105:15346–15351. doi: 10.1073/pnas.0706805105. [DOI] [PMC free article] [PubMed] [Google Scholar]
- 46.Thomas SP, Bircher-Lehmann L, Thomas SA, Zhuang JP, Saffitz JE, Kleber AG. Circ Res. 2000;87:467–473. doi: 10.1161/01.res.87.6.467. [DOI] [PubMed] [Google Scholar]
- 47.Fedorov VV, Lozinsky IT, Sosunov EA, Anyukhovsky EP, Rosen MR, Balke CW, Efimov IR. Heart Rhythm. 2007;4:619–626. doi: 10.1016/j.hrthm.2006.12.047. [DOI] [PubMed] [Google Scholar]
- 48.Chung C-y, Bien H, Sobie EA, Dasari V, McKinnon D, Rosati B, Entcheva E. The FASEB Journal. 2011;25:851–862. doi: 10.1096/fj.10-168625. [DOI] [PMC free article] [PubMed] [Google Scholar]
Associated Data
This section collects any data citations, data availability statements, or supplementary materials included in this article.