Abstract
This paper extends Jones’ popular electrostatic repulsion based algorithm for distribution of single-shell Q-space samples in two fundamental ways. The first alleviates the single-shell requirement enabling full Q-space sampling. Such an extension is not immediately obvious since it requires distributing samples evenly in 3 dimensions. The extension is as elegant as it is simple: Add a container volume of the desired shape having a constant charge density and a total charge equal to the negative of the sum of the moving point charges. Results for spherical and cubic charge containers are given. The second extension concerns the way distances between sample point are measured. The Q-space samples represent orientation, rather than direction and it would seem appropriate to use a metric that reflects this fact, e.g. a tensor metric. To this end we present a means to employ a generalized metric in the optimization. Minimizing the energy will result in a 3-dimensional distribution of point charges that is uniform in the terms of the specified metric. The radically different distributions generated using different metrics pinpoints a fundamental question: Is there an inherent optimal metric for Q-space sampling? Our work provides a versatile tool to explore the role of different metrics and we believe it will be an important contribution to further the continuing debate and research on the matter.
Keywords: diffusion MRI, Q-space sampling, electrostatic forces
1 Introduction
In the effort of extracting meaningful microstructural properties from diffusion weighted MRI (dMRI) it becomes clear that a large number of acquisitions are required to get the full extent of the information [1]. The discussion concerning optimal q-space sampling strategies has been lively from the very start of diffusion imaging [1–4, 8–10]. Among the most well known approaches is the electrostatic repulsion algorithm suggested by Jones et. al. [5]. Jones’ algorithm finds a ‘uniform’ single-shell distribution of Q-space sample points by finding the lowest electrostatic energy of a system consisting of N antipodal charge pairs on the surface of a sphere. However, when aiming for a full 3-dimensional reconstruction of the diffusion propagator the sample points should be evenly distributed in the targeted 3-dimensional Q-space. Such a solution can not be attained using the traditional electrostatic repulsion approach since alleviating the single-shell constraint will make the sample distribution expand indefinitely.
Further, it is doubtful if the Euclidean vector difference metric traditionally used is the best possible choice. The Q-space samples actually represent orientation, rather than direction. For this reason it would seem more appropriate to consider charges moving in, for example, an outer product tensor space.
In this paper we present a novel and general framework allowing the generation of full 3-dimensional Q-space sample distributions. Our framework extends the electrostatic charge distribution model in two fundamental ways:
Enabling a user specified definition of the 3-dimensional space to be sampled.
Enabling a user specified definition of the distance metric to be used.
2 Theory
Jones’ algorithm finds a ‘uniform’ distribution of q-space sample points by finding the lowest electrostatic energy of a system consisting of N antipodal equal charge pairs on the surface of a sphere. The system energy takes the form:
| (1) |
where n, m ∈ [1 : N]. See figure 1 left for our simulation result using 500 sample points. An extension beyond the single-shell is not immediately obvious since a full Q-space sampling requires samples that are evenly distributed in 3 dimensions.
Fig. 1.
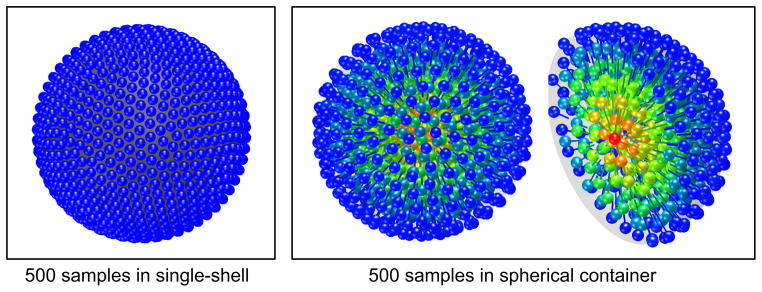
Results from optimization of a 500 sample positions in Q-space. Classic Jones single-shell electrostatic repulsion (left). Electrostatic forces with spherical container (right). The rightmost plot shows only half of the sphere to display the interior sampling. Colors indicate distance to the container center, Red = 0, Blue = 1.
Charged Containers for 3D Sampling
To extend the sample distribution generation to cover a full 3d Q-space simply add a volume of the desired shape, having an evenly distributed total charge equal to the negative of the sum of the moving point charges. This volume will then act as a container for the point charges. To add the corresponding energy term we need to find the added potential field. The sphere is the simplest possible container and one of the very few cases for which a simple closed form interior potential function is known:
| (2) |
where r is the distance from the container center. Note, however, that it is possible to specify any shape of the negatively charged volume as long as a good approximation of the spatial gradient can be found, see section 3. Alleviating the sphere surface requirement and adding the container contribution to the traditional energy function yields:
| (3) |
Here the ‘self energy’ contribution from the individual antipodal pairs have been excluded from the summation (n ≠ m). This is consistent with the view that the sole purpose of the pair construction is to implement an appropriate metric, i.e. the antipodal pair points do not repel each other. Minimizing this energy function for 500 charge pairs we get the solution shown in figure 1 right.
Tensor Metrics for Distribution of Q-space Samples
While the energy definition of eq (1) works well in the intended single-shell context a different definition is natural for a fully 3-dimensional Q-space sampling system. The Q-space samples represent orientation, rather than direction. For this reason it would seem more appropriate to consider charges moving in an outer product tensor space. To enable the use of different metrics we present a means to employ a generalized metric in the optimization. Thus, each charge act as if positioned in a higher dimensional space that naturally represents the concept of orientation [6]. To this end we introduce the following general tensor related metric:
| (4) |
where r = ||x||, , wr and wφ are weighting factors. The parameters α, β and γ are exponents controlling radial and angular behavior. For clarity we will in the following sometimes omit the variables (xm, xn). The following examples demonstrate the generality of the proposed metric. Inserting wr = wφ = α = β = γ = 1 and using the fact that gives:
| (5) |
which show that this parameter setting corresponds to the standard Euclidean metric. A number of other useful metrics are also instances of this general metric. For example: wr = wφ = 1 and α = β = γ = 2 gives the outer product tensor metric,
. wr = wφ = 1 and α = β = γ = N gives the N:th order outer product tensor metric,
. Using wr = 1, wφ = 2 and α = β = γ = 2 gives the double angle metric corresponding to a traceless outer product tensor,
. See figure 2 for visualizations of 4 different metrics. Regardless of the metric used the potential caused by a point charge at position xn at a position xm can, in analogy with the classic electrostatic potential, be defined in terms of the distance,
 , as:
, as:
| (6) |
Fig. 2.
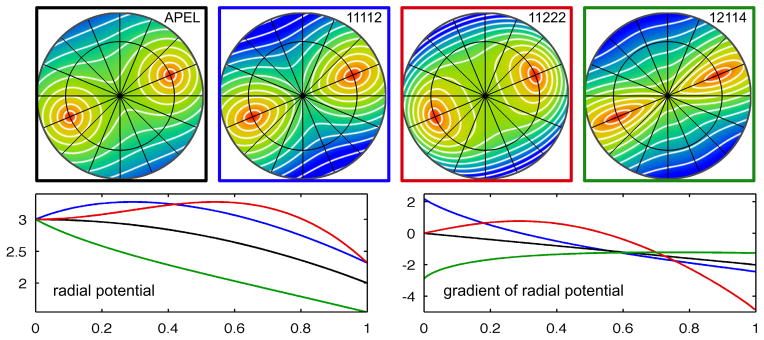
Four distance maps generated by the metrics used in the experiments (top). The plots show distances from a reference point positioned at the center of the red area. Due to symmetry the 3D distance map is rotation invariant, i.e. the distance maps on any plane through the origin and the reference point are identical. The white lines are iso-distance lines (iso-surfaces in 3D). Note the variation in radial/angular metric ratio around the reference point, this ratio links strongly to the shell forming behavior shown in figure 3. The colored curves show container potentials (lower left) and the corresponding gradients (lower right) as a function of radius for the same four metrics. The curves have the same color as the frame of the corresponding distance map: APEL (black), T-11112 (blue), T-11222 (red) and T-12114 (green).
The electrostatic force acting on the charge at xm, is calculated by differentiation of the potential field with respect to xm.
| (7) |
From equation (6) we find that the first partial derivative is given by:
| (8) |
The second partial derivative can be expressed as a sum of the partial derivatives of the radial and angular parts, and .
| (9) |
Before carrying out the differentiation it may be helpful to rewrite the distance definition, equation (4), so that standard differentiation rules can be directly applied.
| (10) |
The radial part is relatively straightforward and carrying out the differentiation we get:
| (11) |
The angular part requires a bit longer derivation which is left to the devoted reader. The end result expressed in terms of r, x̂ and cos(φ) is:
| (12) |
Electrostatic Force Field from Charged Container
The force field caused by a charged container (Ωc) with a certain local charge density (qc) can, in any metric (
 ), be attained through integration over all charges followed by spatial differentiation. Using the classic electrostatic single charge potential field function, (r−1), with the distance given by our generalized metric we get:
| (13) |
approximation of numerically computed values was found to perform well. Although a spatially varying charge density, qc, can easily be specified the density was, in order to achieve a uniform sample distribution, set to be spatially constant in all experiments reported here. See figure 2 for the results obtained using a spherical container and four different metrics:
| APEL | Antipodal Electrostatic |
|---|---|
| T-11112 | wr =1, wφ =1, α =1, β =1, γ =2 |
| T-11222 | wr =1, wφ =1, α =2, β =2, γ =2 |
| T-12114 | wr =1, wφ =2, α =1, β =1, γ =4 |
3 Results
The energy minimization was performed using a simulated annealing inspired gradient search algorithm. Search times are roughly proportional to the square of the number of tensor charges, higher accuracy will of course require longer search times. Typically finding a low energy point for a 200-samples system can be done in less than a minute using a standard laptop.
Natural Shells
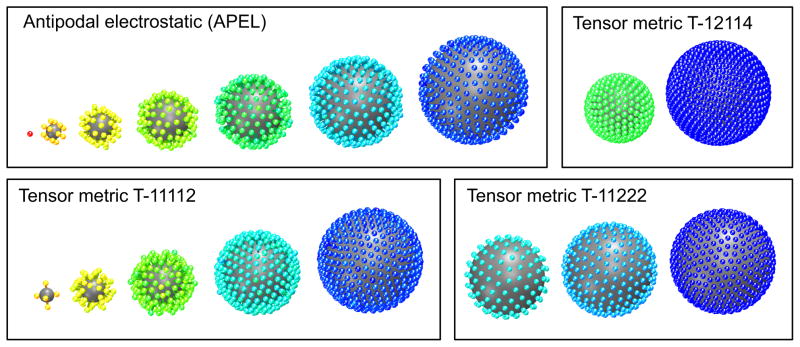
A consistent and compelling feature of the container based minimum energy solutions is that the sample point distributions, regardless of the number of charges used, takes the form of shells. The number of shells, the radial position and number of charges in each shell is, however, highly dependent on the metric used. Figure 3 shows the resulting distribution of 500 sample points using four different metrics. For each metric case below the number of samples per shell and the mean shell radii are given in brackets.
Fig. 3.
Four examples of the forming of shells that occur using the charged container approach. The shells have been segmented and are shown separately from the center out, left to right. The color indicate sample radius. The upper left result is also shown in a non-segmented version in figure 1 right. All examples have 500 sample points. The plots clearly show that the different metrics gives rise to radically different sample distributions and shell forming behavior. Intuitively it makes sense that if the ratio angular/radial distance increases (see figure 2), i.e. the surface area of a sphere increases relative to it’s radius, fewer shells with more samples in each will be formed.
| APEL - 7 shells | # (1, 7, 25, 53, 87, 135, 192) | radii (0, .19, .33, .48, .63, .78, .93) |
| T-11112 - 5 shells | # (3, 24, 78, 150, 245) | radii (.19, .32, .51, .70, .88) |
| T-11222 - 3 shells | # (86, 153, 261) | radii (.77, .87, .97) |
| T-12114 - 2 shells | # (135, 365) | radii (.52, .79) |
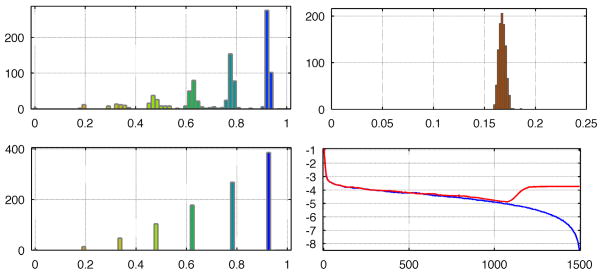
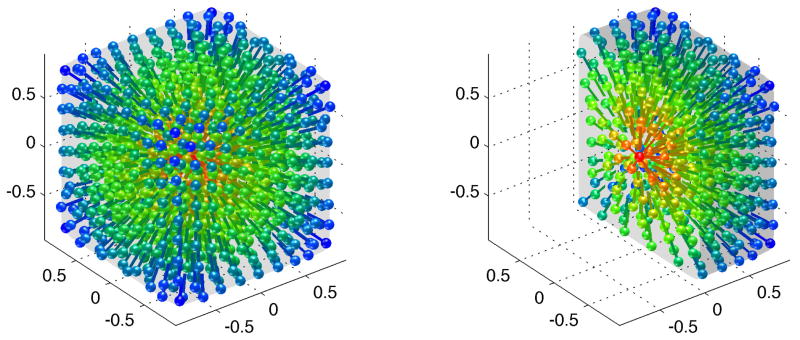
The shells are naturally ‘soft’, i.e. the distribution of radii in each shell has a certain width due to interaction with other shells, see figure 4. Adding a ‘shelling’ forming force will produce precise shells but will increase the system energy showing that the ‘soft’ shells provide a more even sample distribution, see figure 4. Figure 4 also includes a histogram of the the distances to closest neighbors, the standard deviation is only 2% of the mean distance showing that the distribution of samples is indeed very uniform. Figure 5 shows an example using a uniformly charged cube as the container. The second term of eq(3) was here replaced by a sixth order polynomial to approximate the interior potential [7]. The cubeness of the charge distribution is clearly visible. Interestingly, a tendency to form spherical shells is still present for the inner parts of the cube.
Fig. 4.
Plots displaying different features of the optimization of a 500 sample point distribution using the antipodal electrostatic metric (APEL). Histogram of number of samples vs radius, the forming of shells is clearly visible (top left). Histogram of samples vs distance to closest neighbors, the narrow peak shows that the distribution is highly uniform in Q-space (top right). Histogram of samples vs radius after the shells have been forced to become radially thin (bottom left). The 10-logarithm of the system energy vs number of iterations for two separate optimization runs (bottom right). The blue curve shows a typical run. The red curve shows a run where a gradually increasing extra force was applied to produce thin shells. Note that the end results has more than 4 orders of magnitude higher energy which shows that adding a ‘shelling’ forming force will produce precise shells but will increase the system energy considerably, i.e. the ‘soft’ shells provide a more even sample distribution.
Fig. 5.
Optimization result using a cubic charge container and the antipodal electrostatic metric (APEL). The rightmost plot shows only half of the cube to display the interior sampling.
4 Conclusions
We have presented a novel method for generating Q-space sample distributions that are uniform in a user specified metric and cover a user specified part of q-space. Whether to sample linearly or quadratically in Q-space radius is, for example, determined by one parameter (α = β ∈ {1, 2}). We have demonstrated the feasibility for a range of different cases. The results are interesting from several points of view. There is a marked tendency for the samples to group in shells. This fact indicates that the present work provides an interesting alternative to recently proposed shell-interaction schemes [4, 8–10]. It may sometimes be preferable to distribute the Q-samples in a cube since much higher Q-values can then in practice be attained towards the corners [11]. We have shown that the charged container approach produces good results also for this case. Further, the distribution attained for the cube case is far from Cartesian, this may be an advantage in a sparse reconstruction, e.g. compressed sensing, setting.
Perhaps the most important aspect of our contribution is that it provides a new and powerful tool in future investigations concerning Q-space sampling. Since scanner time will always be an issue every improvement of sampling efficiency will ultimately be of great clinical value.
Acknowledgments
The authors acknowledge the Swedish Research Council grants 2011-5176, 2012-3682 and NIH grants R01MH074794, P41RR013218, and P41EB015902.
Contributor Information
Hans Knutsson, Email: knutte@imt.liu.se.
Carl-Fredrik Westin, Email: westin@bwh.harvard.edu.
References
- 1.Assaf Y, Freidlin RZ, Rohde GK, Basser PJ. New modeling and experimental framework to characterize hindered and restricted water diffusion in brain white matter. Magn Reson Med. 2004;52(5):965–978. doi: 10.1002/mrm.20274. [DOI] [PubMed] [Google Scholar]
- 2.Wu YC, Alexander AL. Hybrid diffusion imaging. Neuroimage. 2007;36(3):617–629. doi: 10.1016/j.neuroimage.2007.02.050. [DOI] [PMC free article] [PubMed] [Google Scholar]
- 3.Alexander DC. A general framework for experiment design in diffusion MRI and its application in measuring direct tissue-microstructure features. Magn Reson Med. 2008;60(2):439–448. doi: 10.1002/mrm.21646. [DOI] [PubMed] [Google Scholar]
- 4.Westin CF, Pasternak O, Knutsson H. Rotationally invariant gradient schemes for diffusion MRI. Proc of the ISMRM Annual Meeting (ISMRM 2012) 2012:3537. [Google Scholar]
- 5.Jones DK, Simmons A, Williams SCR, Horsfield MA. Non-invasive assessment of axonal fiber connectivity in the human brain via diffusion tensor MRI. Magn Reson Med. 1999;42:37–41. doi: 10.1002/(sici)1522-2594(199907)42:1<37::aid-mrm7>3.0.co;2-o. [DOI] [PubMed] [Google Scholar]
- 6.Knutsson H. Representing local structure using tensors. SCIA; Oulu, Finland: 1989. pp. 244–251. 1989. [Google Scholar]
- 7.Hummer G. Electrostatic potential of a homogeneously charged square and cube in two and three dimensions. 1996;36(3):285–291. [Google Scholar]
- 8.Caruyer E, Cheng J, Lenglet C, Sapiro G, Jiang T, Deriche R. Optimal Design of Multiple Q-shells experiments for Diffusion MRI. MICCAI Workshop CDMRI. 2011 [Google Scholar]
- 9.Merlet S, Caruyer E, Deriche R. Impact of radial and angular sampling on multiple shells acquisition in diffusion MRI. Med Image Comput Comput Assist Interv. 2011;14(Pt 2):116–123. doi: 10.1007/978-3-642-23629-7_15. [DOI] [PubMed] [Google Scholar]
- 10.Ye W, Portnoy S, Entezari A, Blackband SJ, Vemuri BC. An Efficient Interlaced Multi-shell Sampling Scheme for Reconstruction of Diffusion Propagators. IEEE Trans Med Imaging. 2012;31(5):1043–1050. doi: 10.1109/TMI.2012.2184551. [DOI] [PMC free article] [PubMed] [Google Scholar]
- 11.Scherrer B, Warfield SK. Parametric Representation of Multiple White Matter Fascicles from Cube and Sphere Diffusion MRI. PLoS ONE. 2012;7(11):1–20. doi: 10.1371/journal.pone.0048232. [DOI] [PMC free article] [PubMed] [Google Scholar]


