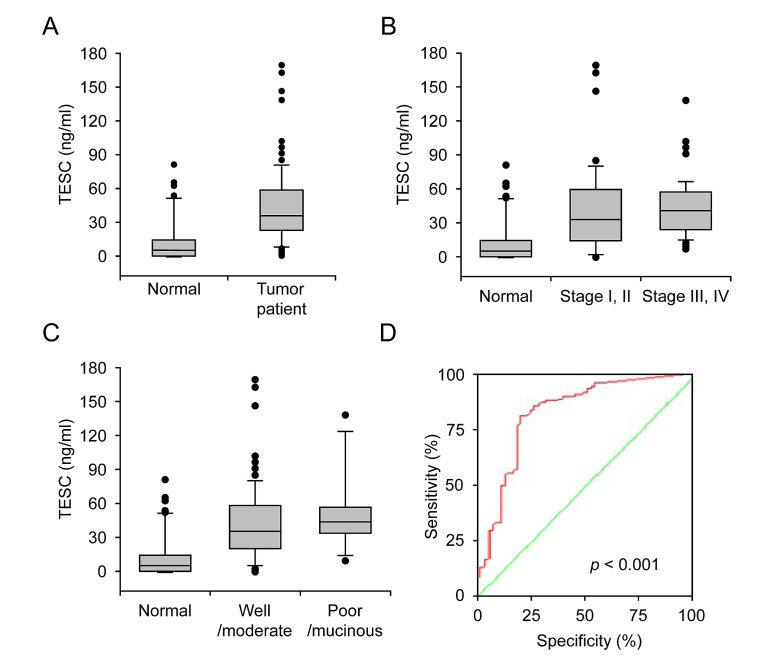
Figure 3. Increased serum concentration of TESC in colorectal cancer patients.
(A) Serum TESC concentration in control subjects (n = 54) and patients with CRC (n = 118). (B) Serum concentration of TESC in the control samples (normal), early stage colorectal cancer (stages I and II) and late stage colorectal cancer stage (stages III and IV). (C) Serum concentration of TESC in control samples (normal), well/moderately differentiated CRC, and poorly differentiated/mucinous CRC. (D) ROC curves for TESC in CRC samples. A test with perfect discrimination has a ROC plot that passes through the upper left corner (100% sensitivity, 100% specificity; green line). Therefore, the closer the ROC plot is to the upper left corner, the higher the overall accuracy of the test.

