

Abstract
For this report, we analyzed protein secondary structures in relation to the statistics of three nucleotide codon positions. The purpose of this investigation was to find which properties of the ribosome, tRNA or protein level, could explain the purine bias (Rrr) as it is observed in coding DNA. We found that the Rrr pattern is the consequence of a regularity (the codon structure) resulting from physicochemical constraints on proteins and thermodynamic constraints on ribosomal machinery. The physicochemical constraints on proteins mainly come from the hydropathy and molecular weight (MW) of secondary structures as well as the energy cost of amino acid synthesis. These constraints appear through a network of statistical correlations, such as (i) the cost of amino acid synthesis, which is in favor of a higher level of guanine in the first codon position, (ii) the constructive contribution of hydropathy alternation in proteins, (iii) the spatial organization of secondary structure in proteins according to solvent accessibility, (iv) the spatial organization of secondary structure according to amino acid hydropathy, (v) the statistical correlation of MW with protein secondary structures and their overall hydropathy, (vi) the statistical correlation of thymine in the second codon position with hydropathy and the energy cost of amino acid synthesis, and (vii) the statistical correlation of adenine in the second codon position with amino acid complexity and the MW of secondary protein structures. Amino acid physicochemical properties and functional constraints on proteins constitute a code that is translated into a purine bias within the coding DNA via tRNAs. In that sense, the Rrr pattern within coding DNA is the effect of information transfer on nucleotide composition from protein to DNA by selection according to the codon positions. Thus, coding DNA structure and ribosomal machinery co-evolved to minimize the energy cost of protein coding given the functional constraints on proteins.
Keywords: genomics, ancestral codon, RNY, purine bias, secondary structure, helix, sheet, turn coil, ribosome, translation, energy cost
Introduction
Previous base composition investigations using codon positions showed that the frequency of purine is higher in the first than in the second and third codon positions.1–6 Because this bias demonstrates statistical regularity across codons, it is called the purine bias.4 The purine bias is a primary determinant of coding sequences (CDSs) and is universal to the biosphere. It was first described under the acronym RNY and dubbed the “ancestral codon” by Shepherd.1
The characterization of the purine bias in CDSs is important because it is the only sufficiently robust signal for assisting in gene searches and annotations within genome investigations. Three variables are necessary to describe a CDS as follows: the stop codon frequency, the purine bias, and the gene expression level.6 This is why gene tagging of transcriptome sequences is easier than direct tagging of genome sequences.6 Exons can be easily detected via homology searches by using coding open reading frames (ORFs) identified in transcriptome sequences and comparing the results to genome sequences. Introns are often discovered as a consequence of exon searches using EST homologies.7,8 Similarly, the likelihood of detecting the promoter region increases when it is close to a CDS.9 In addition, because the base composition of introns and intergenic sequences is correlated to those of CDSs,10 one can conclude that the mechanism acting on the base composition of CDSs as a consequence of their evolution also affects the base composition of other genome structures functionally linked to CDSs.11 Because genome organization appears to be a consequence of CDS evolution and because purine bias is conserved across the whole biosphere, it is natural to conclude that purine bias is among the main determinants of genome structure and evolution. A consequence of this observation is that purine bias results from a process that is maintained from the very beginning of cellular life on earth. Because purine bias is not observed in introns, one may exclude any polymerase involvement in its genesis. As a consequence, purine bias may result in some specificity related to ribosome machinery or some functional constraints at the protein level.
The ribosome machinery is a huge (2.5 MDa) enzymatic ribonucleoprotein complex that uses mRNA as a template and aminoacyl-transfer RNAs (aminoacyl-tRNAs) as substrates for catalyzing protein synthesis. Prokaryotic ribosomes consist of a large (50S) and a small (30S) subunit, which together make up the 70S particle; when considered together, their eukaryotic counterparts are the 60S and 40S subunits or the 80S ribosome. The 50S subunit consists of 23S RNA, 5S RNA, and approximately 30 proteins; the 30S subunit consists of 16S RNA and approximately 20 proteins. The interface between the 30S and 50S subunits consists mainly of RNA. The mRNA binds in a cleft of the 30S subunit, where its codons interact with the tRNA anticodons.
There are three binding sites in the 50S subunit for tRNA, that is, the A-site that binds the incoming aminoacyl-tRNA, the P-site that attaches the peptidyl-tRNA to the nascent polypeptide chain, and the E-site to which the deacylated P-site tRNA moves after peptide-bond formation before its ejection from ribosome.12–14 Among the factors that affect ribosome performance in bacteria is the efficiency—accuracy trade-off in mRNA translation in which the overall codon reading accuracy competes with the growth rate. As a result, mutants with hyper-accurate and error-prone ribosomes grow more slowly than wild type. The second codon position seems to be more tightly controlled than the other two codon positions for the same type of mismatch, which is expected from the fact that the second codon position plays the most important role in determining the chemical properties of incorporated amino acids.15 The 30S ribosomal subunit has a decoding center where it “inspects” the codon—anticodon pairing in much the same way that an enzyme senses the precise pairing of its substrate.16 Aminoacyl-tRNA (which is made up of the tRNA and its cognate amino acid) is initially brought into the ribosome in a complex with EF-Tu and GTP. Incorrect tRNAs can dissociate before and after they are released by EF-Tu, with the overall selectivity being just as high as the product of both selection steps.17 The experimental evidence for proofreading was revealed with the finding that near-cognate tRNAs (which contain a single subtle mismatch between the codon and anticodon) require more hydrolyzed GTPs per amino acid to be incorporated relative to the cognate case. Pre-steady-state kinetic experiments that dissected the various steps in tRNA selection showed that the forward rates of GTPase activation and accommodation (movement of tRNA into the peptidyl transferase center) were dramatically higher for the cognate than for the near-cognate tRNA. This finding suggested that cognate tRNA more efficiently induced conformational changes into a productive form that accelerated GTPase activation or accommodation in the ribosome.13 In particular, these conformational changes involve three universally conserved bases (A1492, A1493, and G530 in the case of Escherichia coli) for 16S rRNA. These bases lined the minor groove of the codon—anticodon helix in such a way that the geometry of base pairs is sensed at the first two positions, but not at the wobble position, providing a structural rationale for the wobble hypothesis.18 In their new conformations, A1493 and A1492 interact with the first and second base pairs of the codon—anticodon helix, respectively, whereas G530 interacts with both the second anticodon position and the third codon position. Because of these induced changes, the first two base pairs of the codon—anticodon helix are closely monitored by the ribosome in a way in which it would be possible to discriminate between Watson and Crick base pairings and mismatches, whereas the environment at the “wobble” position appears to be suited for accommodating other base-pairing geometries. In addition to having proper codon—anticodon base pairing, there are a number of cases in which tRNA decoding requires the specific modification of bases in the anticodon loop.19
Considering the functional constraints on proteins, the physicochemical properties associated with protein structures have been shown to be strongly dependent on the amino acid composition and particularly on amino acid alternation according to their hydropathy.20–24 The alternation of hydropathy values along protein sequences is correlated with specific choices in the second codon position in corresponding CDSs,21,25 which means that the codon structure reflects the physicochemical properties of protein secondary structures. Actually, it has been proposed that the genetic code originated from the interactions between codons or anticodons and amino acids, which themselves depend on the physicochemical properties of amino acids and anticodons.25 In addition, the hydrophilic amino acids tend to be rich in A in the second codon position (A2) and the hydrophobic amino acids tend to be rich in T in the second codon position (T2),26 which is expected to influence the protein folding pattern.24
Among the hypotheses that were proposed to explain CDS nucleotide periodicity, there are (i) rDNA periodicity,27 (ii) codon—anticodon stability,28 (iii) selection for translation efficiency,29,30 and (iv) protein secondary structures.21,24,25
Here, we use a statistical description of secondary protein structures in relation to codon composition to show that the correct assumption is that the RNY pattern, as it occurs in CDSs, is the consequence of periodicity introduced by the constructive contribution of hydropathy alternation to secondary protein structure within proteins, the molecular weight (MW) of secondary structures, and the energy cost of amino acid synthesis. The purine bias conservation throughout the biosphere suggests that a negative selection (purifying) mechanism is exerted over ribosomal machinery thermodynamics to maintain its function despite the codon and anticodon mutation rate.
Materials and Methods
Before any further development, let us note that (i) the regression lines of this study are orthogonal and were calculated in agreement with Jolicoeur,31 (ii) the amino acid hydropathy was calculated according to the scale of Kyte and Doolittle,32 (iii) the energy cost of amino acid synthesis was calculated according to Akashi and Godjobori,33 and (iv) Student’s t and Wilcoxon signed-rank tests were applied using the R package (3.0.2) to evaluate the statistical consistency of the differences of amino acid frequencies between pairs of protein secondary structures. Because of the multiple comparisons (n = 60) involved in such inference, we applied the Bonferroni correction ie, we divided the level of significance (P-value) by n to ensure a more realistic level of significance for challenging the null hypothesis.
Sequence dataset
The dataset used in this work consisted of a set of 10,731 CDSs from non-redundant proteins for which the three-dimensional (3D) structures have been experimentally determined. This set of proteins was selected from RCSB Protein Data Bank (PDB, release 3.2).34 For each PDB entry, we used UniProtKB (release 14.0) to map the corresponding EMBL or GenBank identifier (ID) to retrieve the corresponding DNA sequence. However, the relationship between the structures reported in PDB and their corresponding DNA sequence is not straightforward for many cases. This situation is explained by a number of factors; for instance, many protein structures were either determined before or independent of their corresponding DNA sequences, implying a retrospective search among many alternative candidate genes that encode very similar proteins. In many cases, the ID reported by UniProtKB corresponded to an entire genome, forcing a careful ID list inspection to extract the CDS that matched the correct amino acid sequence reported in the PDB entry.
Removing redundancy from sequence dataset
PDB contains many entries that correspond to the same or very similar proteins. For instance, in some cases one entry contains only a fragment of a protein and another entry contains the complete version of the same protein. However, the most common source of redundancy comes from the presence of homologous protein structures from closely related species. The first step in the preparation of our data set consisted of identifying this redundancy and choosing an item from each group containing the many redundant entries from the best and most informative (normally the longest) candidate. To this end, we first built the sequence homolog clusters and closely related proteins by using BLASTClust35 with an identity threshold of 90%, which means that two sequences with more than 90% amino acid identities were assigned to the same cluster. Following this procedure, we obtained 18,827 clusters from an initial dataset of 143,373 entries (downloaded from http://www.rcsb.org/pdb/files/ss.tx). From each one of these clusters, we kept the longest sequence.
Mapping secondary structures to DNA sequences
This process was conducted in two steps. The first one consisted of identifying the DNA sequence that most likely encoded the protein structure reported in PDB. To do this, we used the cross-reference database developed by Martin36 that relates each PDB entry with one or more protein sequences from UniProtKB. In turn, each UniProtKB entry has links to the DNA repositories of GenBank (Release 175) or EMBL (Release 100). We discarded the CDSs that could not be retrieved through their GenBank ID. In most cases, the DNA sequence retrieved from a DNA repository matched the expected CDS, but in some cases, the GenBank (or EMBL) ID given by UniProtKB corresponded to a whole genome or to an entire chromosome. In such cases, all CDSs had to be extracted from their corresponding genomic DNA sequences and compared to the amino acid sequence from the PDB entry of interest to determine which sequence encoded the desired protein.
In general, additional processing was required to obtain an exact match between the translated CDS and the protein sequence from PDB. Often, it was necessary to trim the sequence of a translated CDS to obtain a DNA sequence that exactly matched a multiple of three for the sequence size corresponding to the PDB entry. Such discrepancies could occur when the structure of a protein reported in PDB was only partially available, and the information available in GenBank was a complete protein sequence. To reconcile this issue, each translated CDS was aligned to the amino acid sequence provided by PDB using the Smith—Waterman algorithm.37 Owing to these difficulties, the final dataset was further reduced from 18,827 clusters to 10,731 entries for which an unambiguous determination of the DNA sequence was possible.
The second mapping step consisted of assigning each amino acid in the PDB to its associated codon in the corresponding DNA sequences. It was then easy to determine the codon and base frequencies for each type of secondary structure, providing that each individual amino acid in the PDB was assigned to a specific secondary structure category.
Codon frequency and secondary structures
The nucleotide composition for each type of secondary structure, ie, the α-helix (H), β-sheet (E), and aperiodic (A) (the sum of turns and coils), was obtained from the corresponding CDS stretch using their respective coordinates. Thus, considering the following secondary structure “HHHHHHEEEEEEEHHHHHHHH” as an example, the corresponding CDS coordinates would be as follows: (1–18), (40–63) for H, and (19–39) for E. The final result was a table with the absolute and relative frequencies of each codon for the three secondary structure classes.
Results
Statistics of secondary structures
We found that, on average, half of the amino acids in protein sequences are dedicated to encoding secondary structures with a clear 3D periodic pattern, ie, α-helix (H) and β-sheet (E), and the other half is dedicated to structures without a clear 3D periodic pattern that we called aperiodic (A), ie, turns (T) and coil (C), the last of which is generally considered as the whole minus H and E (Fig. 1). Figure 1 shows that Hs account for ~30% (Fig. 1B) whereas Es account for ~20% (Fig. 1C), on average.
Figure 1.
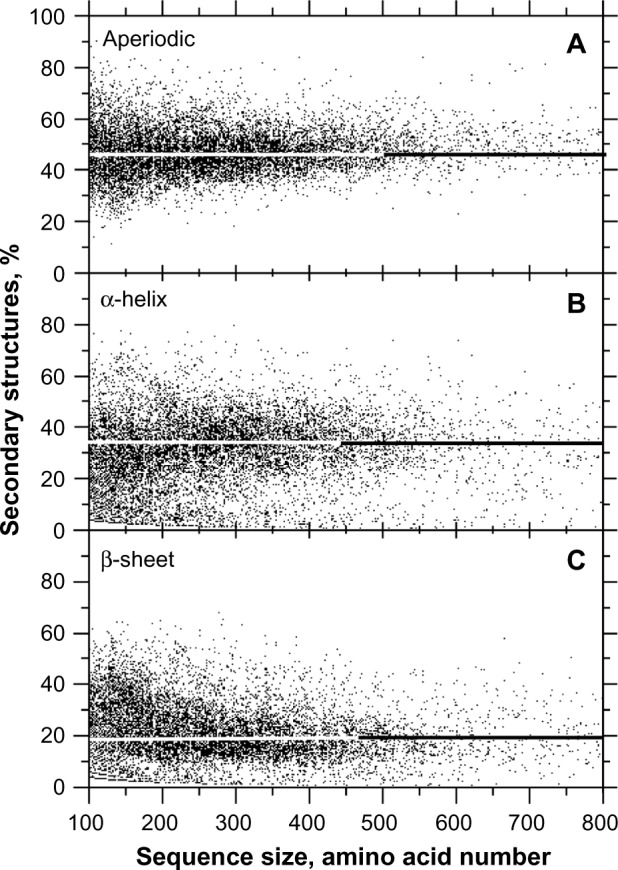
Relative frequency of secondary structures according to the protein size. The sample size for each structure is n = 10,731.
Notes: A, aperiodic (median = 49%, average = 50%, σ = 14.2%, skewness = 1.0) (A). B, α-helix (median = 32%, average = 33%, σ = 18.4%, skewness = 0.5) (H). C, β-sheets (median = 19%, average = 24%, σ = 14.7%, skewness = 0.7) (E).
The frequencies of Hs and Es compensate for one another with a statistical correlation of r = −0.75 (Fig. 2). The fact that the regression line is below and parallel to the diagonal indicates that the proportion of protein dedicated to A cannot be reduced below ~30%. This finding is most likely because a minimum A structure size is necessary to connect stretches of Hs and Es and to warrant sufficient flexibility to allow adequate protein folding. The distribution of preferred amino acids differs according to these three secondary structures (Table 1) (see comparable results in Bellesia et al.23).
Figure 2.
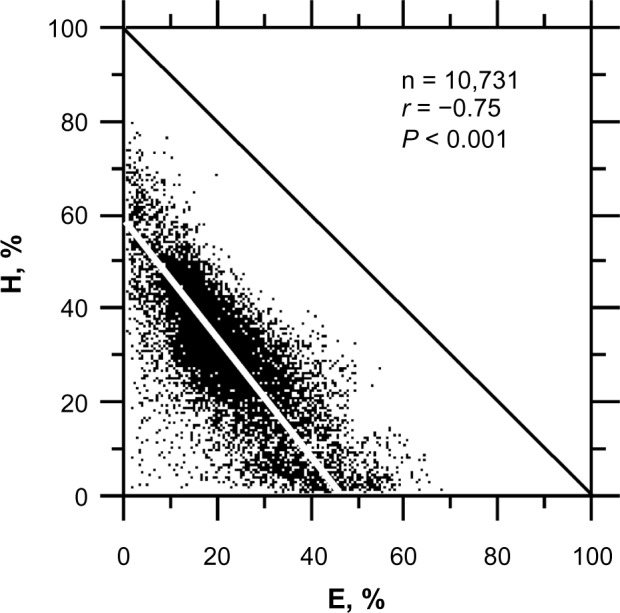
Relationships between the H and E proportions in protein sequences from PDB. The regression line is y = −1.33x + 60.07 with a correlation coefficient r = −0.75.
Table 1.
Relative frequency of amino acids per periodic (H and E) and aperiodic (A) structures in the non-redundant protein sequences of RCSB PDB (n = 10,731).
| SECONDARY STRUCTURES | WEIGHTED AVERAGE** | |||||||
|---|---|---|---|---|---|---|---|---|
| A | σA* | H | σH | E | σE | |||
| Amino | Ala | 6.6786 | 3.5245 | 11.663 | 6.212 | 6.202 | 4.248 | 8.327 |
| acids | Cys | 1.1409 | 1.5373 | 1.131 | 2.076 | 1.715 | 2.809 | 1.252 |
| Asp | 7.8367 | 3.0521 | 4.905 | 3.570 | 3.158 | 2.908 | 5.875 | |
| Glu | 6.5326 | 3.2028 | 9.636 | 5.053 | 4.631 | 3.606 | 7.238 | |
| Phe | 3.1538 | 1.9125 | 3.979 | 3.143 | 5.758 | 4.089 | 3.963 | |
| Gly | 11.2558 | 4.1526 | 3.169 | 2.880 | 4.661 | 3.590 | 7.106 | |
| His | 2.4541 | 1.8310 | 2.002 | 2.352 | 2.254 | 2.621 | 2.256 | |
| Ile | 3.5544 | 2.1797 | 6.155 | 3.895 | 10.858 | 6.200 | 5.925 | |
| Lys | 6.1480 | 3.5748 | 6.917 | 4.764 | 4.524 | 3.882 | 6.092 | |
| Leu | 6.5723 | 2.8664 | 12.119 | 5.201 | 10.861 | 5.793 | 9.371 | |
| Met | 2.1670 | 1.5636 | 2.601 | 2.407 | 2.244 | 2.578 | 2.334 | |
| Asn | 5.5943 | 3.1643 | 3.068 | 3.006 | 2.368 | 2.667 | 4.065 | |
| Pro | 7.4044 | 3.1455 | 1.990 | 2.266 | 1.964 | 2.579 | 4.421 | |
| Gln | 3.4341 | 2.3412 | 4.694 | 3.721 | 2.532 | 2.894 | 3.695 | |
| Arg | 4.7410 | 2.7526 | 6.152 | 4.097 | 4.539 | 4.013 | 5.194 | |
| Ser | 7.3655 | 3.3386 | 4.534 | 3.628 | 4.537 | 3.756 | 5.809 | |
| Thr | 5.6935 | 2.6232 | 4.156 | 3.310 | 6.194 | 4.452 | 5.255 | |
| Val | 4.5769 | 2.3172 | 6.415 | 3.826 | 14.59 | 6.829 | 7.223 | |
| Trp | 0.9858 | 1.1169 | 1.428 | 2.029 | 1.595 | 2.249 | 1.262 | |
| Tyr | 2.7103 | 1.8717 | 3.287 | 2.922 | 4.818 | 4.118 | 3.334 | |
| Sum | 100.0 | 100.0 | 100.0 | 100.0 | ||||
| Mean | 5.0 | 5.0 | 5.0 | 5.0 | ||||
Notes:
σ is for the standard deviation.
Weighted average is (0.45 × A) + (0.35 × H) + (0.2 × E). The white rectangles identify the values below 3.0; the gray rectangles identify the values above 7.0, and the black rectangles identify the values above 11.0.
The amino acid frequency maxima differ among the three secondary structures ie, (i) glycine (Gly – G: GGN) with a maximum in As, (ii) alanine (Ala – A: GCN) and leucine (Leu – L: CTN, TTR), which are maximum in Hs, and (iii) valine (Val – V: GTN) with its maximum in Es. We also found (i) asparatic acid (Asp – D: GAY), proline (Pro – P: CCN), and serine (Ser – S: TCN, AGY) to be higher than average in As, (ii) glutamic acid (Glu – E: GAR) to be higher than average in Hs, and (iii) Leu and isoleucine (Ile – I: ATA, ATY) to be higher than the average in Es. To recap, Ala, Glu, Gly, Ile, Leu, and Val are higher than the average, and cysteine (Cys – C: TGY), histidine (His – H: CAY), methionine (Met – M: ATG), and tryptophan (Trp – W: TGG) are lower than average in proteins. The observations just outlined were strongly supported by the Wilcoxon and Student tests (Table S1). Given the sample size and the variance, only the equality of (i) P, S, and W in the H versus E pair and (ii) C in the A versus H pair could not be rejected.
Each secondary structure forms a network of statistical correlations among amino acids: in Hs, (i) Ala is highly correlated (r ≥ 0.7) (Table S2, black rectangles) to Leu and Val, (ii) Glu is highly correlated to Lys, Leu, and Arg, and (iii) Leu is highly correlated to Arg, Ser, Thr, and Val. In Es, the statistical correlations are at a maximum below a threshold of r = 0.7 ie, (i) Ala is fairly correlated to Gly, Leu, and Val, (ii) Leu is fairly correlated to Arg, Ser, and Val, (iii) Ser is fairly correlated to Thr, and (iv) Thr is fairly correlated to Val (Table S3, gray rectangles). In As, a large network of fair correlations was found with some superposition for that of Hs, but high correlations were distributed differently (Table S4). We found (i) Ala is highly correlated to Gly and Pro, (ii) Asp is highly correlated to Gly, Pro, and Thr, (iii) Gly is highly correlated to Pro, Thr, and Val, and (iv) Pro is highly correlated to Arg and Val.
Table S5 shows that purines are over-expected (~60% of the cases) in the first codon position (R1) regardless of the secondary structure type ie, Hs, Es, or As. In contrast, in the second codon position, purines tend to be slightly under-expected in the periodic secondary structures (especially in Es), but not in the As structures, denoting a weak contribution of protein periodic structures to purine bias. Purines also tend to be slightly under-expected in the third codon position of E as well as in A structures, but not for Hs (Table S5).
A closer look at the data in Table S5 shows that purines (seven codons for A1 and five codons for G1) are more frequent in the first codon position than pyrimidines (six codons for T1 and five codons for C1), which is obvious from the fact that three codons from T1 are used as stop codons (not including the coding information). Similarly, the stop codon removes purine availability for the second and third codon positions. The A1, G1, C1, and T1 codons are approximately equifrequent in the H, E, and A structures. However, the average codon frequencies followed the series G1 > A1 > C1 > T1 according to purines and pyrimidines, which is unexpected from a model of random base distribution because there are more codons for A1 (7) and T1 (6) than for G1 (5) and C1 (5). To summarize, purines (R1) occur 1.5 times more often than pyrimidines (Y1) in the first codon position. The most striking feature associated with the G bias (Ggg) is a two-fold Ala, Val, and Gly preference according to Hs, Es, and As, respectively (Table S6).
The statistics of basic physicochemical properties in amino acids given at Table S6 shows that again similar rates are found among structures for a given parameter, but the weighted averages may change significantly according to whether the first codon base is a purine or a pyrimidine (Tables S7–S9). The weighted average MW of amino acids increases regularly between 110 and 160 (Fig. 3A) according to the series G1 < A1 <C1 <T1 of codons as well as its correlated parameters for (i) the number of chemical bonds in their lateral chain (Fig. 3B and Table S5, “Bnd” with r = 0.91, P < 0.0001) and (ii) the experimental energy cost of amino acid synthesis (Fig. 3C, Table S6, “Ak” with r = 0.80, P < 0.0001). The larger cost associated with the amino acid synthesis in Y1 relative to R1 is also because of the inclusion of rings in their lateral chain (Table S6, “Cycl”). The inclusion of heteroatoms such as oxygen (O), nitrogen (N), or sulfur (S) in their lateral chain does not result in a difference between R1 and Y1 (Table S5, “NOS”).
Figure 3.
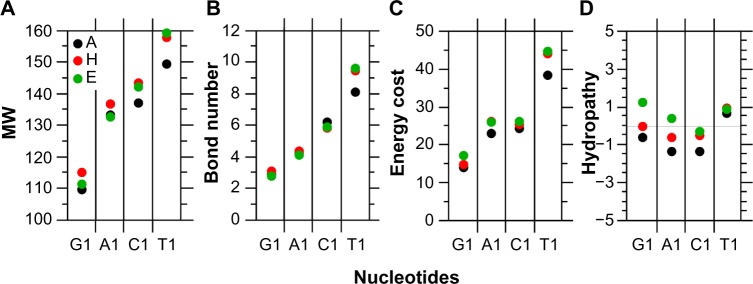
Average features of amino acids encoded by the G1, A1, C1, and T1 codons weighted by relative frequencies per structure. In A, codons in G1, A1, C1, and T1 account for 37, 27, 21, and 15%, respectively. In H, codons in G1, A1, C1, and T1 account for 36, 26, 22, and 16%, respectively. In E, codons in G1, A1, C1, and T1 account for 33, 29, 18, and 20%, respectively (see Tables S7–S9).
Notes: A, MW. B, number of chemical bonds. C, energy cost for synthesis. D, hydropathy.
The largest amino acid frequencies in Table S6 are associated with Ala, Val, and Gly (all G1 codons), which confirms the links between the G1 > G2 rule and the high frequencies of low complexity amino acids in As, Hs, and Es. The amino acids encoded by G1 codons tend to be hydrophobic in Es, neutral in Hs, and slightly hydrophilic in As, on a weighted average basis. The same trend, but slightly in favor of hydrophilicity, was found for A1. In the C1 and T1 codons, the associated amino acids are hydrophilic and hydrophobic, respectively, in the three secondary structures, on a weighted average basis (Fig. 3D); however, the amino acid hydropathy trends reported according to the nucleotide composition in the first codon position are just weak.
We also found that the amino acids with the lowest MWs (or the smallest lateral chains) are also the most frequent (Fig. 4A), which is expected because these amino acids are less costly to synthesize, in terms of energy. This statistical correlation between amino acid frequency and protein MW is consistent in A (r = −0.626) structures (Fig. 4B), but vanishes in H (r = −0.236) and E (r = −0.272) structures (Fig. 4C and D) where the statistical correlations are not significant, even when a similar trend is still observed. These results suggest that the larger R1 level is because of the larger frequency of amino acids whose codons are G1 simply because of their lower energetic cost (lower lateral chain complexity).
Figure 4.
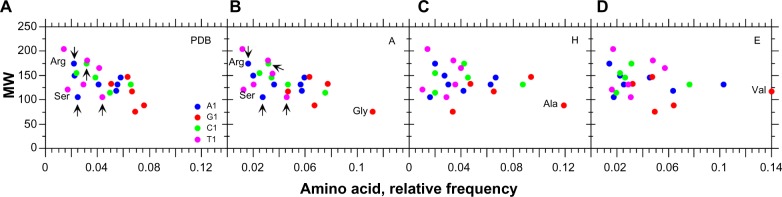
Average frequencies of amino acids with A1, G1, C1, and T1 codons (see Tables S6–S9) according to MW.
Notes: A, dataset of non-redundant proteins from PDB (r = −0.584, P < 0.05). B, A structures in PDB (r = −0.626, P < 0.01). C, H structures in PDB (r = −0.236, P = 0.321). D, E structures in PDB (r = −0.272, P = 0.251).
Purine bias and protein secondary structures
Considering the relationships between protein secondary structures and nucleotide distribution according to the codon positions, Figure 5 shows that compositional constraints act on the first and second codon positions while the third codon position follows the regional trend for intergenic DNA (see Bernardi11) as can be deduced from its larger standard deviation. Globally, (i) A is at slightly under-expected frequency in the first position, but is over-expected in the second codon position of As and Hs. By contrast, A is at slightly over-expected frequency in the first position compared to the second codon position in Es (Fig. 5A); (ii) G is over-expected in the first position (Fig. 5C) and under-expected in the second codon position in As, Hs, and Es; and (iii) the relationship between the first and third codon positions is similar for A and G (similar regression slopes) and generally in favor of the first codon position over the third (Fig. 5B and D) considering As, Hs, and Es. However, a minimum G load of ~5% (Fig. 5D) seems to be necessary, which is not the case for A (Fig. 5B).
Figure 5.

Relationships between purines in the three codon positions according to periodic and aperiodic structures from PDB. The sample size for each structure is n = 10,731.
Notes: Panel A, rA = 0.476**, A: y = 0.98x + 7.66, rH = 0.308**, H: y = 0.95x + 9.17, rE = 0.111**, and E: y = 0.42x + 11.98. Panel B, rA = 0.549**, A: y = 2.16x − 39.05, rH = 0.426**, H: y = 2.38x − 41.33, rE = 0.400**, and E: y = 1.84x − 35.92. Panel C, rA = 0.318**, A: y = 0.53x − 1.18, rH = −0.017, H: y is not defined because P > 0.05, rE = −0.001, and E: y = −0.07x + 16.56. Panel D, rA = 0.255**, A: y = 3.01x − 86.68, rH = 0.193**, H: y = 3.85x − 107.85, and rE = 0.187**, E: y = 2.97x − 72.90 (**statistical significance at P < 0.001).
The most significant relationship between purines and pyrimidines occurs in the second codon position through A and T (Fig. 6A) because these two nucleotides are almost sufficient for classification as periodic and aperiodic secondary protein structures. Figure 6A shows that, roughly speaking, in As T2 < 25%, Hs 25% <T2 <35%, and Es T2 > 35%. The sequences corresponding to periodic and aperiodic are distributed along an almost linear regression relationship corresponding to A2 = −0.55 × T2 + 48.7 (r = −0.58) in the range 5% < T2 < 60% (mostly 40% ie, 10% < T2 < 50%). In addition, this regression line also shows that A2 + T2 is effectively larger than 50%, which explains why G2 < G1. Neither A2 nor G2 provides the discrimination power of T2 because the distribution of periodic and aperiodic tends to cluster together according to A2 versus G2 (Fig. 6B).
Figure 6.

Relationships between A, G, and T in the second codon position according to periodic and aperiodic structures. The sample size for each structure is n = 10,731.
Notes: Panel A, rA = −0.141**, A: y = −6.61x + 167.03, rH = −0.320**, H: y = −2.28x + 105.66, rE = 0.506**, and E: y = −0.80x + 59.65. Panel B, rA = −0.530**, A: y = −1.60x + 68.33, rH = −0.422**, H: y = −2.31x + 65.95, and rE = −0.189**, E: y = −2.91x + 65.62 (**statistical significance at P < 0.001).
Taken together, the purine constraints are such that R1 > R2 and R1 > R3, which makes the purine bias orientation change from the first to third codon positions (Fig. 7) regardless of the secondary structure under consideration. However, periodic structures (especially Es) are contributing to purine bias more than aperiodic (Fig. 7A), which again suggests a positive contribution by the intrinsic periodicity in periodic secondary structures to the periodicity that is observed in coding DNA in the form of a purine bias across codons. Interestingly, the R1 versus R2 relationship demonstrates structuring according to the protein secondary structures and the second codon position, but not according to the first codon position with (i) A structures at R2 > 50%, (ii) Hs at R2 ~ 50%, and (iii) Es at R2 ~ 40%. In contrast to the structuring observed for R2 versus R1, the one of R1 versus R3 is negligible; extensive overlapping occurs among and according to the secondary structures (Fig. 7B), confirming that secondary structures are only linked to the second codon position, but not to the first or third. The narrow range of variation (~45%) in R3 contrasts with the huge range of GC3 variation (~85%) (Fig. 8).
Figure 7.

Relationships between purines in the three codon positions according to periodic and aperiodic structures. The sample size for each structure is n = 10,731.
Notes: Panel A, rA = 0.289**, A: y = 0.71x + 18.48, rH = −0.016, H: y is not defined because P > 0.05, and rE = −0.257**, E: y = −0.81x + 89.15. Panel B, rA = 0.164**, A: y = 1.85x − 73.87, rH = 0.135**, H: y = 1.79x − 59.92, and rE = 0.108**, E: y = 1.14x − 27.24 (**statistical significance at P < 0.001).
Figure 8.
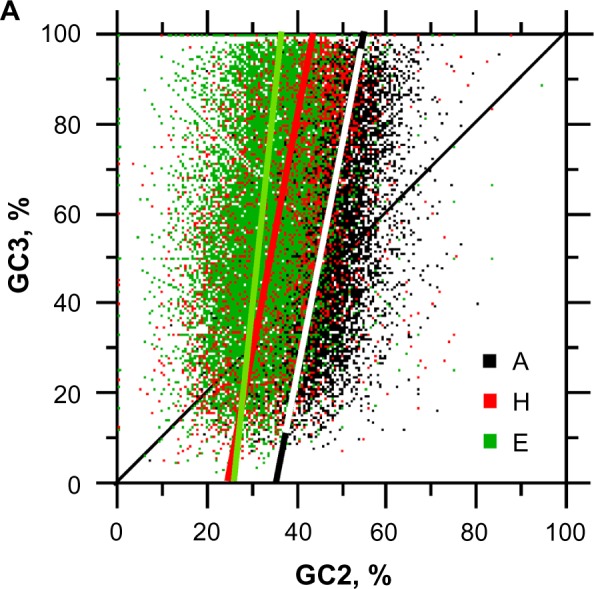
Relationships between GC2 and GC3 according to periodic and aperiodic structures. The sample size for each structure is n = 10,731.
Notes: rE = 0.223**, E: y = 9.79x − 250.91, rH = 0.376**, H: y = 5.49x − 131.49, and rA = 0.459**, A: y = 5.21x − 181.28 (**statistical significance at P < 0.001).
Interestingly, Figure 8 shows that As best explains large GC2 values and Es occupies the lowest GC2 range, and Hs is in the intermediary position between Es and As. Given that G3 is limited to a variation range ≤50% on average, C3 is the entity that absorbs the larger variation in the third codon position (Fig. 9). From the scatter plot of Figure 9, one can see that the G3 increase starts to saturate above 40%. Thus, any GC3 increase above 50% occurs through C3 above 40% and until a maximum of ~70%. The limit at G3 = −C3 + 100 indicates GC3 = 100%. Figure 9 also shows that G3 increases more rapidly in Hs than in Es, whereas the A trend is between that of Hs and Es. However, the A and E trends are very close and both relationships almost overlap.
Figure 9.
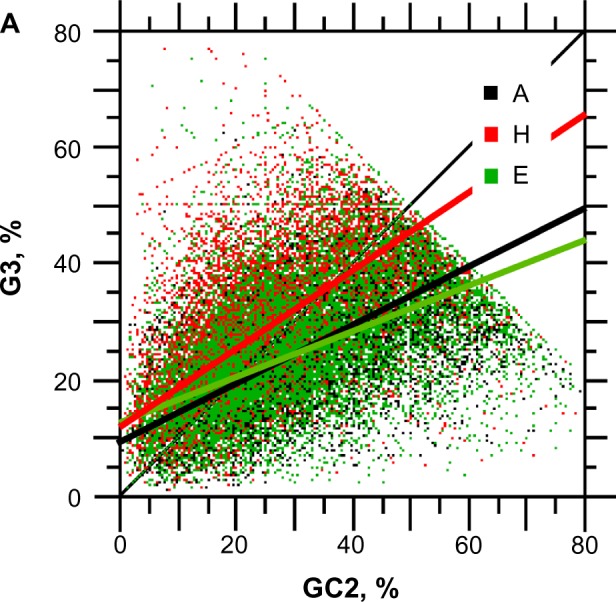
Scatter plot of G3 versus C3. The sample size for each structure is n = 10,731.
Notes: Red is for H (r = 0.397**, y = 0.67x + 12.01), green is for E (r = 0.325**, y = 0.43x + 12.42), and black is for A (r = 0.550**, y = 0.49x + 9.88) (**statistical significance at P < 0.001).
Secondary structures and protein physicochemical constraints
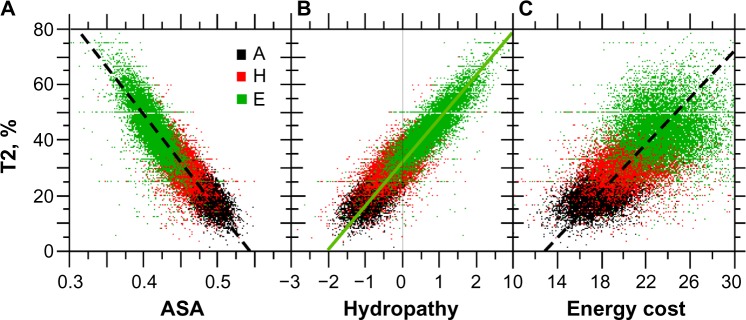
Considering the relationship between protein secondary structures and their physicochemical constraints, we found that the range of average surface accessibility (ASA) for (i) As is between ~0.45 and ~0.525, (ii) Hs ranges between ~0.425 and ~0.480, and (iii) Es ranges between ~0.350 and ~0.450 (Fig. 10A). These results are in line with a solvent accessibility for the secondary structures following the series As > Hs > Es, which simply means that E structures tend to be buried inside the protein as far as possible from solvent contact.38
Figure 10.
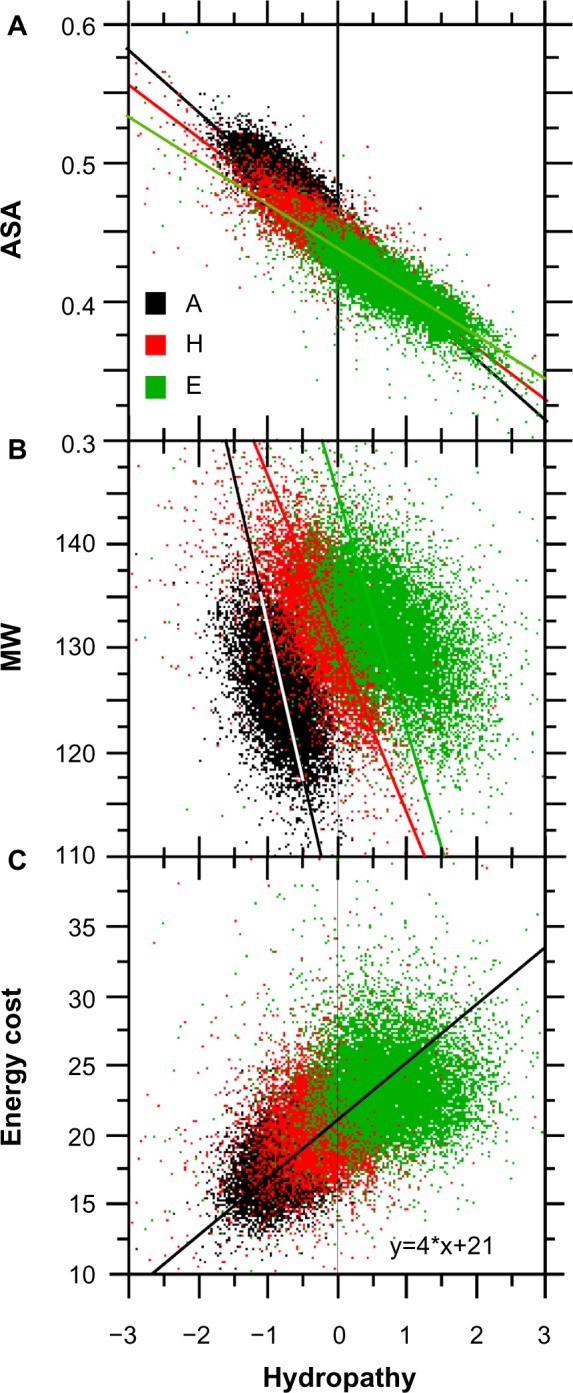
Relationships between hydropathy, ASA, average MW, and the energy cost of amino acid synthesis in protein secondary structures. The sample size for each structure is n = 10,731.
Notes: Panel A, ASA, rA = −0.755**, A: y = −0.031x + 0.463, rH = −0.821**, H: y = −0.03x + 0.446, and rE = 0.840**, E: y = −0.029x + 0.435. Panel B, MW, rA = −0.454**, A: y = −29.24x + 103.00, rH = −0.575**, H: y = −18.89x + 129.52, and rE = −0.523**, E: y = −16.78x + 144.62. Panel C, energy cost of amino acid synthesis, r = 0.605, y = 4x + 21 (**statistical significance at P < 0.001).
Interestingly, all three structures are distributed, on average, on a line corresponding to MW = 10 × hydropathy + 130 (Fig. 10B). Thus, one can say that the contribution of A structures to the whole protein MW is lower, on average (127), and that they are more hydrophilic (−0.75) than the other two structures. The most hydrophobic structures are Es, with an average hydropathy of 0.6 and an average MW of 132.5. H structures have an average hydropathy close to zero because of their hydrophobic amino acids facing the hydrophobic protein core and their hydrophilic amino acids facing the solvent.21 The average MW of ~130 is close to that of Es (Fig. 10B).
In view of the general relationships shown in Figure 10B (confirmatory of Chiusano et al.25), the compensation trend between MW and hydropathy is similar among secondary structures. When the three structures are considered separately, the larger the MW, the lower the hydropathy (the larger the level of hydrophily) and vice versa. This common relationship between MW and hydropathy among the three structures means that if the contribution of one structure to the whole protein size is low (low MW), its relative contribution to the average hydrophobicity of this protein will be comparatively larger, but the two other structures will compensate for the MW and hydrophobicity at the whole protein level.
The energy cost of the amino acid synthesis associated with Es is also the largest (Fig. 10C), which is not surprising because their average MW is also the largest. Hs do have a synthesis energy intermediary to that of As (the lowest) and Es.
As expected from their chemistry, heteroatoms were found to have fewer E structures (Fig. 11A) associated with the hydrophobic core (Fig. 11B). As a corollary, heteroatom frequency is correlated to solvent structure access (Fig. 11B).
Figure 11.
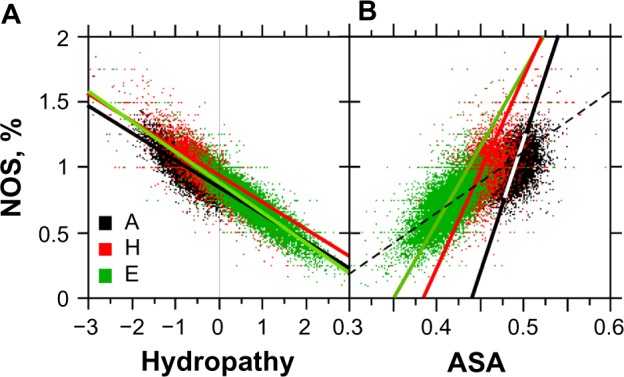
Relationships between the number of heteroatoms (NOS), hydropathy, and ASA. The sample size for each structure is n = 10,731.
Notes: Panel A, rA = −0.821**, A: y = −0.28x + 0.80, rH = −0.862**, H: y = −0.28x + 0.88, and rE = 0.893**, E: y = −0.29x + 0.90. Panel B, rA = 0.406**, A: y = 20.4x − 8.94, rH = 0.598**, H: y = 14.70x − 5.68, and rE = 0.665**, E: y = 12.50x − 4.16 (dashed line of panel B: y = 3.0x − 1.25) (**statistical significance at P < 0.001).
From Figure 10B and C, one would expect a positive relationship between the MW and energy cost. In fact, this relationship is illustrated in Figure 12A. We also found consistent statistical correlations between MW and A2 (Fig. 12B) or G1 (Fig. 12C), which is an expected consequence of the fact that G1 is associated with small amino acids of low complexity (Fig. 3A and B). However, the statistical correlations between A2 and G1 were small (rA = −0.259, rH = −0.144, rE = −0.226), which indicates that both A2 and G1 relationships with the MW are largely independent.
Figure 12.
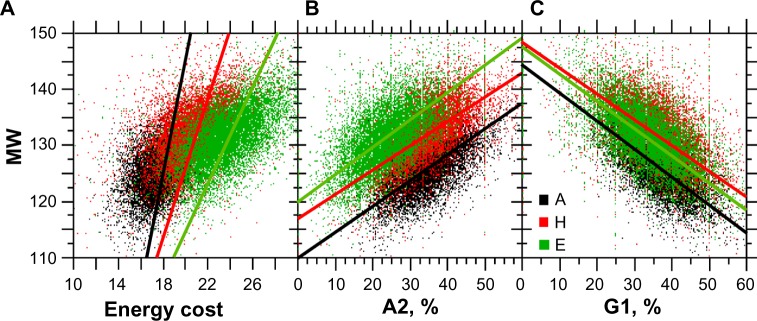
Relationships between MW, the energy cost of amino acid synthesis, A2, and G1. The sample size for each structure is n = 10,731.
Notes: Panel A, amino acid synthesis, rA = 0.486**, A: y = 4.59x + 44.14, rH = 0.527**, H: y = 3.35x + 63.28, and rE = 0.602**, E: y = 2.52x + 71.80. Panel B, A2, rA = 0.619**, A: y = 0.47x + 109.98, rH = 0.560**, H: y = 0.43x + 117.53, and rE = 0.564**, E: y = 0.50x + 119.62. Panel C, G1, rA = −0.590**, A: y = −0.48x + 143.97, rH = −0.526**, H: y = −0.41x + 147.21, rE = −0.586**, E: y = −0.44x + 146.39 (**statistical significance at <0.001).
The physicochemical relationships between the secondary structures and their hydropathy, ASA, and energy cost are all encoded by T2 (Fig. 13). The statistical correlation coefficient of T2 with ASA (<0) and hydropathy (>0) is ~0.9 and confirms that Es are associated with the largest T2 levels, the lowest access to solvent (Fig. 13A), the largest hydropathy (Fig. 13B), and the largest energy costs (Fig. 13C).
Figure 13.
Relationships between T2, ASA, hydropathy, and the energy cost of amino acid synthesis. The sample size for each structure is n = 10,731.
Notes: Panel A, r = −0.903**, A: y = −345.45x + 190.0. Panel B, rA = 0.597**, rH = 0.670**, and rE = 0.863**, E: y = 17.27x + 30.97. Panel C, r = 0.605, y = 4.23x − 55 (**statistical significance at P < 0.001).
Relationships between secondary protein structures and codons
As shown above, the hydropathy and MW of secondary structures are negatively correlated. In addition, these factors are linked to the second codon position, which is dominated by A2 versus T2 compensation (explaining the low G2 contribution). To better understand how codons are involved with this relationship, we divided datasets of As, Hs, and Es into two sub-datasets (light and heavy) according to their mean MWs. The codon contribution to the overall hydropathy of Es and As was compared for amino acid complexity in light and heavy subgroups. Because Hs are amphipathic (ambivalent) with hydrophobic amino acids toward the hydrophobic protein core and with hydrophilic amino acids toward the solvent, we analyzed the most frequent amino acids in both light and heavy subgroups according to their hydropathy.
Focusing on Es, we found that there is a robust statistical correlation between the number of bonds or MW and A2 (Fig. 12B, Table 2). Thus, A2 is linked to amino acid complexity. Because large complexity (high MW) is costly (Fig. 12A), this may explain why the A2 codons are less frequent than the T2 codons despite the fact that there are seven codons for A2 in place of six for T2. The frequency of all amino acids in A2 is increasing from light to heavy MW. By contrast, the statistical correlations between T2 and A (r = 0.226), H (r = 0.023), or E (r = −0.225) structures are low and not relevant (data not shown). Thus, A2 codons (24.7%) explain the amino acid complexity for protein secondary structures. In comparison, T2 codons are 44.1%, Y2 are 61.2%, and R2 are 38.8% (from Table 2, column “LH%” under E). As one would expect from Figure 12B, the data from Table 2 also allow us to draw a positive relationship between A2 and amino acid complexity in Es as well as in As and Hs. The amino acids that are most affected in terms of frequency between light and heavy MW (Table 2, column “H-L”) are Tyr, Ala, and Val. Ala and Val decrease from light to heavy MW and Tyr increases, which is in line with the fact that Ala and Val are small when Tyr is large (interestingly, Tyr is A2). The hydrophobicity is generally positive in 91.6% of Es (Fig. 10), so one may conclude from Figure 10A that Es are the major constituent of the hydrophobic core. The hydrophobicity contribution is made by Ala (GCN, weighted average: 1.8 × 6.03 = 10.8), Ile (ATY|A, weighted average: 4.5 × 10.79 = 48.4), Met (ATG, weighted average: 1.9 × 2.25 = 4.3), Leu (CTN|TTR, weighted average: 3.8 × 10.85 = 41.2), Val (GTN, weighted average: 4.2 × 14.38 = 60.4), Cys (TGY, weighted average: 2.5 × 1.72 = 4.3), and Phe (TTY, weighted average: 2.8 × 5.87 = 16.4). The series of codon contributions to Es hydrophobicity is therefore GTN > ATY|A > CTN|TTR > TTY > GCN > TGY~ATG. As expected from Figures 6 and 13B, this series is in line with a larger contribution from T2 than R2 to Es.
Table 2.
Distribution of amino acids in secondary structures of proteins according to codon structure, hydropathy, and MW.
| AA | COD | B | HYD | MW | A | H | E | |||||||||
|---|---|---|---|---|---|---|---|---|---|---|---|---|---|---|---|---|
| L% | H% | LH | H-L | L% | H% | LH | H-L | L% | H% | LH | H-L | |||||
| Lys | AAR | 5 | −3.9 | 146.2 | 5.18 | 7.18 | 6.18 | 2.00 | 5.88 | 7.81 | 6.85 | 1.93 | 3.85 | 5.34 | 4.59 | 1.49 |
| Asn | AAY | 5 | −3.5 | 132.1 | 5.15 | 6.06 | 5.61 | 0.91 | 2.85 | 3.25 | 3.05 | 0.40 | 2.25 | 2.51 | 2.38 | 0.26 |
| Gln | CAR | 6 | −3.5 | 146.1 | 3.24 | 3.64 | 3.44 | 0.40 | 4.43 | 4.92 | 4.68 | 0.49 | 2.21 | 2.93 | 2.57 | 0.72 |
| His | CAY | 9 | −3.2 | 155.2 | 2.25 | 2.67 | 2.46 | 0.42 | 1.84 | 2.13 | 1.99 | 0.29 | 1.95 | 2.62 | 2.29 | 0.67 |
| Glu | GAR | 6 | −3.5 | 146.1 | 5.68 | 7.43 | 6.56 | 1.75 | 8.40 | 10.71 | 9.56 | 2.31 | 4.00 | 5.37 | 4.69 | 1.37 |
| Asp | GAY | 5 | −3.5 | 132.1 | 7.65 | 8.04 | 7.84 | 0.39 | 4.80 | 4.98 | 4.89 | 0.18 | 3.09 | 3.23 | 3.16 | 0.14 |
| Tyr | TAY | 12 | −1.3 | 181.2 | 2.18 | 3.28 | 2.73 | 1.10 | 2.42 | 4.01 | 3.21 | 1.59 | 3.45 | 6.52 | 4.98 | 3.06 |
| Thr | ACN | 3 | −0.7 | 119.1 | 6.03 | 5.33 | 5.68 | −0.70 | 4.52 | 3.84 | 4.18 | −0.67 | 6.54 | 5.74 | 6.14 | −0.80 |
| Pro | CCN | 6 | −1.6 | 115.1 | 7.77 | 7.02 | 7.39 | −0.75 | 2.19 | 1.82 | 2.00 | −0.37 | 2.07 | 1.84 | 1.95 | −0.23 |
| Ala | GCN | 1 | 1.8 | 89.09 | 8.25 | 5.00 | 6.63 | −3.25 | 14.98 | 8.99 | 11.98 | −5.99 | 7.67 | 4.38 | 6.03 | −3.29 |
| Arg1 | AGR| | 8 | −4.5 | 174.2 | 4.29 | 5.22 | 4.76 | 0.92 | 5.43 | 6.76 | 6.09 | 1.33 | 3.58 | 5.75 | 4.67 | 2.17 |
| Arg2 | CGN | |||||||||||||||
| Ser1 | AGY| | 2 | −0.8 | 105.1 | 7.70 | 7.01 | 7.35 | −0.70 | 4.96 | 4.17 | 4.56 | −0.78 | 4.84 | 4.16 | 4.50 | −0.69 |
| Ser2 | TCN | |||||||||||||||
| Gly | GGN | 0 | −0.4 | 75.07 | 13.51 | 8.86 | 11.18 | −4.65 | 4.12 | 2.33 | 3.23 | −1.79 | 5.85 | 3.21 | 4.53 | −2.64 |
| Trp | TGG | 16 | −0.9 | 204.2 | 0.80 | 1.18 | 0.99 | 0.38 | 1.02 | 1.75 | 1.38 | 0.73 | 1.04 | 2.28 | 1.66 | 1.24 |
| Cys | TGY | 2 | 2.5 | 121.2 | 1.13 | 1.15 | 1.14 | 0.02 | 1.11 | 1.15 | 1.13 | 0.05 | 1.71 | 1.73 | 1.72 | 0.02 |
| Ile | ATY|A | 4 | 4.5 | 131.2 | 3.23 | 3.90 | 3.56 | 0.67 | 5.96 | 6.35 | 6.15 | 0.39 | 11.43 | 10.15 | 10.79 | −1.29 |
| Met | ATG | 4 | 1.9 | 149.2 | 2.04 | 2.30 | 2.17 | 0.25 | 2.46 | 2.72 | 2.59 | 0.26 | 2.13 | 2.38 | 2.25 | 0.25 |
| Leu1 | CTN| | 4 | 3.8 | 131.2 | 6.36 | 6.80 | 6.58 | 0.44 | 12.28 | 11.05 | 11.67 | −1.23 | 10.99 | 10.70 | 10.85 | −0.30 |
| Leu2 | TTR | |||||||||||||||
| Val | GTN | 3 | 4.2 | 117.1 | 4.85 | 4.29 | 4.57 | −0.56 | 7.07 | 5.88 | 6.48 | −1.19 | 16.54 | 12.21 | 14.38 | −4.34 |
| Phe | TTY | 11 | 2.8 | 165.20 | 2.70 | 3.64 | 3.17 | 0.94 | 3.28 | 4.56 | 3.92 | 1.28 | 4.78 | 6.97 | 5.87 | 2.19 |
Notes: Light gray areas are to facilitate de identification of NRN codons. Dark gray areas are for the most frequent amino acids in Hs or with largest difference (H-L) between L% and H% in As and Es. Black areas are for the most frequent amino acids considering all secondary structures.
Abbreviations: AA, amino acids; Cod, codons; B, number of chemical bonds; Hyd, hydropathy score (negative for hydrophilicity and positive for hydrophobicity); MW, molecular weight; L%, the media of relative amino acid frequency per secondary structure from the PDB entries whose MWs are below the average MW; H, the media of relative amino acid frequency per secondary structure from the PDB entries whose MWs are above the average MW; LH, the average of L% and H%; H-L, the subtraction of L from H.
Aperiodic structures are hydrophilic in 99.2% of cases. The amino acids that are most affected in frequency between light and heavy MW (Table 2, column “H-L”) are Lys, Ala, and Gly. Ala and Val decrease from light to heavy MW and Lys increases, which is in line with the fact that Ala and Gly are small and Lys is large (interestingly, Lys is A2). The amino acids that contribute to hydrophilicity are Lys (AAR, weight: 3.9 × 6.18 = 24.1), Asn (AAY, weight: 3.5 × 5.61 = 19.6), Gln (CAR, weighted average: 3.5 × 3.44 = 12.0), His (CAY, weighted average: 3.2 × 2.46 = 7.9), Glu (GAR, weighted average: 3.5 × 6.56 = 23.0), Asp (GAY, weighted average: 3.5 × 7.84 = 27.4), Tyr (TAY, weighted average: 1.3 × 2.73 = 3.5), Thr (ACN, weighted average: 0.7 × 5.68 = 4.0), Pro (CCN, weighted average: 1.6 × 7.39 = 11.8), Arg (CGN|AGR, weighted average: 4.5 × 4.76 = 21.4), Ser (TCN|AGY, weighted average: 0.8 × 7.35 = 5.9), Gly (GGN, weighted average: 0.4 × 11.18 = 4.5), and Trp (TGG, weighted average: 0.9 × 0.99 = 0.9). The amino acid contribution to aperiodic structure series in terms of hydrophilicity is GAY > AAR > GAR > CGN|AGR > AAY > CAR > CCN > CAY > TCN|AGY > GGN ~ ACN ~ TAY > TGG. Again, as expected from Figures 6 and 13B, one can see that the pattern of amino acid contribution to hydrophilicity is dominated by A2 in A structures, which is in line with their hydrophilic character.
Helix structures are more difficult to analyze because their contribution is balanced among hydrophilicity and hydrophobicity (amphipathy). The division in light and heavy subgroups by MW roughly corresponds to an equivalent division by hydropathy because the average MW matches the average hydropathy (zero) in the case of Hs. The most frequent amino acids in Hs on average are as follows: Lys (AAR, weighted average: 3.9 × 6.85% = 26.7), Glu (GAR, weighted average: 3.5 × 9.56% = 33.5), Ala (GCN, weighted average: 1.8 × 11.98% = 21.6), Arg (CGN/AGR, weighted average: 4.5 × 6.09% = 27.4), Ile (ATY|A, weighted average: 4.5 × 6.15% = 27.7), Leu (CTN|TTR, weighted average: 3.8 × 11.67% = 44.3), and Val (GTN, weighted average: 4.2 × 6.48% = 27.2), which explains 59.2% of the total hydropathy. Lys, Glu, and Arg are hydrophilic, and they contributed to this factor as GAR > CGN/AGR ~ AAR. Ala, Ile, Leu, Val are hydrophobic, and their contribution to this factor follows the series CTN|TTR > ATY|A ~ GTN > GCN. Thus, hydrophilic amino acids are biased toward A2 and exposed to the solvent, and hydrophobic acids are biased toward T2 and exposed toward the hydrophobic core (Fig. 10A). Considering MW variations in hydrophilic amino acids, Arg decreases from light to heavy, which is expected because it is small, and Lys and Glu increases from light to heavy MWs, which is also expected because they are relatively large. In contrast, hydrophobic amino acids Ala, Leu, and Val decrease from light to heavy MWs, which is expected because they are small. However, Ile does not show a marked trend. One should also note here that Phe (hydrophobic) does not occur very frequently, but is relatively large and increases significantly from light to heavy MW. Thus, because heavy MWs are more hydrophilic on average, Phe has the opposite behavior compared to the general trend and shows that the balancing effect on MW by this amino acid is more important than its hydropathy level.
The amino acids that most vary in relation to MW and hydrophobicity according to the secondary structure under consideration deserve additional comments. Interestingly, the general trends of GRN (Glu, Asp, and Gly) and GYN (Ala, Val) are hydrophilic and hydrophobic, respectively. As expected from their low complexity level, the frequency of Ala and Gly increases when the MW of a secondary structure diminishes or when the hydrophobicity increases. Thus, in the case of these amino acids the important contribution seems not to be the hydropathy score, but rather the absence (or quasi-absence) of a lateral chain (the small steric size).
Interestingly, Ala and Gly also show that all codons starting with G do not necessarily show the same trend because GAR (Glu) and GAY (Asp) increase with MW. This is consistent with constraints on steric size because both amino acids have a rather large lateral chain (five to six chemical bonds). Because all A2 amino acids are hydrophilic and have a rather large size (≥5 bonds), one may understand why the hydropathy diminishes with increased MW.
In A structures, the main factor seems to be the steric size of the amino acid lateral chain (or its energetic cost of synthesis) because Gly (GGN) and Ser (AGY|TCN) are among the simplest amino acids and appear more frequently in low MW proteins and show the largest variations between low and high MWs.
In H structures, it is Ala (GCN) that shows the largest diminution from low to high MW, which is not surprising because this amino acid has only one chemical bond in its lateral chain. Glu (GAR) has the largest increases from low to high MW, which is in agreement with its relatively large size and negative charge (−3.6).
Interestingly, the alphabetical order for first and second codon positions in Table 2 approximately follows the hydropathy score for amino acids. The largest variations between low and high MWs in E structures are observed for amino acids Ala, Val and Tyr, which is consistent with a balance between steric size and hydrophobicity. In helices, the largest variation is found for Ala, which is consistent with the pattern in Figure 10.
Discussion
The general picture of our statistical analysis is consistent with previous reports. The large set of concatenated secondary structures from the entire non-redundant PDB database analyzed here reveals a proportion of Hs, Es, and As (~30%, ~20%, ~50%, respectively) similar to that reported by West and Hecht,21 ie, 31, 21, and 48%, respectively, which shows that the conclusions drawn by these authors should be applicable to the much larger protein set in our study. Similar conclusions by other authors20,22–24 dispel doubts about the hydrophilic and hydrophobic alternation of amino acids according to secondary structures as well as their consequences on protein folding. The regularity introduced by the binary code of hydropathy alternation21 in protein sequences is obviously paralleled by statistical correlations between amino acids according to the secondary structure under consideration. We chose to analyze statistical correlations from absolute frequencies because statistical correlation from relative frequencies of amino acids in secondary structures normalized for size only releases low correlation coefficients (<0.3). This is to be expected from the fact that the variation in an amino acid and its correlates will follow the secondary structure size. In addition, the amino acids preferred in a small structure are not necessarily the same as those found in larger versions of the same structure, which explains the discrepancy between correlations from absolute or relative frequencies. In addition, it may also explain why the level of statistical correlations in Es are lower than in Hs or As: because Es are shorter (average amino acid number: 60, σ = 41) than Hs (average amino acid number: 91, σ = 64) and As (average amino acid number: 127, σ = 81). The best correlation coefficients between amino acids that we found with As, Hs, and Es were r (A,G,P,D,T,V,L) > 0.7, r(A,L,V,E,K,R,S,T) > 0.7, and r(A,G,L,V,R,S,T) > 0.6, respectively. These correlations are in agreement with previous works39 that also shows regularities in the As structures. The statistical correlations in As are rather difficult to discuss given the variety of structures in this group. P in particular “tends to initiate turns and to support turns in its vicinity”; it “tends to appear at bends’ and coils’ ends.”39 The correlations between E, K, and R in Hs are not surprising because these amino acids are charged. A, V and S would compensate for secondary structure MW. The correlation between G and S in Es are also most likely related to constraints on the MW of secondary structures. Concerning Es, the statistical correlations between A, L, and V are not surprising given their hydrophobic nature. The balance between local (originating from the intrinsic secondary structure propensities of the amino acids) and non-local effects (reflecting the sequence of amino acids as a whole)23 modulated by folding constraints constitutes a protein code24 that was already inferred to be responsible for the purine bias by Shepherd.1
The purine bias observed in CDSs is not trivial because purine and pyrimidine distribution have the same probability of occurrence in the three codon positions according to the genetic code. The question is to identify the features that positively contribute to this bias. Any contribution from polymerase can be ruled out because the purine bias is not present in introns.5 The consequence of this finding is that the purine bias occurs because of a selective process induced (i) by the protein function40 or (ii) by ribosome machinery.41
Actually, our statistical analysis of the base composition according to the three codon positions and the protein secondary structures shows that the contribution of the amino acid synthesis, energy cost, and physicochemical constraints to secondary protein structures are the principal determinants. We showed that the purine bias results from the optimization of protein sequences through competition between (i) the information encoded by nucleotides, (ii) the secondary structure of proteins, (iii) the MW and hydropathy of secondary structures, and (iv) the energy cost of amino acid synthesis. The first codon position is optimized according to the energy cost of amino acid synthesis and amino acid MW or complexity, which are in favor of G1-rich codons. In contrast, in the second codon position, T2 is driven by physicochemical constraints on secondary structures, and A2 is driven by the MW. The periodicity that is needed for secondary protein structures induces a specific amino acid use whose consequence is a low purine rate in the second codon position.
It is the E structures that most contribute to the purine bias in the second codon position, followed by H and A structures. The striking positive correlation between T2 and hydropathy linearly matches the secondary structures and their respective access to solvent. In contrast, and however less strikingly, A2 correlated to the MW of the structures. Thus, the negative correlation between A2 and T2 confirms the negative correlation between MW and hydropathy. Hydrophilic amino acids are preferentially associated to A2 (all A2 codons encode hydrophilic amino acids), and hydrophobic amino acids are preferentially associated to T2 (all T2 codons encode hydrophobic amino acids).26 From these results, Chiusano et al.25 derived the general trend that “E structure has higher hydrophobicity values and, on the average, amino acids with higher MWs, whereas A structure is less hydrophobic and is composed of amino acids having lower MWs. H structure is intermediate, sharing a similar distribution with the E structure in the case of its MW, while it follows the behavior of the A structure in its hydrophobicity patterns.” The consequence of the link between the (i) first codon position through energy cost and (ii) the second codon position through the protein secondary structures shows that the purine bias somehow reflects physicochemical constraints on protein functionality.
It has been shown that nucleotide mutations may occur in the anticodon; however, these mutations can be compensated by matching mutations in their corresponding codon to maintain the amino acid association to a given codon. This adaptive process shows that a constant codon composition reshuffiing should occur41 without a selective process to maintain the purine bias as it is universally observed today throughout the biosphere. Interestingly, according to Ogle et al.16 and Almlöf et al.,42 G1 may promote larger H-bond interactions between A1493, mRNA, and tRNA than A1 in the ribosomal decoding center of the 30S subunit. Actually, the internal selectivity for codon recognition is enhanced by the stereospecific component provided by the ribosome, mainly A1492, A1493, and G530,42,43 and the ribosome contribution to the mRNA—tRNA complex stabilization by interacting with the minor groove of the Watson—Crick base pairs is general and essential for ribosome accuracy.16 Thus, the stability of the mRNA—tRNA complex in the ribosome A-site may be a selected process that promotes a specific codon preference in agreement with a larger R1. This hypothesis is in line with the observation that there is a general efficiency—accuracy trade-off in mRNA translation, and it has therefore been suggested that the bacterial ribosome has evolved to an overall accuracy of codon reading that maximizes the growth rate rather than the current accuracy. The maximal accuracy is highest for the second codon position and lowest for the third.15 Factors increasing mRNA—tRNA stability in the A-site are expected to promote such a trade-off.44 In reality, the codons believed to induce a “correct geometry” with their cognate tRNA according to the conformational changes in the three universally conserved 16S rRNA bases (A1492, A1493, and G530) could also correspond to the codons with larger R1 simply because they provide higher stability to the mRNA—tRNA complex in the A-site. Given the arguments above, the ribosome could contribute by proofreading to lower the energy cost of protein synthesis.
Many tRNAs can translate more than one codon, but with variable abilities. The codon best recognized by the anti-codon is preferred in highly expressed genes and may be translated faster than non-optimal codons with the consequence that ribosomes move faster along a mRNA molecule containing more optimal codons. The difference in optimal codons among species most likely reflects variation to the extent of which natural selection is effective in shaping codon usage.45 Following Sharp et al.,45 (i) the frequency of optimal codons in genes potentially under strong selection is given by the highly expressed genes, and alternatively, when genes are expressed at low levels and (ii) the codon usage of the genome as a whole is an estimate of the pattern of codon usage when selection is weak. The application of this reasoning to the purine bias tells us that the codons ending in A or G are not optimal in a global sense when compared to those ending in C or T because Y3 is preferred to R3. Thus, larger G or A levels in the first anticodon position are expected to be the optimal situation for cell growth. Actually, C3 occurs more frequently than G3 in GC-rich organisms, with the consequence that G of the first anticodon position will be preferred. G would promote larger tRNA—mRNA stability because it would involve three hydrogen bonds (in place of two if considering a pyrimidine) with U3 (T3 for DNA) or C3 in the corresponding mRNA codon. In GC-poor organisms, A3 is less frequent than T3 according to the purine bias. Thus, the preferred base in the first anticodon position is an A. Therefore, this configuration is expected to occur in organisms in which tRNA—mRNA stability is less critical. However, even in the case of a gene with strong selection pressure (see Sharp et al.45 for a discussion of selection pressure on codon usage), the first anticodon position will be a C in a GC-poor context.46 However, the reasoning just outlined must be considered with care. It is also true that in the case of human, C3-rich CDSs are expected to use more rare codons than G3-rich ones. Actually, several (seven) tRNA genes for the decoding of C3 codons seem to be missing in the human genome.47 A similar situation occurs for T3 because several (six) tRNA genes for the decoding of T3 codons seem also to be missing, which may argue in favor of considering the codon bias more as Rrr than RNY. Thus, in the human genome, Y3-rich genes are expected to use more rare codons with the consequence that the ribosome machinery is expected to pause more in these CDSs than in R3-rich ones because of the necessity to use cognate tRNA, and thus, their expression level should be lower. Therefore, Y3-rich CDSs are expected to be under different selective pressures compared to R3-rich CDSs.48 If C3-rich CDSs are effectively expressed at a low rate, more or less rare codons in these genes could possibly be without much consequence for cells; if this is true, it would justify why C3 may reach higher levels than G3 in the context of a compositional transition toward GC.
In addition to warm-blood vertebrates, several genomes from other eventually distant eukaryote families, such as those of rice and Chlamydomonas reinhardtii, also experienced a compositional transition toward GC in their evolution history.11 By contrast, others, such as Plasmodium falciparum, did a compositional transition toward AT. It would be interesting to look at the statistics of tRNA genes for the decoding of Y3 codons in these genomes to check whether tRNA genes for the decoding of Y3 codons are also missing.
The ribosome is especially equipped with a proofreading mechanism that improves the translation accuracy according to the first and second codon positions that warrant acceptable fidelity and functionality between the versions of a protein and their mold, that is, the CDSs. The third position satisfies this need with the thermodynamic stability of the codon—anticodon complex. Thus, one may conclude that the purine bias is the best compromise concerning (i) the constraints on the amino acid choice by secondary protein structures to match their global physicochemical properties and (ii) the optimization of tRNA—mRNA complex stability as well as ribosomal processing and accuracy.49 As a consequence, one can say that the backwards effect from protein to DNA base composition is the purine bias, which is also the reverse of the central dogma of biology ie, the coding information flows from DNA to protein. In other words, the purine bias is the imprinting in the DNA from the selective pressure on the functional necessities of proteins. In that sense, one can also say that proteins exert a selective process on the base composition of DNA at the CDS level and that this selective process may affect the genome organization according to the mutational bias toward GC or AT and other selective processes according to the functional necessities of coding DNA in relation to non-coding DNA (see Bernardi11 and Kudla et al.50). Because proteins exert universal constraints on DNA at the CDS level, this finding also explains why purine bias contributes to their universal classification.4,5
The purine bias described above as Rrr or Ggg is reminiscent of the GNC hypothesis on the origin of the genetic code.51 The GNC code could have originated from a four amino acid system encoded by GNC codons. This GNC code (G for guanine, N for any of the four nucleotides, and C for cytosine) is able to encode GADV-proteins (G for Gly, A for Ala, D for aspartic acid, and V for Val) with appropriate 3D structures, which would be water-soluble globular proteins (hydropathy, α-helix, β-sheet, and β-turn) and would also have catalytic activities.52 According to Ikehara et al.,51 this primitive code would have evolved first in a code with 16 codons and 10 amino acids, the so-called SNS (S for strong: G or C), and then in the RNY ancestral codon suggested by Shepherd.1 Thus, the primitive code would have first been optimized for the G1 codons that encode the simplest and most frequent amino acids, and would have evolved further to encode amino acids of higher complexity and energy cost. The conservation of this hierarchy warrants that the assembly of modern proteins is optimized for the lowest overall energy cost.
From a practical point of view, (i) the purine bias, (ii) MW = 10 × hydropathy + 130 relationship, (iii) the fact that the larger the MW, the lower the hydropathy of a structure (and vice versa), (iv) the statistical correlation of T2 with solvent access, hydropathy, and energy cost, (v) the statistical correlation between A2 and MW, and (vi) the association of low MW with G1 will have important consequences for synthetic biology and automatic screening of artificial sequences (synthetic genes53) for new functional properties. According to this view, the whole process of genetic variability and purifying selection can be simulated in silico. This finding opens the way for in silico investigation by the following sequence of steps: (i) sequence genesis according to random process inside a functional domain whose parameters are purine bias, MW, hydropathy, and energy cost of amino acid synthesis, (ii) 3D structure determination by ab initio process, (iii) false positive filtering through Ramachandran constraints,54 (iv) biosynthesis according to a biological system compatible for the GC level and codon bias, and (v) experimental testing in biological conditions. This pipeline would also allow the evolutionary inference of given proteins for resistant drug inhibitors in agriculture and medical sciences.
Supplementary Data
Supplementary Table 1. Statistic analysis of frequency differences of amino acids (AA) among secondary structures of proteins.
Supplementary Table 2. Correlations between amino acids in the H structures of protein sequences from PDB.
Supplementary Table 3. Similar table to Table S2, according to Es.
Supplementary Table 4. Similar table to Table S2 and S3, according to As.
Supplementary Table 5. Relative frequency of codons in secondary structures of non-redundant proteins from PDB.
Supplementary Table 6. Basic physico-chemical features of amino acids associated with purines and pyrimidines in the first codon position.
Supplementary Table 7. Weighted averages of some physico-chemical properties of amino acids shown in Figure 3 calculated from Table S5 according to As.
Supplementary Table 8. Similar table to Table S7, according to Hs.
Supplementary Table 9. Similar table to Table S7 and S8, according to Es.
Footnotes
ACADEMIC EDITOR: J.T. Efird, Associate Editor
FUNDING: This research was supported by the Brazilian agencies CAPES/UDELAR number 029/2007 to ABM and FAV, by CNPq and FIOCRUZ/CAPES (CDTS) providing a researcher fellowships to NC, and by the Urugayan agency ANII providing a research fee to FAV.
COMPETING INTERESTS: Authors disclose no potential conflicts of interest.
DISCLOSURES AND ETHICS
As a requirement of publication the authors have provided signed confirmation of their compliance with ethical and legal obligations including but not limited to compliance with ICMJE authorship and competing interests guidelines, that the article is neither under consideration for publication nor published elsewhere, of their compliance with legal and ethical guidelines concerning human and animal research participants (if applicable), and that permission has been obtained for reproduction of any copyrighted material. This article was subject to blind, independent, expert peer review. The reviewers reported no competing interests.
Author Contributions
Conceived and designed the experiments: NC, MPL. Analyzed the data: NC, MPL. Wrote the first draft of the manuscript: NC. Contributed to the writing of the manuscript: NC, FAV. Agree with manuscript results and conclusions: NC, FAV. Jointly developed the structure and arguments for the paper: NC. Made critical revisions and approved final version: NC, FAV. Funding: ABM, FAV. All authors reviewed and approved of the final manuscript.
REFERENCES
- 1.Shepherd JCW. Method to determine the reading frame of a protein from the purine/pyrimidine genome sequence and its possible evolutionary justification. Proc Natl Acad Sci USA. 1981;78:1596–600. doi: 10.1073/pnas.78.3.1596. [DOI] [PMC free article] [PubMed] [Google Scholar]
- 2.Mortimer JR, Forsdyke DR. Comparison of responses by bacteriophage and bacteria to pressures on the base composition of open reading frames. Appl Bioinformatics. 2003;2:47–62. [PubMed] [Google Scholar]
- 3.Carels N, Vidal R, Frias D. Universal features for the classification of coding and non-coding DNA sequences. Bioinform Biol Insights. 2009;3:37–49. doi: 10.4137/bbi.s2236. [DOI] [PMC free article] [PubMed] [Google Scholar]
- 4.Carels N, Frias D. Classifying coding DNA with nucleotide statistics. Bioinform Biol Insights. 2009;3:141–54. doi: 10.4137/bbi.s3030. [DOI] [PMC free article] [PubMed] [Google Scholar]
- 5.Carels N, Frias D. The contribution of stop codon frequency and purine bias to the classification of coding sequences. In: Mondaini R, editor. Biomat 2012: International Symposium on Mathematical and Computational Biology. World Scientific; Singapore: 2013. pp. 301–22. [Google Scholar]
- 6.Carels N, Frias D. A statistical method without training step for the classification of coding frame in transcriptome sequences. Bioinform Biol Insights. 2013;7:35–54. doi: 10.4137/BBI.S10053. [DOI] [PMC free article] [PubMed] [Google Scholar]
- 7.Cui X, Vinar T, Brejová B, Shasha D, Li M. Homology search for genes. Bioinformatics. 2007;23(ISMB/ECCB):i97–i103. doi: 10.1093/bioinformatics/btm225. [DOI] [PubMed] [Google Scholar]
- 8.Zhang S-L, Li D-F, Zhang G-S, et al. The prediction of rice gene by Fgenesh. Agric Sci China. 2008;7:387–94. [Google Scholar]
- 9.Morey C, Mookherjee S, Rajasekaran G, Bansal M. DNA free energy-based promoter prediction and comparative analysis of arabidopsis and rice genomes. Plant Physiol. 2011;156:1300–15. doi: 10.1104/pp.110.167809. [DOI] [PMC free article] [PubMed] [Google Scholar]
- 10.Costantini M, Bernardi G. Correlations between coding and contiguous non-coding sequences in isochore families from vertebrate genomes. Gene. 2008;410:241–8. doi: 10.1016/j.gene.2007.12.016. [DOI] [PubMed] [Google Scholar]
- 11.Bernardi G. Isochores and the evolutionary genomics of vertebrates. Gene. 2000;241:3–17. doi: 10.1016/s0378-1119(99)00485-0. [DOI] [PubMed] [Google Scholar]
- 12.Sanbonmatsu KY, Joseph S, Tung CS. Simulating movement of tRNA into the ribosome during decoding. Proc Natl Acad Sci USA. 2005;102:15854–9. doi: 10.1073/pnas.0503456102. [DOI] [PMC free article] [PubMed] [Google Scholar]
- 13.Schmeing TM, Ramakrishnan V. What recent ribosome structures have revealed about the mechanism of translation. Nature. 2009;461:1234–42. doi: 10.1038/nature08403. [DOI] [PubMed] [Google Scholar]
- 14.Whitford PC, Geggier P, Altman RB, Blanchard SC, Onuchic JN, Sanbonmatsu KY. Accommodation of aminoacyl-tRNA into the ribosome involves reversible excursions along multiple pathways. RNA. 2010;16:1196–204. doi: 10.1261/rna.2035410. [DOI] [PMC free article] [PubMed] [Google Scholar]
- 15.Johansson M, Zhang J, Ehrenberg M. Genetic code translation displays a linear trade-off between efficiency and accuracy of tRNA selection. Proc Natl Acad Sci USA. 2012;109:131–6. doi: 10.1073/pnas.1116480109. [DOI] [PMC free article] [PubMed] [Google Scholar]
- 16.Ogle JM, Carter AP, Ramakrishnan V. Insights into the decoding mechanism from recent ribosome structures. Trends Biochem Sci. 2003;28:259–66. doi: 10.1016/S0968-0004(03)00066-5. [DOI] [PubMed] [Google Scholar]
- 17.Ramakrishnan V. What we have learned from ribosome structures. Biochem Soc Trans. 2008;36:567–74. doi: 10.1042/BST0360567. [DOI] [PubMed] [Google Scholar]
- 18.Ogle JM, Brodersen DE, Clemons WM, Jr, Tarry MJ, Carter AP, Ramakrishnan V. Recognition of cognate transfer RNA by the 30S ribosomal subunit. Science. 2001;292:897–902. doi: 10.1126/science.1060612. [DOI] [PubMed] [Google Scholar]
- 19.Weixlbaumer A, Murphy FV, IV, Dziergowska A, et al. Mechanism for expanding the decoding capacity of transfer RNAs by modification of uridines. Nat Struct Mol Biol. 2007;14:498–502. doi: 10.1038/nsmb1242. [DOI] [PMC free article] [PubMed] [Google Scholar]
- 20.Kamtekar S, Schiffer JM, Xiong H, Babik JM, Hecht MH. Protein design by binary patterning of polar and nonpolar amino acids. Science. 1993;262:1680–5. doi: 10.1126/science.8259512. [DOI] [PubMed] [Google Scholar]
- 21.West MW, Hecht MH. Binary patterning of polar and nonpolar amino acids in the sequences and structures of native proteins. Protein Sci. 1995;4:2032–9. doi: 10.1002/pro.5560041008. [DOI] [PMC free article] [PubMed] [Google Scholar]
- 22.Schwartz R, King J. Frequencies of hydrophobic and hydrophilic runs and alternations in proteins of known structure. Protein Sci. 2006;15:102–12. doi: 10.1110/ps.051741806. [DOI] [PMC free article] [PubMed] [Google Scholar]
- 23.Bellesia G, Jewett AI, Shea JE. Sequence periodicity and secondary structure propensity in model proteins. Protein Sci. 2010;19:141–54. doi: 10.1002/pro.288. [DOI] [PMC free article] [PubMed] [Google Scholar]
- 24.Fujiwara K, Toda H, Ikeguchi M. Dependence of α-helical and β-sheet amino acid propensities on the overall protein fold type. BMC Struct Biol. 2012;12:18. doi: 10.1186/1472-6807-12-18. [DOI] [PMC free article] [PubMed] [Google Scholar]
- 25.Chiusano ML, Alvarez-Valin F, Di GiulioM, et al. Second codon positions of genes and the secondary structures of proteins. Relationships and implications for the origin of the genetic code. Gene. 2000;261:63–9. doi: 10.1016/s0378-1119(00)00521-7. [DOI] [PubMed] [Google Scholar]
- 26.Grantham R. Workings on the genetic code. Trends Biochem Sci. 1980;5:327–33. [Google Scholar]
- 27.Trifonov EN. Translation framing code and frame-monitoring mechanism as suggested by the analysis of mRNA and 16 S rRNA nucleotide sequences. J Mol Biol. 1987;194:643–52. doi: 10.1016/0022-2836(87)90241-5. [DOI] [PubMed] [Google Scholar]
- 28.Percudani R, Ottonello S. Selection at the wobble position of codons read by the same tRNA in Saccharomyces cerevisiae. Mol Biol Evol. 1999;16:1752–62. doi: 10.1093/oxfordjournals.molbev.a026087. [DOI] [PubMed] [Google Scholar]
- 29.Gutiérrez G, Márquez L, Marín A. Preference for guanosine at first codon position in highly expressed Escherichia coli genes. A relationship with translational efficiency. Nucleic Acids Res. 1996;24:2525–7. doi: 10.1093/nar/24.13.2525. [DOI] [PMC free article] [PubMed] [Google Scholar]
- 30.Percudani R, Pavesi A, Ottonello S. Transfer RNA gene redundancy and translational selection in Saccharomyces cerevisiae. J Mol Biol. 1997;268:322–30. doi: 10.1006/jmbi.1997.0942. [DOI] [PubMed] [Google Scholar]
- 31.Jolicoeur P. Bivariate allometry: interval estimation of the slopes of the ordinary and standardized normal major axes and structural relationship. J Theor Biol. 1990;144:275–85. [Google Scholar]
- 32.Kyte J, Doolittle RF. A simple method for displaying hydropathic character of a protein. J Mol Biol. 1982;157:105–32. doi: 10.1016/0022-2836(82)90515-0. [DOI] [PubMed] [Google Scholar]
- 33.Akashi H, Gojobori T. Metabolic efficiency and amino acid composition in the proteomes of Escherichia coli and Bacillus subtilis. Proc Natl Acad Sci USA. 2002;99:3695–700. doi: 10.1073/pnas.062526999. [DOI] [PMC free article] [PubMed] [Google Scholar]
- 34.Berman HM, Westbrook J, Feng Z, et al. The protein data bank. Nucleic Acids Res. 2000;28:235–42. doi: 10.1093/nar/28.1.235. [DOI] [PMC free article] [PubMed] [Google Scholar]
- 35.Altschul SF, Madden TL, Schäffer AA, et al. Gapped BLAST and PSI-BLAST: a new generation of protein database search programs. Nucleic Acids Res. 1997;25:3389–402. doi: 10.1093/nar/25.17.3389. [DOI] [PMC free article] [PubMed] [Google Scholar]
- 36.Martin ACR. Mapping PDB chains to UniProtKB entries. Nucleic Acids Res. 2005;21:4297–301. doi: 10.1093/bioinformatics/bti694. [DOI] [PubMed] [Google Scholar]
- 37.Smith TF, Waterman MS. Identification of common molecular subsequences. J Mol Biol. 1981;147:195–7. doi: 10.1016/0022-2836(81)90087-5. [DOI] [PubMed] [Google Scholar]
- 38.Moelbert S, Emberly E, Tang C. Correlation between sequence hydrophobicity and surface-exposure pattern of database proteins. Protein Sci. 2004;13:752–62. doi: 10.1110/ps.03431704. [DOI] [PMC free article] [PubMed] [Google Scholar]
- 39.Malkov SN, Zivković MV, Beljanski MV, Stojanović SD, Zarić SD. A reexamination of correlations of amino acids with particular secondary structures. Protein J. 2009;28:74–86. doi: 10.1007/s10930-009-9166-3. [DOI] [PubMed] [Google Scholar]
- 40.Ridout KE, Dixon CJ, Filatov DA. Positive selection differs between protein secondary structure elements in drosophila. Genome Biol Evol. 2010;2:166–79. doi: 10.1093/gbe/evq008. [DOI] [PMC free article] [PubMed] [Google Scholar]
- 41.Johnson DBF, Wang L. Imprints of the genetic code in the ribosome. Proc Natl Acad Sci USA. 2010;107:8298–303. doi: 10.1073/pnas.1000704107. [DOI] [PMC free article] [PubMed] [Google Scholar]
- 42.Almlöf M, Andér M, Åqvist J. Energetics of codon-anticodon recognition on the small ribosomal subunit. Biochemistry. 2007;46:200–9. doi: 10.1021/bi061713i. [DOI] [PubMed] [Google Scholar]
- 43.Demeshkina N, Jenner L, Yusupova G, Yusupov M. Interactions of the ribosome with mRNA and tRNA. Curr Opin Struct Biol. 2010;20:325–32. doi: 10.1016/j.sbi.2010.03.002. [DOI] [PubMed] [Google Scholar]
- 44.Sundaram M, Durant PC, Davis DR. Hypermodified nucleosides in the anticodon of tRNALys stabilize a canonical U-turn structure. Biochemistry. 2000;39:12575–84. doi: 10.1021/bi0014655. [DOI] [PubMed] [Google Scholar]
- 45.Sharp PM, Emery LR, Zeng K. Forces that influence the evolution of codon bias. Philos Trans R Soc Lond B Biol Sci. 2010;365:1203–12. doi: 10.1098/rstb.2009.0305. [DOI] [PMC free article] [PubMed] [Google Scholar]
- 46.Peixoto L, Fernandez V, Musto H. The effect of expression levels on codon usage in Plasmodium falciparum. Parasitology. 2004;128:245–51. doi: 10.1017/s0031182003004517. [DOI] [PubMed] [Google Scholar]
- 47.Frias D, Monteiro-Cunha JP, Mota-Miranda AC, et al. Human retrovirus codon usage from tRNA point of view: therapeutic insights. Bioinform Biol Insights. 2013;7:335–45. doi: 10.4137/BBI.S12093. [DOI] [PMC free article] [PubMed] [Google Scholar]
- 48.Parmley JL, Huynen MA. Clustering of codons with rare cognate tRNAs in human genes suggests an extra level of expression regulation. PLoS Genet. 2009;5(7):e1000548. doi: 10.1371/journal.pgen.1000548. [DOI] [PMC free article] [PubMed] [Google Scholar]
- 49.Huang Y, Koonin EV, Lipman DJ, Przytycka TM. Selection for minimization of translational frameshifting errors as a factor in the evolution of codon usage. Nucleic Acids Res. 2009;37:6799–810. doi: 10.1093/nar/gkp712. [DOI] [PMC free article] [PubMed] [Google Scholar]
- 50.Kudla G, Lipinski L, Caffin F, Helwak A, Zylicz M. High guanine and cytosine content increases mRNA levels in mammalian cells. PLoS Biol. 2006;4(e180):933–42. doi: 10.1371/journal.pbio.0040180. [DOI] [PMC free article] [PubMed] [Google Scholar]
- 51.Ikehara K, Omori Y, Arai R, Hirose A. A novel theory on the origin of the genetic code: a GNC-SNS hypothesis. J Mol Evol. 2002;54:530–8. doi: 10.1007/s00239-001-0053-6. [DOI] [PubMed] [Google Scholar]
- 52.Oba T, Fukushima J, Maruyama M, Iwamoto R, Ikehara K. Catalytic activities of [GADV]-peptides. Orig Life Evol Biosph. 2005;34:447–60. doi: 10.1007/s11084-005-3519-5. [DOI] [PubMed] [Google Scholar]
- 53.Koga N, Tatsumi-Koga R, Liu G, et al. Principles for designing ideal protein structures. Nature. 2012;491:222–9. doi: 10.1038/nature11600. [DOI] [PMC free article] [PubMed] [Google Scholar]
- 54.Zhou AQ, O’Hern C, Regan L. Revisiting the Ramachandran plot from a new angle. Protein Sci. 2011;20:1166–71. doi: 10.1002/pro.644. [DOI] [PMC free article] [PubMed] [Google Scholar]
Associated Data
This section collects any data citations, data availability statements, or supplementary materials included in this article.
Supplementary Materials
Supplementary Table 1. Statistic analysis of frequency differences of amino acids (AA) among secondary structures of proteins.
Supplementary Table 2. Correlations between amino acids in the H structures of protein sequences from PDB.
Supplementary Table 3. Similar table to Table S2, according to Es.
Supplementary Table 4. Similar table to Table S2 and S3, according to As.
Supplementary Table 5. Relative frequency of codons in secondary structures of non-redundant proteins from PDB.
Supplementary Table 6. Basic physico-chemical features of amino acids associated with purines and pyrimidines in the first codon position.
Supplementary Table 7. Weighted averages of some physico-chemical properties of amino acids shown in Figure 3 calculated from Table S5 according to As.
Supplementary Table 8. Similar table to Table S7, according to Hs.
Supplementary Table 9. Similar table to Table S7 and S8, according to Es.