

Abstract
Type 2 diabetes predicts accelerated cognitive decline and brain atrophy. We hypothesized that impaired fasting glucose (IFG) and incident glucose disorders have detrimental effects on global cognition and brain volume. We further hypothesized that metabolic and inflammatory derangements accompanying hyperglycaemia contribute to change in brain structure and function. This was a longitudinal study of a community-dwelling elderly cohort with neuropsychological testing (n = 880) and brain volumes by magnetic resonance imaging (n = 312) measured at baseline and 2 years. Primary outcomes were global cognition and total brain volume. Secondary outcomes were cognitive domains (processing speed, memory, language, visuospatial and executive function) and brain volumes (hippocampal, parahippocampal, precuneus and frontal lobe). Participants were categorised as normal, impaired fasting glucose at both assessments (stable IFG), baseline diabetes or incident glucose disorders (incident diabetes or IFG at 2 years). Measures included inflammatory cytokines and oxidative metabolites. Covariates were age, sex, education, non-English speaking background, smoking, blood pressure, lipid-lowering or antihypertensive medications, mood score, apolipoprotein E genotype and baseline cognition or brain volume. Participants with incident glucose disorders had greater decline in global cognition and visuospatial function compared to normal, similar to that observed in baseline diabetes. Homocysteine was independently associated with the observed effect of diabetes on executive function. Apolipoprotein E genotype did not influence the observed effects of diabetes on cognition. Incident glucose disorders and diabetes were also associated with greater 2-year decline in total brain volume, compared to normal (40.0 ± 4.2 vs. 46.7 ± 5.7 mm3 vs. 18.1 ± 6.2, respectively, p < 0.005). Stable IFG did not show greater decline in global cognition or brain volumes compared to normal. Incident glucose disorders, like diabetes, are associated with accelerated decline in global cognition and brain volumes in non-demented elderly, whereas stable IFG is not. Preventing deterioration in glucose metabolism in the elderly may help preserve brain structure and function.
Keywords: Diabetes, Glucose, Cognition, Dementia, Brain, Inflammation
Introduction
Type 2 diabetes mellitus (hereafter, diabetes) is a highly prevalent complex disease with classically recognized complications of nephropathy, retinopathy and peripheral neuropathy. Recent interest has focused on the adverse effects of diabetes on brain structure and cognition. Diabetes rates are highest in the elderly and may compound age-related brain changes, and the potential impact on cognition is of particular concern as diabetes self-care requires complex decision-making.
Diabetes has been estimated to increase dementia risk 1.3- to 3.4-fold, after adjustment for traditional vascular risk factors (Biessels et al. 2006; Strachan et al. 2011). Diabetes is longitudinally associated with cognitive decline in most (Elias et al. 1997; Fischer et al. 2009; Gregg et al. 2000; Grodstein et al. 2001; Hassing et al. 2004; Okereke et al. 2008; Yaffe et al. 2004, 2012) but not all (Euser et al. 2010; van den Berg et al. 2010) reports. Studies that have measured domain-specific cognitive function show greater decline in memory (Elias et al. 1997; Grodstein et al. 2001; Hassing et al. 2004; Okereke et al. 2008), executive function (Fischer et al. 2009; Grodstein et al. 2001; Okereke et al. 2008; van den Berg et al. 2010; Yaffe et al. 2004), language (Grodstein et al. 2001; Okereke et al. 2008), processing speed (Fischer et al. 2009; Gregg et al. 2000; Hassing et al. 2004) and abstract reasoning (Elias et al. 1997) in diabetics. Knowledge of pathogenic mechanisms is growing, as reviewed elsewhere (Strachan et al. 2011), with studies supporting a mediating role for inflammation (Marioni et al. 2010). Limitations in interpreting prior studies include small cohort numbers, variations in selection criteria and limited cognitive assessments. Published studies have variably adjusted for important confounders, including hypertension (Elias et al. 1997; Fischer et al. 2009; Gregg et al. 2000; Grodstein et al. 2001; Okereke et al. 2008), education (Elias et al. 1997; Gregg et al. 2000; Grodstein et al. 2001; Hassing et al. 2004; Okereke et al. 2008; Yaffe et al. 2004), hyperlipidaemia (Okereke et al. 2008), vascular disease (Elias et al. 1997; Gregg et al. 2000) and mood (van den Berg et al. 2010; Yaffe et al. 2004).
Structural brain changes have also been reported in diabetes (Feinkohl et al. 2013; Manschot et al. 2006, 2007; Tiehuis et al. 2008) including more frequent structural brain lesions (Manschot et al. 2007; Tiehuis et al. 2008). Cross-sectional studies report that diabetes is associated with greater cortical atrophy (Manschot et al. 2006; Schmidt et al. 2004; Tiehuis et al. 2008) and white matter hyperintensities (Manschot et al. 2006; Tiehuis et al. 2008), which are related to diabetes duration, glucose levels (Tiehuis et al. 2008), hypertension (Manschot et al. 2007) and vascular disease (Manschot et al. 2007). Greater increases in ventricular volume have been reported over 4 years (de Bresser et al. 2010; Kooistra et al. 2013). Published volumetric studies have thus far focused on total brain volume or its surrogates, and the impact of diabetes on regional brain volume is unclear. In particular, there are no published data examining brain regions that (at least in part) govern those cognitive domains where diabetes has been associated with more rapid cognitive decline, specifically memory (hippocampus, parahippocampus and precuneus) and executive function (frontal lobe).
While brain structure and function have been well studied in diabetes, data on the impact of impaired fasting glucose (IFG) and incident diabetes on cognition or brain volumes in the elderly are sparse. IFG is common in the elderly with prevalence rates of 35–50 % reported (Cowie et al. 2009; Sachdev et al. 2010). Longitudinal studies have inconsistently linked it with decline in processing speed, executive function and verbal memory (Euser et al. 2010; Yaffe et al. 2004, 2007). The effect of incident diabetes has not been examined.
Factors involved in the relationship between diabetes and brain changes include inflammation, oxidative stress and apolipoprotein E (APOE) ε4 genotype (Bermejo et al. 2008; Corder et al. 1993; Engelhart et al. 2004; Fuchs et al. 2013; Reynolds et al. 2010). Whether these factors contribute to or magnify the effects of diabetes in non-demented elderly is unclear.
In a large cohort of community-dwelling, non-demented elderly, this study examined the effects of impaired fasting glucose, incident glucose disorders and diabetes on global cognition and total brain volume over 2 years, controlling for multiple confounders. We hypothesized that, like diabetes, impaired fasting glucose and incident glucose disorders have detrimental effects on brain structure and function. We postulated that the inflammatory and oxidative milieu that accompanies hyperglycaemia contributes to cognitive decline and brain volume loss and that diabetes effects are compounded by the presence of dementia susceptibility APOE ε4 genotype.
Methods
Participants
Participants were drawn from the Sydney Memory and Ageing Study, a longitudinal population-derived cohort of adults recruited through the electoral roll, aged 70–90 years at baseline (n = 1,037) (Baune et al. 2012; Sachdev et al. 2010; Samaras et al. 2012). Exclusion criteria were as follows: insufficient English to complete assessments, major neurological or psychiatric disease, progressive malignancy and Mini-Mental State Examination score < 24 (Folstein et al. 1975), adjusted for age, education and non-English speaking background (Anderson et al. 2007) or a diagnosis of dementia. The study was approved by the local institutional Research and Ethics Committee. Participants gave written informed consent. Data were collected at baseline and at 2 years.
Participants completed a detailed questionnaire reporting medical conditions, current medications and years of education. Non-English speaking background was defined as English fluency acquired after the age of 9. Mood was measured by the 15-item Geriatric Depression Score (Yesavage et al. 1982).
Weight and height were measured and body mass index (BMI) calculated (weight/height2). Blood pressure was measured in the recumbent position after 15 min of rest. Participants were categorised as hypertensive if they received antihypertensives or had systolic >130 mmHg or diastolic >85 mmHg (Alberti et al. 2005).
Figure 1 shows participant inclusion; 85 % underwent neuropsychological testing at both assessments. All were offered brain magnetic resonance imaging (MRI), measured at both assessments in n = 312. MRI participants were similar for sex, were slightly younger (mean age 78.4 vs. 79.3 years, p = 0.005) and had more education (11.8 vs. 11.4 years, p = 0.03) compared to non-scanned participants; 54 % of scanned participants were female, diabetes prevalence was 10 % and IFG 41 %.
Fig. 1.

The Sydney Memory and Ageing Study: participant inclusion for cognition and brain MRI analyses
Diabetes ascertainment
Baseline diabetes status was determined by self-report of diabetes diagnosed by a medical practitioner or current anti-diabetic medication use. Three participants with type 1 diabetes were excluded. Participants reported age at diagnosis, medications and hypoglycaemia frequency. There were 106 participants who reported diabetes at baseline. Amongst participants without diabetes at baseline, fasting glucose was available in 687 participants, who were categorised as baseline normal fasting glucose (NFG; <5.6 mmol/l, n = 343) or IFG (5.6–6.9 mmol/l, n = 346) (American Diabetes Association 2012).
At 2 years, fasting glucose levels were available in 722 participants, who were categorised for a 2-year glucose status as follows: (1) stable NFG (NFG at both assessments, n = 211), (2) stable IFG (IFG at both assessments, n = 278), (3) baseline diabetes (n = 106) or (4) incident glucose disorders (baseline NFG with incident IFG or diabetes [fasting blood glucose >7.0 mmol/l (American Diabetes Association 2012)], n = 127).
Neuropsychological measures
Standardised neuropsychological tests were administered by trained psychology graduates to examine five cognitive domains, as described (Kochan et al. 2010; Sachdev et al. 2010; Zhang et al. 2012). Processing speed was evaluated by the Wechsler Adult Intelligence Scale-III Digit Symbol-Coding (Wechsler 1997a) and the Trail Making Test part A (TMT A) (Reitan and Wolfson 1985); memory by the Rey Auditory Verbal Learning test, (Rey 1964), Logical Memory story A (Wechsler 1997b) (delayed recall) and the Benton Visual Retention test recognition (BVRT) (Benton Sivan and Spreen 1996); verbal memory by measures in the memory domain except for BVRT; language by the Category Fluency Test (animals) (Spreen and Benton 1969) and the Boston Naming Test (30-item version) (Kaplan 2001); visuospatial ability by Block Design from the Wechsler Adult Intelligence Scale—Revised (Wechsler 1981); executive function by the Letter Fluency Test (Benton 1967) and the Trail Making Test part B (TMT B) (Reitan and Wolfson 1985).
Raw scores were converted to quasi Z-scores, based on the means and SDs of a normal cognition reference group derived from the cohort. Domain scores were calculated by averaging the Z-score of the component tests. Global cognition was obtained by averaging domain Z-scores.
Laboratory measures
Blood was collected after a 10-h overnight fast. Assay measurements were as follows: plasma glucose was measured by the glucose oxidase method (Beckman Coulter, Fullerton, CA). Total cholesterol, high-density lipoprotein cholesterol (HDL), triglycerides and urate levels were measured by the timed endpoint method (Beckman Coulter) and low-density lipoprotein cholesterol (LDL) by the Friedewald equation. Homocysteine levels were measured by reverse-phase high-performance liquid chromatography (HPLC) (BioRad, Munich, Germany). Malondialdehyde was measured by reverse-phase HPLC with ultraviolet detection. Cortisol and vitamin B12 levels were measured by chemiluminescent immunoassays (Access Immunoassay Systems). Interleukin (IL)-1β, IL-6 and tumour necrosis factor (TNF)-α levels were measured by cytometric bead array (BD Biosciences, San Jose, CA). Sandwich enzyme-linked immunosorbent assays measured vascular cell adhesion molecule-1 (VCAM-1), plasminogen activator inhibitor-1 (PAI-1) (Bender Medsystems GmbH, Vienna, Austria) and serum amyloid A (United States Biological, Marblehead, MA). Highly sensitive C-reactive protein (CRP) levels were measured by near-infrared particle immunoassay rate (Beckman Coulter Synchron LXi, Beckman Coulter), as described (Baune et al. 2012; Samaras et al. 2012). Non-normally distributed variables were transformed (logarithmically: insulin, HOMA-IR, triglycerides, CRP, serum amyloid A (SAA), PAI-1, vitamin B12 and homocysteine; or normalized rank-order scores: serum vascular cell adhesion molecule (sVCAM), IL-1β, IL-6 and TNF-α). Apolipoprotein E (APOE) genotyping was determined by peripheral blood or saliva deoxyribonucleic acid (n = 842, Taqman assays, Applied Biosystems Inc., Foster City, CA), as described (Zhang et al. 2012). Frequencies were as follows: ε2/2 < 1 %; ε2/3 = 13.7 %; ε2/4 = 1.6 %; ε3/3 = 63 %; ε3/4 = 19 %; ε4/4 = 1.9 %. Genetic susceptibility was defined as ε4 carriage.
Structural brain magnetic resonance imaging (MRI) and volumetry
Data were acquired by MRI, as described (Zhang et al. 2012), using a 3 T Intera Quasar or a 3 T Achieva Quasar Dual scanner (Philips Medical Systems). Acquisition parameters for T1-weighted structural MRI scans were as follows: TR = 6.39 ms, TE = 2.9 ms, flip angle = 8°, matrix size = 256 × 256, FOV = 256 × 256 × 190 and slice thickness = 1 mm with no gap, yielding 1 × 1 × 1 mm3 isotropic voxels. Grey matter (GM), white matter (WM), ventricular volume and total intracranial volume (TIV) (the sum of GM, WM and ventricular volumes) were measured. Total brain volume (TBV, cubic centimeter was defined as the sum of GM and WM). Participants scanned by the different scanners were similar for demographic and imaging parameters, with no significant differences in age, sex and years of education. GM, WM, ventricular volume and TIV were not significantly different, controlling for age and sex. To ensure that no error was introduced by scanner change, five participants were imaged on both scanners within 2 months; GM, WM volumes and TIV were not significantly different between the two instruments (Liu et al. 2011).
Regional grey matter volumes were calculated using 90 parcellations (45 regions for each hemisphere) delineated by the Automated Anatomical Labelling atlas (AAL) (Tzourio-Mazoyer et al. 2002). Grey matter volumes of the whole brain were arrived at using the voxel-based morphometry approach (Ashburner and Friston 2000) (Statistical Parametric Mapping software, Wellcome Department of Imaging Neuroscience, London, UK). Briefly, all T1-weighted MRI scans were visually inspected. Using the Markov random field option, unified segmentation delineated T1 images into regions, using the ICBM152 atlas as template. A series of customized templates and flow fields of GM and WM were generated by iterative registration (Ashburner 2007), with images registered to group templates to create the modulated warped tissue class image. Spatial normalization of GM to the Montreal Neurological Institute space was achieved using an affine transformation to the ICBM152 template. The 12-mm full-width at half maximum Gaussian kernel smoothing was performed to generate the voxel-based GM volumes.
A priori, we selected the following brain regions of interest: total brain volume, CSF volume, frontal lobe (as one region governing higher executive tasks and problem solving necessary for daily diabetes self-care) and hippocampus, parahippocampus and precuneus (as regions governing memory).
Statistical analyses
Variable distributions were examined and variables transformed where necessary. Creatinine, insulin, triglycerides, urate, homocysteine, B12, PAI-1, CRP and SAA were logarithmically transformed. Glucose, malondialdehyde, sVCAM, TNF-α, IL-1β and IL-6 were normalized by rank-order scores. Brain volume measures were normally distributed. Participants with and without baseline diabetes were compared for continuous variables using analysis of variance and categorical variables using contingency tables.
Cognition was examined as follows: (1) cognition in participants with and without baseline diabetes was compared using ANCOVA; (2) the impact of baseline diabetes on change in cognition over time was examined using repeated measures ANCOVA; and (3) the impact of 2-year glucose status (stable NFG, stable IFG, incident glucose disorders and baseline diabetes) on the change in cognition over time was examined using repeated measures ANCOVA. All analyses included the covariates of age, sex, education, non-English speaking background, smoking, blood pressure, lipid-lowering or antihypertensive medications, mood score and APOE ε4 status as covariates; in longitudinal analyses, baseline cognition was also included as a covariate.
Brain volumes were examined using a similar analytical design of (1) ANCOVA comparing baseline brain volumes in participants with and without diabetes; (2) repeated measures ANCOVA to compare the change in brain volumes between participants with and without diabetes; and (3) repeated measures ANCOVA to compare the change in brain volumes over 2 years between the categories of glucose status. Covariates included in the analyses were age, sex, education, non-English speaking background, smoking, blood pressure, lipid-lowering and antihypertensive medications and intracranial volume (the sum of total grey and white matter and CSF).
The independent effects of inflammatory and metabolic markers were examined in general linear model analyses of cognition and volumetry, with inclusion of these variables into the models. Model components also included diabetes, age, sex and baseline cognition or volumetry.
An interaction effect between APOE ε4 genotype and diabetes on cognition was sought using two-way ANOVA, with baseline cognition (time-1), 2-year cognition (time-2), setting an interaction term between APOE ε4 carrier status and diabetes and covariates of age, sex, education, non-English speaking background, smoking, blood pressure, lipid-lowering or antihypertensive medications, baseline cognition and mood score. Analyses were performed using IBM SPSS Statistics 20.
Results
Participant demographics
Table 1 shows baseline demographic and metabolic data. Twelve percent of participants had diagnosed diabetes and 39.5 % had IFG. Cerebrovascular disease and risk factor prevalence rates were as follows: stroke 4 %, transient ischaemic attack 6 %, ischaemic heart disease 33 %, acute myocardial infarct 11 %, hypertension 60 % and medications for hypertension 55 % or lipids 52 %. Most participants were Caucasian (98 %) and born in Australia (67 %) or Europe (18 %). Mean education duration was 11.6 years (range 3–24 years).
Table 1.
The Sydney Memory and Ageing Study: demographics and measures of metabolic markers and systemic inflammation
| Total = 880 | Diabetes mellitus (N = 106) | Non-diabetic (N = 774) | p valuea |
|---|---|---|---|
| Age (years) | 78.4 ± 4.7 | 78.4 ± 4.8 | NS |
| Sex (males) | 169/440 (39 %) | 264/506 (53 %) | <0.0001 |
| Weight (kg) | 77.6 ± 17.2 | 66.4 ± 14.6 | <0.0001 |
| Body mass index (kg/m2) | 28.7 ± 5.3 | 25.1 ± 04.7 | <0.0001 |
| Years of education | 11.9 ± 3.6 | 11.7 ± 3.5 | NS |
| Geriatric depression score | 2.1 ± 2.0 | 2.1 ± 1.9 | NS |
| Use of antihypertensive medications | 74 % | 58 % | 0.002 |
| Use of lipid-lowering medications | 75 % | 48 % | <0.0001 |
| Systolic blood pressure | 141 ± 21 | 148 ± 21 | NS |
| Diastolic blood pressure | 81 ± 11 | 83 ± 11 | 0.038 |
| ApoE ε3/4 or ε4/4 allele frequency | 19.2 % | 23.0 % | NS |
| Metabolic measures | |||
| Glucose (mmol/l) | 7.5 ± 1.8 | 5.6 ± 0.7 | <0.0001 |
| Fructosamine (μmol/l) | 204 ± 62 | 185 ± 54 | 0.002 |
| Insulin (μU/ml) | 20.4 ± 13.5 | 14.9 ± 6.3 | <0.0001 |
| Total cholesterol (mmol/l) | 4.1 ± 0.9 | 4.8 ± 1.0 | <0.0001 |
| HDL cholesterol (mmol/l) | 1.2 ± 0.4 | 1.5 ± 0.4 | <0.0001 |
| Triglycerides (μmol/l) | 1.3 ± 0.8 | 1.0 ± 0.5 | <0.0001 |
| Uric acid (mmol/l) | 0.36 ± 0.4 | 0.33 ± 0.3 | 0.003 |
| Malondialdehyde (μmol/l) | 15.4 ± 2.7 | 13.2 ± 1.8 | <0.0001 |
| Homocysteine (μmol/l) | 12.6 ± 3.9 | 11.1 ± 3.9 | <0.0001 |
| Vitamin B12 (pg/ml) | 169 ± 84 | 212 ± 298 | NS |
| Creatinine (μmol/l) | 92 ± 25 | 88 ± 27 | NS |
| eGFR | 51 ± 9 | 51 ± 9 | NS |
| Inflammatory biomarkers | |||
| PAI-1 (ng/ml) | 79 ± 31 | 82 ± 30 | NS |
| C-reactive protein (mg/l) | 2.4 ± 2.3 | 2.9 ± 5.1 | NS |
| sVCAM (ng/ml) | 1,173 ± 548 | 1,072 ± 766 | 0.005 |
| TNF-α (pg/ml) | 2.5 ± 2.3 | 2.9 ± 13.2 | NS |
| Interleukin-1β (pg/ml) | 3.3 ± 2.7 | 3.3 ± 7.1 | NS |
| Interleukin-6 (pg/ml) | 7.4 ± 5.3 | 6.2 ± 7.9 | 0.001 |
| Serum amyloid A (μg/ml) | 56.9 ± 82.7 | 56.3 ± 192.2 | 0.05 |
Data are presented as mean ± SD
ApoE apolipoprotein E, eGFR estimated glomerular filtration rate, PAI-1 plasminogen activator inhibitor-1, sVCAM serum vascular cell adhesion molecule-1, TNF tumour necrosis factor, NS not significant
aComparison of baseline data in participants with diabetes versus controls (data normalization by logarithmic transformation [insulin, triglycerides, urate, homocysteine, B12, PAI-1, CRP and SAA] or rank-order score transformation [glucose, malondialdehyde, sVCAM, TNF-α, IL-1β and IL-6])
Participants with diabetes had higher BMI, were more frequently female, more frequently treated with antihypertensive and lipid-lowering medications and had lower diastolic blood pressure and total and HDL cholesterol. Participants with diabetes had higher triglycerides, urate, homocysteine, malondialdehyde, VCAM and IL-6 levels. In participants with diagnosed diabetes, 69 % received oral diabetes medications, 11 % insulin and 5 % were treated with both; 11 % reported >2 episodes of hypoglycaemia.
Fasting glucose levels at baseline and at 2 years were available in 722 participants who were classified as follows: stable NFG (n = 211), stable IFG (n = 278), incident glucose disorders (baseline NFG with transition to IFG or DM, n = 127) and baseline diabetes (n = 106).
Baseline diabetes and changes in cognition
In the first interrogation of the effects of diabetes on cognition, participants with diabetes were compared to those without diabetes, as shown in Table 2. Baseline diabetes was associated with a greater decline in global cognition at 2 years, compared to those without diabetes, of borderline significance, after adjusting for baseline cognition, age, sex, years of education, non-English speaking background, smoking, blood pressure, lipid- and blood pressure-lowering medications, mood and APOE ε4 genotype. Amongst secondary outcomes, there was a greater decline in executive function in participants with baseline diabetes.
Table 2.
Cognition and brain volumes at baseline and 2 years: the Sydney Memory and Ageing Study
| Total = 880 | Diabetes mellitus | Non-diabetic | p value: comparisons between diabetic vs. non-diabetic | |||
|---|---|---|---|---|---|---|
| Baseline | 2 years | Baseline | 2 years | Baselinea | ∆ 2 yearsb | |
| Cognition (Z-scores)c | N = 106 | N = 774 | ||||
| Global cognition | −0.97 (0.12) | −1.38 (0.15) | −0.68 (0.05) | −0.92 (0.06) | 0.048 | 0.05 |
| Processing speed | −0.62 (0.11) | −0.91 (0.16) | −0.39 (0.05) | −0.53 (0.05) | 0.09 | 0.27 |
| Memory | −0.77 (0.11) | −0.97 (0.13) | −0.47 (0.04) | −0.61 (0.05) | 0.025 | 0.51 |
| Language | −0.93 (0.15) | −0.71 (0.06) | −1.23 (0.15) | −0.95 (0.06) | 0.21 | 0.46 |
| Visuospatial function | −0.92 (0.15) | −1.23 (0.17) | −0.71 (0.06) | −0.95 (0.06) | 0.21 | 0.18 |
| Executive function | −0.42 (0.10) | −0.59 (0.11) | −0.30 (0.04) | −0.36 (0.04) | 0.31 | 0.04 |
| MRI brain volumes | N = 33 | N = 279 | ||||
| Total brain volume (cm3) | 956.2 (20.9) | 915.0 (20.6) | 961.1 (6.3) | 935.6 (6.3) | 0.84 | 0.08 |
| CSF volume (cm3) | 675.5 (20.4) | 686.3 (21.3) | 688.1 (7.8) | 659.1 (7.7) | 0.60 | 0.02 |
| Frontal lobe volume (cm3) | 88.8 (0.8) | 83.1 (0.8) | 89.3 (2.3) | 81.2 (2.2) | 0.83 | 0.24 |
| Hippocampal volume (cm3) | 6.9 (0.1) | 6.6 (0.2) | 6.8 (0.04) | 6.7 (0.1) | 0.38 | 0.07 |
| Parahippocampal volume (cm3) | 7.9 (0.2) | 7.7 (0.2) | 7.6 (0.1) | 7.6 (0.1) | 0.14 | 0.05 |
| Precuneus volume (cm3) | 18.1 (0.5) | 16.7 (0.6) | 17.9 (0.2) | 16.6 (0.2) | 0.19 | 0.68 |
Data are presented as mean ± SEM. Analyses included the following covariates: cognition analyses—age, sex, years of education, non-English speaking background, smoking, blood pressure, lipid-lowering and antihypertensive medications, mood and APOE ε4 genotype; brain volume analyses—age, sex, smoking, blood pressure, intracranial volume and lipid-lowering and antihypertensive medications
CSF cerebrospinal fluid, MRI magnetic resonance imaging
aComparisons of baseline cognition Z-scores between participants with diabetes and no diabetes
bComparison of the 2-year change in cognition Z-score between participants with diabetes and no diabetes
cCognition is expressed in quasi Z-scores using means and standard deviations of a normal cognition reference group derived from the cohort
Participants with baseline diabetes were then compared to participants with stable normal fasting glucose over 2 years (Fig. 2). Baseline diabetes was associated with a significantly greater decline in global cognition, executive and visuospatial function.
Fig. 2.
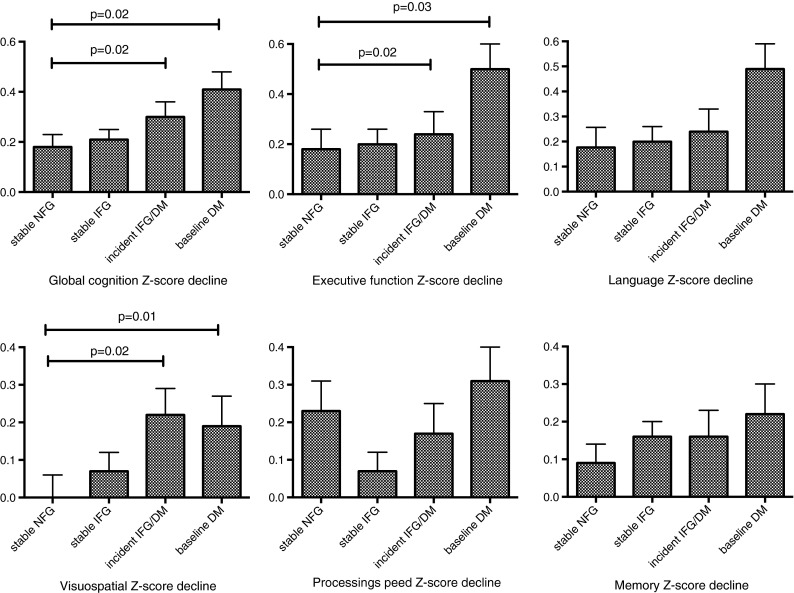
The Sydney Memory and Ageing Study. The impact of a 2-year glucose status on the decline in cognition. Analyses are adjusted for age, sex, smoking, years of education, non-English speaking background, blood pressure, lipid-lowering and antihypertensive medications, baseline cognition, mood and APOE ε4 status
IFG and changes in cognition
Participants without diabetes at baseline were categorised into NFG and IFG and compared for metabolic and inflammatory factors (Table 3). IFG was associated with male sex, more frequent use of lipid-lowering medications and higher weight, BMI, insulin, uric acid and malondialdehyde levels (Table 3). Baseline IFG was not associated with any greater decline in global cognition at 2 years, compared to participants with baseline NFG, adjusted for covariates (Table 3). Participants who maintained stable IFG over 2 years did not differ from participants with stable NFG for 2-year changes in global cognition or its domains (Fig. 2).
Table 3.
Impaired fasting glucose and the decline in cognition at 2 years: the Sydney Memory and Ageing Study
| Baseline normal fasting glucose | Baseline impaired fasting glucose | p valuesa | |
|---|---|---|---|
| N = 343 | N = 346 | ||
| Age (years) | 78.0 ± 4.8 | 78.6 ± 4.8 | NS |
| Sex (males) | 44 % | 56 % | 0.004 |
| Weight (kg) | 69.4 ± 13.9 | 73.9 ± 14.6 | <0.0001 |
| Body mass index (kg/m2) | 26.2 ± 4.6 | 27.4 ± 4.9 | <0.0001 |
| Years of education | 11.7 ± 3.5 | 11.6 ± 3.5 | NS |
| Geriatric depression score | 2.2 ± 1.9 | 2.1 ± 2.1 | NS |
| Use of antihypertensive medications | 49 % | 51 % | NS |
| Use of lipid-lowering medications | 45 % | 55 % | 0.01 |
| Systolic blood pressure | 143 ± 20 | 146 ± 20 | 0.04 |
| Diastolic blood pressure | 82 ± 10 | 83 ± 10 | NS |
| ApoE ε3/4 or ε4/4 allele frequency | 19 % | 23 % | NS |
| Metabolic measures | |||
| Glucose (mmol/l) | 5.1 ± 0.4 | 6.0 ± 0.3 | <0.0001 |
| Fructosamine (μmol/l) | 185 ± 52 | 185 ± 56 | NS |
| Insulin (μU/ml) | 13.6 ± 5.0 | 15.8 ± 6.5 | <0.0001 |
| Total cholesterol (mmol/l) | 4.9 ± 1.0 | 4.7 ± 0.9 | 0.017 |
| HDL cholesterol (mmol/l) | 1.5 ± 0.4 | 1.5 ± 0.4 | NS |
| Triglycerides (μmol/l) | 1.0 ± 0.4 | 1.1 ± 0.5 | 0.14 |
| Uric acid (mmol/l) | 0.32 ± 0.1 | 0.34 ± 0.1 | 0.001 |
| Malondialdehyde (μmol/l) | 12.7 ± 1.4 | 13.4 ± 1.9 | <0.0001 |
| Homocysteine (μmol/l) | 11.0 ± 3.8 | 11.3 ± 4.0 | NS |
| Vitamin B12 (pg/ml) | 207 ± 209 | 218 ± 375 | NS |
| Creatinine (μmol/l) | 86 ± 28 | 89 ± 26 | NS |
| eGFR | 51 ± 9 | 51 ± 9 | NS |
| Inflammatory biomarkers | |||
| PAI-1 (ng/ml) | 80 ± 31 | 84 ± 29 | NS |
| C-reactive protein (mg/l) | 2.8 ± 4.8 | 3.1 ± 5.5 | NS |
| sVCAM (ng/ml) | 1,078 ± 916 | 1,073 ± 613 | NS |
| TNF-α (pg/ml) | 2.1 ± 1.8 | 2.5 ± 3.2 | NS |
| Interleukin-1β (pg/ml) | 2.8 ± 1.9 | 3.1 ± 3.6 | NS |
| Interleukin-6 (pg/ml) | 5.9 ± 4.4 | 5.9 ± 3.8 | NS |
| Serum amyloid A (μg/ml) | 49.2 ± 132.7 | 64.6 ± 244.2 | NS |
| Changes in cognition at 2 years | |||
| ∆ Global cognition Z-score | −0.24 (0.04) | −0.23 (0.04) | 0.84 |
| ∆ Processing speed Z-score | −0.25 (0.06) | −0.12 (0.05) | 0.10 |
| ∆ Memory Z-score | −0.16 (0.05) | −0.15 (0.04) | 0.79 |
| ∆ Language Z-score | −0.24 (0.04) | −0.24 (0.05) | 0.89 |
| ∆ Visuospatial performance Z-score | −0.06 (0.04) | −0.07 (0.04) | 0.94 |
| ∆ Executive function Z-score | −0.19 (0.06) | −0.26 (0.06) | 0.50 |
| Changes in brain volumes at 2 years | N = 111 | N = 106 | |
| ∆ Total brain volume* (cm3) | −27.9 (4.1) | −29.7 (3.2) | 0.56 |
| ∆ CSF volume (cm3) | −15.6 (8.7) | −30.2 (7.7) | 0.41 |
| ∆ Frontal lobe volume (cm3) | −6.6 (0.9) | −6.5 (0.9) | 0.93 |
| ∆ Hippocampal volume (cm3) | 0.0 (0.05) | −0.2 (0.06) | 0.043 |
| ∆ Parahippocampal volume (cm3) | 0.0 (0.06) | −0.1 (0.04) | 0.05 |
| ∆ Precuneus volume (cm3) | −1.4 (0.1) | −1.4 (0.1) | 0.82 |
Data are mean (SEM). Comparisons of IFG versus no NFG included the following covariates: cognition analyses—age, sex, years of education, non-English speaking background, smoking, blood pressure, lipid-lowering and antihypertensive medications, mood and APOE ε4 genotype; brain volume analyses—age, sex, smoking, blood pressure, intracranial volume and lipid-lowering and antihypertensive medications
NS not significant
aComparison of data in participants with baseline normal fasting glucose versus baseline impaired fasting glucose (data normalization by logarithmic transformation [insulin, triglycerides, urate, homocysteine, B12, PAI-1, CRP and SAA] or rank-order score transformation [glucose, malondialdehyde, sVCAM, TNF-α, IL-1β and IL-6])
Incident glucose disorders and changes in cognition
The impact of incident glucose disorders on changes in cognition was examined. Participants with incident glucose disorders (baseline NFG with transition to IFG or DM) were compared to participants who maintained stable NFG (n = 211). Incident glucose disorders at 2 years were associated with a significantly greater decline in global cognition at 2 years, compared to stable NFG, after adjusting for baseline cognition, age, sex, years of education, non-English speaking background, smoking, blood pressure, lipid- and blood pressure-lowering medications, mood and APOE ε4 genotype (Fig. 2). In secondary domain measures, incident glucose disorders were associated with a greater decline in visuospatial function.
Baseline diabetes and changes in brain volume
In the MR subsample, participants with and without baseline diabetes had similar baseline brain volumes (Table 2). Baseline diabetes was associated with a significantly greater increase in CSF volumes, with trends observed for greater 2-year decline in total brain volume (TBV) and hippocampal, parahippocampal and precuneus volumes, compared to participants without diabetes.
Participants with diabetes were then compared to participants who maintained NFG over 2 years. Baseline diabetes was associated with significantly greater decline in TBV (Fig. 3). Amongst secondary MRI outcomes, baseline diabetes was associated with greater decline in frontal lobe and precuneus volumes (Fig. 3).
Fig. 3.
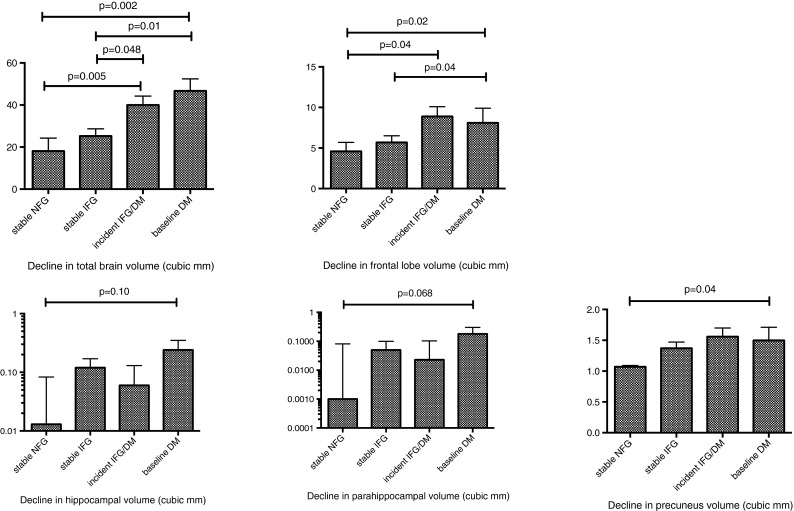
The Sydney Memory and Ageing Study. The impact of a 2-year glucose status on the decline in brain volumes. Analyses are adjusted for age, sex, smoking, blood pressure, lipid-lowering and antihypertensive medications and baseline volumetry
IFG and changes in brain volume
Baseline IFG was not associated with greater reduction in TBV or secondary MRI brain measures, compared to NFG (Table 3). Participants who maintained stable IFG over 2 years had similar reduction in TBV and secondary MRI brain measures, compared to participants who maintained NFG over 2 years (Table 3).
Incident glucose disorders and changes in brain volume
The rates of incident glucose disorders in the MR subset were as follows: diabetes 5.8 % (n = 18) and IFG 12 % (n = 38). Incident glucose disorders were associated with significantly greater decline in total brain volume (Fig. 3). Non-significant trends were observed for greater declines in the secondary MRI measures. Participants with incident diabetes and incident IFG were compared to determine if one group drove the observed association. Both groups were similar in the 2-year changes in brain volumes observed (Table 4).
Table 4.
Two-year decline in brain volumes measured by magnetic resonance in participants with incident type 2 diabetes mellitus and incident impaired fasting glucose: the Sydney Memory and Ageing Study
| Incident IFG (N = 38) | Incident DM (N = 18) | p value | |
|---|---|---|---|
| ∆ Total brain volume* (cm3) | −29.2 (8.4) | −36.6 (7.5) | 0.35 |
| ∆ CSF volume (cm3) | −14.3 (12.1) | 3.1 (14.7) | 0.44 |
| ∆ Frontal lobe volume (cm3) | −7.4 (2.0) | −6.3 (2.3) | 0.87 |
| ∆ Hippocampal volume (cm3) | 0.0 (0.1) | −0.2 (0.2) | 0.37 |
| ∆ Parahippocampal volume (cm3) | −0.2 (0.2) | −0.2 (0.1) | 0.54 |
| ∆ Precuneus volume (cm3) | −1.6 (0.3) | −1.5 (0.3) | 0.58 |
Data are mean (SEM)
Comparisons of incident IFG versus incident type 2 diabetes mellitus included the covariates of age, sex, smoking, blood pressure, intracranial volume and lipid- lowering and antihypertensive medications
Inflammatory markers, oxidative metabolism byproducts and APOE genotype
Metabolic factors and markers of systemic inflammation were considered as potential independent covariates of the association between diabetes and observed declines in cognition, TBV and frontal lobe volume. Participants with baseline diabetes had significantly lower total and HDL cholesterol and higher triglycerides, insulin, byproducts of oxidative metabolism (urate, malondialdehyde and homocysteine), VCAM and IL-6, with a trend for SAA (Table 1). Each was added to models predicting a 2-year global cognition and executive function. The models included diabetes, baseline cognition, age, sex, years of education, non-English speaking background, smoking, blood pressure, lipid- and blood pressure-lowering medications, mood and APOE ε4 genotype. No biochemical marker independently predicted the decline in global cognition (data not shown). For the 2-year decline in executive function, homocysteine was independently predictive (β = −0.61 p = 0.046). Interestingly, after the addition of homocysteine to the model, diabetes ceased to be an independent predictor (p = 0.07).
Models of 2-year TBV were constructed to include inflammatory and oxidative metabolism measures. A model including baseline TBV, age, sex, glucose category and CRP explained 82 % of 2-year TBV variance (p < 0.0001); independent predictors were baseline TBV (r2 = 0.74, p < 0.0001), 2-year glucose status (r2 = 0.04, p = 0.001) and CRP (r2 = 0.01, p = 0.04). A model containing urate also explained 82 % of the variance in TBV; independent predictors were baseline TBV (r2 = 0.75, p < 0.0001), glucose status (r2 = 0.04, p = 0.001) and urate (r2 = 0.02, p = 0.035).
Carrier frequency of the Alzheimer’s disease susceptibility genotypes APOE ε3/4 and 4/4 was similar in participants with and without diabetes (Table 1). No interaction was found between the effects of diabetes and APOE ε4 genotype on the 2-year change in global cognition and cognitive domain scores, adjusted for covariates (Table 5).
Table 5.
Diabetes and apolipoprotein E ε4 genotype: no interaction effect on the decline in cognition at 2 years: the Sydney Memory and Ageing Study
| Diabetes | Non-diabetic | p valuea | |||
|---|---|---|---|---|---|
| APOE ε4 carrier (n = 19) | APOE ε4 non-carrier (n = 79) | APOE ε4 carrier (n = 171) | APOE ε4 negative (n = 573) | ||
| ∆ Global cognition Z-score | −1.43 ± 0.28 | −0.94 ± 0.14 | −0.99 ± 0.09 | −0.76 ± 0.05 | 0.43 |
| ∆ Executive function Z-score | −1.27 ± 0.31 | −0.67 ± 0.15 | −0.65 ± 0.98 | −0.49 ± 0.05 | 0.22 |
| ∆ Memory Z-score | −0.99 ± 0.26 | −0.61 ± 0.12 | −0.81 ± 0.08 | −0.48 ± 0.04 | 0.84 |
| ∆ Attention speed Z-score | −0.94 ± 0.28 | −0.61 ± 0.14 | −0.61 ± 0.09 | −0.41 ± 0.05 | 0.72 |
| ∆ Language Z-score | −1.39 ± 0.31 | −0.81 ± 0.15 | −0.96 ± 0.10 | −0.83 ± 0.05 | 0.22 |
| ∆ Visuospatial Z-score | −0.47 ± 0.22 | −0.53 ± 0.11 | −0.35 ± 0.08 | −0.29 ± 0.04 | 0.65 |
N = 842. Data are mean ± SEM
aInteractions performed by two-way analysis of variance. Covariates include age, sex, education, non-English speaking background, blood pressure, lipid- and blood pressure-lowering medications and mood
Hypoglycaemia and treatment type in diabetes
Recurrent hypoglycaemia is associated with cognitive loss in type 1 diabetes. Thus, associations between hypoglycaemia frequency and treatment type and decline in global cognition and total brain volume were sought in participants with baseline diabetes. Participants reporting >2 episodes of hypoglycaemia had a similar decline in global cognition, compared to those not experiencing hypoglycaemia (−0.38 ± 0.22 vs. −0.41 ± 0.08, respectively, p = 0.88). Similarly, there were no associations between hypoglycaemia frequency and 2-year change in cognitive domains (data not shown). Participants reporting >2 episodes of hypoglycaemia also had a similar decline in total brain volume (−34.7 ± 11.7 vs. −43.8 ± 6.4 mm3, respectively, p = 0.73).
Treatment associations in participants with baseline diabetes were examined. The 2-year decline in global cognition was similar between participants using oral anti-diabetic medications compared to diet alone (data not shown). However, diet-alone-treated diabetes was associated with an almost 2-fold greater decline in TBV, compared to medication-treated diabetes (−68.7 ± 0.4 vs. −36.7 ± 0.8 mm3, respectively, p = 0.04). Diet-alone participants had higher LDL (2.9 ± 0.2 vs. 2.2 ± 0.1 mmol/l, p = 0.005), lower triglycerides (1.0 ± 0.1 vs. 1.4 ± 0.1 mmol/l, p = 0.04), lower BMI (27.2 ± 1.0 vs. 29.9 ± 0.06 kg/m2, p = 0.04) and less frequent lipid-lowering therapy (55 vs. 82 %, p = 0.017). Age, diabetes duration, blood pressure and serum levels of glucose, insulin, vitamin B12, HDL, CRP, homocysteine and urate were similar (data not shown).
Discussion
In this large study of community-dwelling elderly, we make the novel observation that stable IFG had no detrimental effects on brain volumes over 2 years. IFG also had no detrimental effect on cognition over 2 years, concurring with one (Euser et al. 2010) of three prospective cohort studies (Yaffe et al. 2004, 2007).
We make the further novel observation that incident glucose disorders, like type 2 diabetes, were associated with a greater 2-year decline in global cognition and total brain volume, independent of important risk factors including age, sex, education, lipid-lowering therapy, blood pressure, APOE ε4 carrier status, mood and inflammatory markers. Interestingly, the magnitude of decline in cognition and brain volumes was similar between participants with incident glucose disorders and baseline diabetes. As has been found in prior studies, baseline diabetes predicted a significant decline in global cognition and executive function (Fischer et al. 2009; Okereke et al. 2008; Tan et al. 2011; van den Berg et al. 2010; Yaffe et al. 2004). The finding of a greater decline in visuospatial function is new. Our findings contrast with the 4-year findings of the Utrecht Diabetes Encephalopathy Study, which reported that global cognition assessed over multiple domains declined at a rate similar between participants with diabetes versus controls (van den Berg et al. 2010). These contrasting findings might be explained by study differences not limited to age (a mean of 14 years older in the Sydney Memory and Ageing Study), size (880 vs. 106 in Utrecht), design (observational cohort recruited from an electoral roll vs. case-controlled and recruited from medical practices), differences in diabetes ascertainment and covariates included. In contrast to prior studies reporting specific cognitive domains, we found no detrimental effect of diabetes on processing speed (Hassing et al. 2004; van den Berg et al. 2010), explained by differences in cohort size, ascertainment, follow-up, sex distribution, lack of covariate inclusion and neuropsychological measures used. Our findings on memory concur with prior studies, which showed only trends after covariate adjustment (Elias et al. 1997; Grodstein et al. 2001; Okereke et al. 2008).
Our study found that stable IFG was not associated with any greater brain volume change at 2 years compared to stable NFG. In contrast, baseline diabetes and incident glucose disorders were associated with significantly greater decline in total brain and frontal lobe volumes, with the extent of loss of grey and white matter volume more than twice the magnitude observed in participants with stable NFG. The findings of a greater decline in frontal lobe volume in both incident glucose disorders and diabetes and a greater decline in precuneus volume in diabetes are novel.
This is one of the few studies reporting longitudinal brain volume change in diabetes (de Bresser et al. 2010; Kooistra et al. 2013; Launer et al. 2011) and adds to the understanding of structural brain change in diabetes. A strength of the study was the longitudinal examination of brain volume changes of specific brain regions that (at least in part) govern cognitive domains where accelerated cognitive decline in diabetes has been previously reported, specifically memory and executive function. To our knowledge, this is the first study to do so. The Utrecht Diabetic Encephalopathy Study Group reported increased CSF volume in 55 participants with diabetes over 4 years, compared to 28 controls (de Bresser et al. 2010) similar to the findings of our study over 2 years. The SMART-MR cohort study found that diabetes was associated with greater increases in intraventricular volume but no significant change in total grey and white matter volumes in 89 participants with diabetes, compared to 574 without (Kooistra et al. 2013). The ACCORD-MIND study, a randomized controlled study of intensified glucose control in diabetes, found that intervention was associated with greater preservation of total brain volume at 40 months, but no difference in cognition (Launer et al. 2011).
Our results add to the literature reporting longitudinal adverse effects of glucose disorders on brain volume. To our knowledge, this is the only longitudinal study to date to interrogate the impact of transition in glucose status on change in total brain volume. We found that incident glucose disorders predicted a decline in total brain volume, the magnitude of which was similar to that found for diabetes. This suggests that the impact of diabetes may not be explained simply by glucose exposure-duration effects. The pluripotent metabolic milieu of progressive hyperglycaemia may possibly exert detrimental effects on brain structure and function prior to detection of overt diabetes, as occurs in diabetes-related cardiovascular disease, which starts years before clinical diabetes becomes apparent. Our findings suggest that the stability of fasting glucose—even when in the impaired fasting glucose range—has little detrimental effects on the brain in the elderly, in contrast to rising fasting glucose which transitions through the internationally accepted fasting glucose categories. Stability in IFG suggests sufficient insulin secretion to maintain glucose status; transition from normal fasting glucose to IFG or diabetes suggests a progressive failure of insulin secretion and relative insulin insufficiency. Insulin exerts positive trophic effects on neural tissue and insulin deficiency is implicated in neurodegeneration (Arlt et al. 2012; Ho et al. 2013; Zhang et al. 2008). Further, there is clinical trial evidence supporting that insulin administration has benefits in cognitive impairment or dementia (Bosco et al. 2009; Craft et al. 2012). It is plausible that, in the “normally” ageing brain, declining insulin secretion may explain the decline in global cognition and brain volume observed in incident glucose disorders, in contrast to that observed in stable IFG where no detrimental effect was observed. Amongst participants with diabetes in this study, there was an insufficient number receiving insulin therapy to permit subgroup comparisons to detect whether insulin therapy may confer any protection. However, there is supportive evidence from a post hoc analysis from the ACCORD-MIND study, which found that insulin exposure was associated with less cognitive decline compared to thiazolidinedione exposure in the intensified treatment arm (Seaquist et al. 2013).
Inflammatory markers are considered to contribute to brain changes in the evolution of dementia (Strachan et al. 2011). Diabetes is characterized by low-grade inflammation, considered a consequence of excess nutrient load and flux. A strength of our study was the examination of inflammation markers and oxidative metabolism byproducts, as we hypothesized that low-grade inflammation might explain the cognitive decline associated with diabetes. No independent associations were found between inflammatory markers and cognition or total brain volume, where models included diabetes. Our results concur with a recent study that showed IL-6 levels did not predict a 12-month change in cognition in amnestic mild cognitive impairment (Karim et al. 2013) and contrast with a cross-sectional study showing a relationship of IL-6 levels with lower cognitive function (Marioni et al. 2010). However, homocysteine, a byproduct of oxidative metabolism, was independently and negatively associated with the decline in executive function and total brain volume, supporting prior studies (Bermejo et al. 2008). Higher homocysteine levels in diabetes may represent the biological response when nutrient excess overwhelms cellular metabolic capacity, with compensatory increases in oxidative metabolism. Resultant cellular stress, loss of function, and potentially, neurodegeneration are implied by clinical studies (Arlt et al. 2012) and shown in rodent studies (Ho et al. 2013; Zhang et al. 2008).
This study also examined for gene-environment interactions between known dementia susceptibility genotypes and diabetes to promote cognitive decline. We found no interaction between APOE ε4 carrier status and diabetes. Dementia was an exclusion criterion in the Sydney Memory and Ageing Study; it remains unknown whether diabetes interacts with APOE ε4 to confer greater susceptibility for accelerated cognitive decline in those with dementia.
The strengths of the study include longitudinal design, detailed evaluation of cognition, brain magnetic resonance, measurement of glucose status over 2 years for transition and adjustment for a comprehensive range of sociodemographic, inflammatory, metabolic and genetic covariates. Study limitations include the observational cohort design in healthy, community-dwelling participants, with probable selection and survivor bias. Nevertheless, the study cohort is representative of the increasing numbers of well-elderly in many communities. The study methodology included comprehensive evaluation of cognition over multiple domains, which were evaluated as secondary outcome measures. These were also compared; given that multiple comparisons were made of the cognitive domain data, caution is required in interpreting the p values, some of which were borderline after correction for multiple comparisons. Further, the cohort was mostly Caucasian; thus, results cannot be extrapolated to other groups. In non-diabetic participants, glucose status was ascertained by history and fasting glucose; the potential for misclassification of diabetes into “normal fasting glucose” exists, as glucose tolerance was not tested. Misclassification, if present, might inflate changes observed in controls and thus potentially strengthen any positive findings. No conclusions can be made regarding impaired glucose tolerance. The observation period was only 2 years; with a mean baseline age of 78 years, desirable longer term follow-up will be characterized by declining participant numbers. In examining IFG, this study did not examine for potential interactions with other components of the metabolic syndrome for which cross-sectional associations linking inflammation and lower cognitive performance are reported (Schuur et al. 2010). Longitudinal studies dissecting the impact of IFG and metabolic syndrome components on the brain are awaited.
The findings of this study are relevant to clinical practice. Should the elderly with diabetes regularly undergo assessment of cognitive function as part of annual complications screening? We can expect our elderly patients with diabetes to experience more rapidly declining cognition, including executive function. Executive function is fundamental to many aspects of diabetes self-care, with sound judgment necessary to respond appropriately to blood glucose fluctuations, problem solving with glucose monitoring equipment, dietary requirements and to discern food labelling and marketing claims. Standard diabetes education practice thus far has not sufficiently considered adapting self-care to declining executive function in the elderly. Different educational techniques and goals may be appropriate in the elderly, with perhaps greater innovation in the equipment and technology used to support diabetes care.
A further important clinical consideration is whether cognitive decline in diabetes can be prevented. The ACCORD-MIND study that reported 40 months of intensive diabetes treatment (compared to standard care) had no benefit on several measures of cognition; however, the decline in total brain volume was blunted (Launer et al. 2011). ACCORD-MIND included younger participants and also found increased mortality in the intensive treatment group (Gerstein et al. 2008). Given these findings and our own of a detrimental association between incident glucose disorders and decline in brain volume and aspects of cognition, clinical efforts should focus on diabetes prevention, particularly in the elderly, since this study shows that maintaining even IFG has, over 2 years, no detrimental association.
Acknowledgments
The study was supported by competitive funding from the Australian Government’s National Health and Medical Research Council (Dementia Research Grant 510124). The participants in the Sydney Memory and Ageing Study are thanked for their contribution to the scientific understanding of ageing.
Abbreviations
- APOE
Apolipoprotein E
- BMI
Body mass index
- CRP
highly sensitive C-reactive protein
- GM
Grey matter
- IFG
Impaired fasting glucose
- NFG
Normal fasting glucose
- PAI-1
Plasminogen activator inhibitor-1
- SAA
Serum amyloid A
- TBV
Total brain volume (the sum of grey matter and white matter)
- WM
White matter
- sVCAM
Serum vascular cell adhesion molecule
References
- Alberti KG, Zimmet P, Shaw J. The metabolic syndrome—a new worldwide definition. Lancet. 2005;366:1059–1062. doi: 10.1016/S0140-6736(05)67402-8. [DOI] [PubMed] [Google Scholar]
- Anderson TM, Sachdev PS, Brodaty H, Trollor JN, Andrews G. Effects of sociodemographic and health variables on Mini-Mental State Exam scores in older Australians. Am J Geriatr Psychiatry. 2007;15:467–476. doi: 10.1097/JGP.0b013e3180547053. [DOI] [PubMed] [Google Scholar]
- Arlt S, Schwedhelm E, Kolsch H, Jahn H, Linnebank M, Smulders Y, Jessen F, Boger RH, Popp J. Dimethylarginines, homocysteine metabolism, and cerebrospinal fluid markers for Alzheimer’s disease. J Alzheimer's dis : JAD. 2012;31:751–758. doi: 10.3233/JAD-2012-112138. [DOI] [PubMed] [Google Scholar]
- Ashburner J. A fast diffeomorphic image registration algorithm. Neuroimage. 2007;38:95–113. doi: 10.1016/j.neuroimage.2007.07.007. [DOI] [PubMed] [Google Scholar]
- Ashburner J, Friston KJ. Voxel-based morphometry—the methods. Neuroimage. 2000;11:805–821. doi: 10.1006/nimg.2000.0582. [DOI] [PubMed] [Google Scholar]
- Association AD. Diagnosis and classification of diabetes mellitus. Diabetes Care. 2012;35(Suppl 1):S64–S71. doi: 10.2337/dc12-s064. [DOI] [PMC free article] [PubMed] [Google Scholar]
- Baune BT, Smith E, Reppermund S, Air T, Samaras K, Lux O, Brodaty H, Sachdev PS, Trollor JN. Inflammatory biomarkers predict depressive, but not anxiety symptoms during aging: the prospective Sydney Memory and Aging Study. Psychoneuroendocrinology. 2012;37:1521–1530. doi: 10.1016/j.psyneuen.2012.02.006. [DOI] [PubMed] [Google Scholar]
- Benton AL. Problems of test construction in the field of aphasia. Cortex. 1967;3:32–58. doi: 10.1016/S0010-9452(67)80005-4. [DOI] [Google Scholar]
- Benton Sivan A, Spreen O (1996) Der Benton test. 7th edn. Huber, Bern.
- Bermejo P, Martin-Aragon S, Benedi J, Susin C, Felici E, Gil P, Ribera JM, Villar AM. Peripheral levels of glutathione and protein oxidation as markers in the development of Alzheimer’s disease from mild cognitive impairment. Free Radic Res. 2008;42:162–170. doi: 10.1080/10715760701861373. [DOI] [PubMed] [Google Scholar]
- Biessels GJ, Staekenborg S, Brunner E, Brayne C, Scheltens P. Risk of dementia in diabetes mellitus: a systematic review. Lancet Neurol. 2006;5:64–74. doi: 10.1016/S1474-4422(05)70284-2. [DOI] [PubMed] [Google Scholar]
- Bosco D, Costa R, Plastino M, Branca D, Cotronei P, Sperli T, Santacroce N, Siniscalchi A, Consoli D, Ceccotti C, Mungari P, Fava A. Glucose metabolism in the idiopathic blepharoptosis: utility of the Oral Glucose Tolerance Test (OGTT) and of the Insulin Resistance Index. J Neurol Sci. 2009;284:24–28. doi: 10.1016/j.jns.2009.03.017. [DOI] [PubMed] [Google Scholar]
- Corder EH, Saunders AM, Strittmatter WJ, Schmechel DE, Gaskell PC, Small GW, Roses AD, Haines JL, Pericak-Vance MA. Gene dose of apolipoprotein E type 4 allele and the risk of Alzheimer’s disease in late onset families. Science. 1993;261:921–923. doi: 10.1126/science.8346443. [DOI] [PubMed] [Google Scholar]
- Cowie CC, Rust KF, Ford ES, Eberhardt MS, Byrd-Holt DD, Li C, Williams DE, Gregg EW, Bainbridge KE, Saydah SH, Geiss LS. Full accounting of diabetes and pre-diabetes in the U.S. population in 1988–1994 and 2005–2006. Diabetes Care. 2009;32:287–294. doi: 10.2337/dc08-1296. [DOI] [PMC free article] [PubMed] [Google Scholar]
- Craft S, Baker LD, Montine TJ, Minoshima S, Watson GS, Claxton A, Arbuckle M, Callaghan M, Tsai E, Plymate SR, Green PS, Leverenz J, Cross D, Gerton B. Intranasal insulin therapy for Alzheimer disease and amnestic mild cognitive impairment: a pilot clinical trial. Arch Neurol. 2012;69:29–38. doi: 10.1001/archneurol.2011.233. [DOI] [PMC free article] [PubMed] [Google Scholar]
- de Bresser J, Tiehuis AM, van den Berg E, Reijmer YD, Jongen C, Kappelle LJ, Mali WP, Viergever MA, Biessels GJ. Progression of cerebral atrophy and white matter hyperintensities in patients with type 2 diabetes. Diabetes Care. 2010;33:1309–1314. doi: 10.2337/dc09-1923. [DOI] [PMC free article] [PubMed] [Google Scholar]
- Elias PK, Elias MF, D’Agostino RB, Cupples LA, Wilson PW, Silbershatz H, Wolf PA. NIDDM and blood pressure as risk factors for poor cognitive performance. The Framingham Study. Diabetes Care. 1997;20:1388–1395. doi: 10.2337/diacare.20.9.1388. [DOI] [PubMed] [Google Scholar]
- Engelhart MJ, Geerlings MI, Meijer J, Kiliaan A, Ruitenberg A, van Swieten JC, Stijnen T, Hofman A, Witteman JC, Breteler MM. Inflammatory proteins in plasma and the risk of dementia: the Rotterdam Study. Arch Neurol. 2004;61:668–672. doi: 10.1001/archneur.61.5.668. [DOI] [PubMed] [Google Scholar]
- Euser SM, Sattar N, Witteman JC, Bollen EL, Sijbrands EJ, Hofman A, Perry IJ, Breteler MM, Westendorp RG. A prospective analysis of elevated fasting glucose levels and cognitive function in older people: results from PROSPER and the Rotterdam Study. Diabetes. 2010;59:1601–1607. doi: 10.2337/db09-0568. [DOI] [PMC free article] [PubMed] [Google Scholar]
- Feinkohl I, Keller M, Robertson CM, Morling JR, Williamson RM, Nee LD, McLachlan S, Sattar N, Welsh P, Reynolds RM, Russ TC, Deary IJ, Strachan MW, Price JF, On behalf of the Edinburgh Type 2 Diabetes Study I Clinical and subclinical macrovascular disease as predictors of cognitive decline in older patients with type 2 diabetes: the Edinburgh Type 2 Diabetes Study. Diabetes Care. 2013;36(9):2779–2786. doi: 10.2337/dc12-2241. [DOI] [PMC free article] [PubMed] [Google Scholar]
- Fischer AL, de Frias CM, Yeung SE, Dixon RA. Short-term longitudinal trends in cognitive performance in older adults with type 2 diabetes. J Clin Exp Neuropsychol. 2009;31:809–822. doi: 10.1080/13803390802537636. [DOI] [PMC free article] [PubMed] [Google Scholar]
- Folstein MF, Folstein SE, McHugh PR. Mini-mental state. A practical method for grading the cognitive state of patients for the clinician. J Psychiatr Res. 1975;12:189–198. doi: 10.1016/0022-3956(75)90026-6. [DOI] [PubMed] [Google Scholar]
- Fuchs T, Trollor JN, Crawford J, Brown DA, Baune BT, Samaras K, Campbell L, Breit SN, Brodaty H, Sachdev P, Smith E. Macrophage inhibitory cytokine-1 is associated with cognitive impairment and predicts cognitive decline—the Sydney Memory and Aging Study. Aging cell. 2013;12(5):882–889. doi: 10.1111/acel.12116. [DOI] [PubMed] [Google Scholar]
- Gerstein HC, Miller ME, Byington RP, Goff DC, Jr, Bigger JT, Buse JB, Cushman WC, Genuth S, Ismail-Beigi F, Grimm RH, Jr, Probstfield JL, Simons-Morton DG, Friedewald WT. Effects of intensive glucose lowering in type 2 diabetes. New England J Med. 2008;358:2545–2559. doi: 10.1056/NEJMoa0802743. [DOI] [PMC free article] [PubMed] [Google Scholar]
- Gregg EW, Yaffe K, Cauley JA, Rolka DB, Blackwell TL, Narayan KM, Cummings SR. Is diabetes associated with cognitive impairment and cognitive decline among older women? Study of Osteoporotic Fractures Research Group. Arch Intern Med. 2000;160:174–180. doi: 10.1001/archinte.160.2.174. [DOI] [PubMed] [Google Scholar]
- Grodstein F, Chen J, Wilson RS, Manson JE. Type 2 diabetes and cognitive function in community-dwelling elderly women. Diabetes Care. 2001;24:1060–1065. doi: 10.2337/diacare.24.6.1060. [DOI] [PubMed] [Google Scholar]
- Hassing LB, Grant MD, Hofer SM, Pedersen NL, Nilsson SE, Berg S, McClearn G, Johansson B. Type 2 diabetes mellitus contributes to cognitive decline in old age: a longitudinal population-based study. J Int Neuropsychol Soc. 2004;10:599–607. doi: 10.1017/S1355617704104165. [DOI] [PubMed] [Google Scholar]
- Ho N, Sommers MS, Lucki I. Effects of diabetes on hippocampal neurogenesis: links to cognition and depression. Neurosci Biobehav Rev. 2013;37:1346–1362. doi: 10.1016/j.neubiorev.2013.03.010. [DOI] [PMC free article] [PubMed] [Google Scholar]
- Kaplan E. The Boston naming test. Philadelphia: Lippincott Williams & Wilkins; 2001. [Google Scholar]
- Karim S, Hopkins S, Purandare N, Crowther J, Morris J, Tyrrell P, Burns A. Peripheral inflammatory markers in amnestic mild cognitive impairment. Int J Geriatr Psychiatry. 2013 doi: 10.1002/gps.3988. [DOI] [PMC free article] [PubMed] [Google Scholar]
- Kochan NA, Slavin MJ, Brodaty H, Crawford JD, Trollor JN, Draper B, Sachdev PS. Effect of different impairment criteria on prevalence of ‘objective’ mild cognitive impairment in a community sample. Am J Geriatr Psychiatry. 2010;18:711–722. doi: 10.1097/JGP.0b013e3181d6b6a9. [DOI] [PubMed] [Google Scholar]
- Kooistra M, Geerlings MI, Mali WP, Vincken KL, van der Graaf Y, Biessels GJ, on behalf of the S-MRSG Diabetes mellitus and progression of vascular brain lesions and brain atrophy in patients with symptomatic atherosclerotic disease. The SMART-MR study. J Neurol Sci. 2013;332(1–2):69–74. doi: 10.1016/j.jns.2013.06.019. [DOI] [PubMed] [Google Scholar]
- Launer LJ, Miller ME, Williamson JD, Lazar RM, Gerstein HC, Murray AM, Sullivan M, Horowitz KR, Ding J, Marcovina S, Lovato LC, Lovato J, Margolis KL, O’Connor P, Lipkin EW, Hirsch J, Coker L, Maldjian J, Sunshine JL, Truwit C, Davatzikos C, Bryan RN. Effects of intensive glucose lowering on brain structure and function in people with type 2 diabetes (ACCORD MIND): a randomised open-label substudy. Lancet Neurol. 2011;10:969–977. doi: 10.1016/S1474-4422(11)70188-0. [DOI] [PMC free article] [PubMed] [Google Scholar]
- Liu T, Wen W, Zhu W, Kochan NA, Trollor JN, Reppermund S, Jin JS, Luo S, Brodaty H, Sachdev PS. The relationship between cortical sulcal variability and cognitive performance in the elderly. NeuroImage. 2011;56:865–873. doi: 10.1016/j.neuroimage.2011.03.015. [DOI] [PubMed] [Google Scholar]
- Manschot SM, Brands AM, van der Grond J, Kessels RP, Algra A, Kappelle LJ, Biessels GJ. Brain magnetic resonance imaging correlates of impaired cognition in patients with type 2 diabetes. Diabetes. 2006;55:1106–1113. doi: 10.2337/diabetes.55.04.06.db05-1323. [DOI] [PubMed] [Google Scholar]
- Manschot SM, Biessels GJ, de Valk H, Algra A, Rutten GE, van der Grond J, Kappelle LJ. Metabolic and vascular determinants of impaired cognitive performance and abnormalities on brain magnetic resonance imaging in patients with type 2 diabetes. Diabetologia. 2007;50:2388–2397. doi: 10.1007/s00125-007-0792-z. [DOI] [PMC free article] [PubMed] [Google Scholar]
- Marioni RE, Strachan MW, Reynolds RM, Lowe GD, Mitchell RJ, Fowkes FG, Frier BM, Lee AJ, Butcher I, Rumley A, Murray GD, Deary IJ, Price JF. Association between raised inflammatory markers and cognitive decline in elderly people with type 2 diabetes: the Edinburgh Type 2 Diabetes Study. Diabetes. 2010;59:710–713. doi: 10.2337/db09-1163. [DOI] [PMC free article] [PubMed] [Google Scholar]
- Okereke OI, Kang JH, Cook NR, Gaziano JM, Manson JE, Buring JE, Grodstein F. Type 2 diabetes mellitus and cognitive decline in two large cohorts of community-dwelling older adults. J Am Geriatr Soc. 2008;56:1028–1036. doi: 10.1111/j.1532-5415.2008.01686.x. [DOI] [PubMed] [Google Scholar]
- Reitan RM, Wolfson D. The Halstead-Reitan neuropsycholgical test battery: theory and clinical interpretation. Tucson: Neuropsychological Press; 1985. [Google Scholar]
- Rey A. L’examen clinique en psychologie. Paris: Presses Universitaires de France; 1964. [Google Scholar]
- Reynolds RM, Strachan MW, Labad J, Lee AJ, Frier BM, Fowkes FG, Mitchell R, Seckl JR, Deary IJ, Walker BR, Price JF. Morning cortisol levels and cognitive abilities in people with type 2 diabetes: the Edinburgh type 2 diabetes study. Diabetes Care. 2010;33:714–720. doi: 10.2337/dc09-1796. [DOI] [PMC free article] [PubMed] [Google Scholar]
- Sachdev PS, Brodaty H, Reppermund S, Kochan NA, Trollor JN, Draper B, Slavin MJ, Crawford J, Kang K, Broe GA, Mather KA, Lux O. The Sydney Memory and Ageing Study (MAS): methodology and baseline medical and neuropsychiatric characteristics of an elderly epidemiological non-demented cohort of Australians aged 70–90 years. Int Psychogeriatr. 2010;22:1248–1264. doi: 10.1017/S1041610210001067. [DOI] [PubMed] [Google Scholar]
- Samaras K, Crawford J, Baune BT, Campbell LV, Smith E, Lux O, Brodaty H, Trollor JN, Sachdev P. The value of the metabolic syndrome concept in the elderly: is it worth less than the sum of its parts? J Am Geriatr Soc. 2012;60:1734–1741. doi: 10.1111/j.1532-5415.2012.04105.x. [DOI] [PubMed] [Google Scholar]
- Schmidt R, Launer LJ, Nilsson LG, Pajak A, Sans S, Berger K, Breteler MM, de Ridder M, Dufouil C, Fuhrer R, Giampaoli S, Hofman A. Magnetic resonance imaging of the brain in diabetes: the Cardiovascular Determinants of Dementia (CASCADE) Study. Diabetes. 2004;53:687–692. doi: 10.2337/diabetes.53.3.687. [DOI] [PubMed] [Google Scholar]
- Schuur M, Henneman P, van Swieten JC, Zillikens MC, de Koning I, Janssens AC, Witteman JC, Aulchenko YS, Frants RR, Oostra BA, van Dijk KW, van Duijn CM. Insulin-resistance and metabolic syndrome are related to executive function in women in a large family-based study. Eur J Epidemiol. 2010;25:561–568. doi: 10.1007/s10654-010-9476-y. [DOI] [PMC free article] [PubMed] [Google Scholar]
- Seaquist ER, Miller ME, Fonseca V, Ismail-Beigi F, Launer LJ, Punthakee Z, Sood A. Effect of thiazolidinediones and insulin on cognitive outcomes in ACCORD-MIND. J Diabetes Complicat. 2013;27(5):485–491. doi: 10.1016/j.jdiacomp.2013.03.005. [DOI] [PMC free article] [PubMed] [Google Scholar]
- Spreen O, Benton AL. Neurosensory Center Comprehensive Examination for Aphasia: manual of instructions (NCCEA) Victoria: University of Victoria; 1969. [Google Scholar]
- Strachan MW, Reynolds RM, Marioni RE, Price JF. Cognitive function, dementia and type 2 diabetes mellitus in the elderly. Nat Rev Endocrinol. 2011;7:108–114. doi: 10.1038/nrendo.2010.228. [DOI] [PubMed] [Google Scholar]
- Tan ZS, Beiser AS, Fox CS, Au R, Himali JJ, Debette S, Decarli C, Vasan RS, Wolf PA, Seshadri S. Association of metabolic dysregulation with volumetric brain magnetic resonance imaging and cognitive markers of subclinical brain aging in middle-aged adults: the Framingham Offspring Study. Diabetes Care. 2011;34:1766–1770. doi: 10.2337/dc11-0308. [DOI] [PMC free article] [PubMed] [Google Scholar]
- Tiehuis AM, van der Graaf Y, Visseren FL, Vincken KL, Biessels GJ, Appelman AP, Kappelle LJ, Mali WP. Diabetes increases atrophy and vascular lesions on brain MRI in patients with symptomatic arterial disease. Stroke. 2008;39:1600–1603. doi: 10.1161/STROKEAHA.107.506089. [DOI] [PubMed] [Google Scholar]
- Tzourio-Mazoyer N, Landeau B, Papathanassiou D, Crivello F, Etard O, Delcroix N, Mazoyer B, Joliot M. Automated anatomical labeling of activations in SPM using a macroscopic anatomical parcellation of the MNI MRI single-subject brain. Neuroimage. 2002;15:273–289. doi: 10.1006/nimg.2001.0978. [DOI] [PubMed] [Google Scholar]
- van den Berg E, Reijmer YD, de Bresser J, Kessels RP, Kappelle LJ, Biessels GJ. A 4 year follow-up study of cognitive functioning in patients with type 2 diabetes mellitus. Diabetologia. 2010;53:58–65. doi: 10.1007/s00125-009-1571-9. [DOI] [PMC free article] [PubMed] [Google Scholar]
- Wechsler D. Wechsler adult intelligence scale—revised: manual. New York: Psychological Corporation; 1981. [Google Scholar]
- Wechsler D. Wechsler Adult Intelligence Scale—version III (WAIS-III) Harcourt Brace & Co, San Antonio: Psychological Corporation; 1997. [Google Scholar]
- Wechsler D. Wechsler Memory Scale—version III (WMS-III) Harcourt Brace & Co, San Antonio: Psychological Corporation; 1997. [Google Scholar]
- Yaffe K, Blackwell T, Kanaya AM, Davidowitz N, Barrett-Connor E, Krueger K. Diabetes, impaired fasting glucose, and development of cognitive impairment in older women. Neurology. 2004;63:658–663. doi: 10.1212/01.WNL.0000134666.64593.BA. [DOI] [PubMed] [Google Scholar]
- Yaffe K, Haan M, Blackwell T, Cherkasova E, Whitmer RA, West N. Metabolic syndrome and cognitive decline in elderly Latinos: findings from the Sacramento Area Latino Study of Aging study. J Am Geriatr Soc. 2007;55:758–762. doi: 10.1111/j.1532-5415.2007.01139.x. [DOI] [PubMed] [Google Scholar]
- Yaffe K, Falvey CNH, Schwartz AV, Simonsick EM, Satterfield S, Cauley JA, Rosano C, Launer LJ, Strotomeyer ES, Harris TB. Diabetes, glucose control, and 9-year cognitive decline among older adults without dementia. Arch Neurol. 2012;69(9):1170–1175. doi: 10.1001/archneurol.2012.1117. [DOI] [PMC free article] [PubMed] [Google Scholar]
- Yesavage JA, Brink TL, Rose TL, Lum O, Huang V, Adey M, Leirer VO. Development and validation of a geriatric depression screening scale: a preliminary report. J Psychiatr Res. 1982;17:37–49. doi: 10.1016/0022-3956(82)90033-4. [DOI] [PubMed] [Google Scholar]
- Zhang CE, Tian Q, Wei W, Peng JH, Liu GP, Zhou XW, Wang Q, Wang DW, Wang JZ. Homocysteine induces tau phosphorylation by inactivating protein phosphatase 2A in rat hippocampus. Neurobiol Aging. 2008;29:1654–1665. doi: 10.1016/j.neurobiolaging.2007.04.015. [DOI] [PubMed] [Google Scholar]
- Zhang H, Sachdev PS, Wen W, Kochan NA, Crawford JD, Brodaty H, Slavin MJ, Reppermund S, Draper B, Zhu W, Kang K, Trollor JN. Gray matter atrophy patterns of mild cognitive impairment subtypes. J Neurol Sci. 2012;315:26–32. doi: 10.1016/j.jns.2011.12.011. [DOI] [PubMed] [Google Scholar]