Abstract
Present data suggest that the consumption of individual dietary supplements does not enhance the health or longevity of healthy rodents or humans. It might be argued that more complex combinations of such agents might extend lifespan or health-span by more closely mimicking the complexity of micronutrients in fruits and vegetables, which appear to extend health-span and longevity. To test this hypothesis we treated long-lived, male, F1 mice with published and commercial combinations of dietary supplements and natural product extracts, and determined their effects on lifespan and health-span. Nutraceutical, vitamin or mineral combinations reported to extend the lifespan or health-span of healthy or enfeebled rodents were tested, as were combinations of botanicals and nutraceuticals implicated in enhanced longevity by a longitudinal study of human aging. A cross-section of commercial nutraceutical combinations sold as potential health enhancers also were tested, including Bone Restore®, Juvenon®, Life Extension Mix®, Ortho Core®, Ortho Mind®, Super K w k2®, and Ultra K2®. A more complex mixture of vitamins, minerals, botanical extracts and other nutraceuticals was compounded and tested. No significant increase in murine lifespan was found for any supplement mixture. Our diverse supplement mixture significantly decreased lifespan. Thus, our results do not support the hypothesis that simple or complex combinations of nutraceuticals, including antioxidants, are effective in delaying the onset or progress of the major causes of death in mice. The results are consistent with epidemiological studies suggesting that dietary supplements are not beneficial and even may be harmful for otherwise healthy individuals.
Keywords: Lifespan, Therapeutics, Mouse, Phytonutrients, Natural products, Nutraceuticals, Combinations
Introduction
The identification of required nutrients, vitamins and trace minerals led to a significant improvement in human health and longevity (McCormick 2010). We now know that consumption of diets rich in fruits and vegetables dose-responsively extends human survival while reducing mortality (Bellavia et al. 2013). These observations may have contributed to the widespread belief that the consumption of large amounts of isolated micronutrients and macronutrients derived from fruits and vegetables will enhance human health-span and longevity. This belief was given a sense of legitimacy in the 1970s, when Nobel laureate Linus Pauling promoted high-dose orthomolecular vitamin therapy for diseases as diverse as cancer and schizophrenia (Cameron and Pauling 1974; Pauling et al. 1974). Today, more than half of the adults in the USA consume some form of dietary supplement (McCormick 2010; McCormick 2012). Consumption of such supplements, sometimes in large amounts, is often perceived as being without risk.
Meta-analysis of randomized controlled human trials, and studies performed with rodents generally do not support the idea that the consumption of dietary supplements can increase the lifespan of initially healthy individuals (e.g., Macpherson et al. 2013; Spindler 2012; Spindler and Mote 2007; Spindler et al. 2013b). Rather, some nutraceutical supplements appear to decrease the longevity of some individuals (e.g., Heinonen and Albanes 1994; Hemila and Kaprio 2011).
It might be argued that the supplements administered in the studies cited above were too limited in variety to produce the kinds of positive effects on longevity observed when their whole-food sources are consumed (e.g., Lemon et al. 2005). We designed the studies described here to test the hypothesis that complex mixtures of vitamin, mineral, phytochemical, and other nutraceuticals can increase the longevity of initially healthy mammals. To do this we fed complex mixtures of dietary supplements, cold packed into a chemically defined American Institute of Nutrition (AIN) diet, to long-lived, F1 hybrid mice. Food consumption and body weights were monitored throughout the study. The supplement combinations were chosen in part from those whose efficacy was supported by scientific publications as well as from those whose efficacy was advanced through advertising.
Materials and methods
Mouse lifespan and food consumption
The studies used male B6C3F1 mice (Harlan Breeders, Indianapolis, IN, USA) randomly assigned to 58 treatment groups and to a control group, at 12 months of age. Animal husbandry and experimental design were as described previously (Spindler et al. 2013b,c). Two hundred ninety-seven mice were shifted from ad libitum chow feeding (Diet #5001; Purina Mills, Richmond, IN, USA) to daily feeding with 13.3 kcal/day/mouse of control diet (AIN-93M, Diet No. F05312; Bio-Serv, Frenchtown, NJ, USA). Thirty-six mice were shifted to daily feeding with an identical quantity of control diet supplemented with the compounds indicated in Table 1. The 40 % CR group (36 mice), was shifted to 11 kcal/day/mouse of AIN-93M 20 % Restricted Diet for 2 weeks, and thereafter to 7.46 kcal/day of AIN-93M 40 % Restricted Diet (Diet No. F05314, Bio-Serv). The 20 % and 40 % calorically restricted (CR) diets were fortified so the mice received fewer calories in the form of carbohydrate than the other groups but approximately equal amounts of fat, protein, vitamins and minerals, exclusive of the supplements added to the diets. Carbohydrate restriction was utilized because good experimental design specifies that to the degree possible only one parameter should be varied at a time to simplify the interpretation of the results. All mice were fed daily. Food consumption and mouse health were monitored at the time of feeding, and any uneaten food was noted. The drugs were mixed with powdered diet and cold-pressed into one gram pellets by Bio-Serv. The food was stored moisture free at 4°C until used. The mice drank acidified (pH 4.0) tap water ad libitum. Acidification greatly reduces Pseudomonas colonization of water bottles, sippers, and the nasopharynx and intestines of mice (National Institutes of Health 1994; National Research Council 1991). The mice were weighed bimonthly. The mice were maintained in shoebox cages with 0.22 micron covers, under barrier conditions, four per cage, on a 12-h light/dark cycle at 22 °C and 56 % average humidity. Bedding was radiation sterilized. The health of the mice was examined twice daily by laboratory staff, and weekly by a veterinarian. Dead mice were stored at −20 °C until necropsy. This study was approved by the Institutional Animal Care and Use Committee at the University of California, Riverside. Kaplan–Meier survival curves were compared using the Gehan–Breslow–Wilcoxon and the Mantel–Cox statistical tests implemented in GraphPad Prism 5.01. The tests were not adjusted for multiple testing.
Table 1.
Descriptions and dosages of the supplements
| Treatment | Compound/kg diet |
|---|---|
| Beaver Dam longitudinal study of aging (Knudtson et al. 2007) (Each supplement adjusted with cross-species scaling factors for mouse administration according to the manufactures recommended human dosage except Lecithin which was reduced by half because the mice under-consumed the diet at the full dose.) |
Lecithin (Solaray), 1.75 gm Ginkgo biloba (LEF), 189 mg Glucosamine HCl (Jarrow), 1.17 g glucosamine/kg diet Garlic (Pure Gar; LEF), 2.1 g |
| Bone Restore® plus K2 (584 mg/kg diet) (Recommended human dosage 5.0 g capsule material/day) |
Bone Restore (LEF), 584 mg Ultra K2® (VRP), 350 mg Super K w k2® (LEF), 315 mg |
| LGcombo (60.83 g total supplement material/kg diet) |
Aspirin (Sigma), 192 mg Blueberry Extract with Pomegranate (LEF), 817 mg Bone Restore (LEF), 350 mg Cinnulin PF (PE), 595 mg Super Ubiquinol Coq10 (LEF), 1.17 mg Creatine Micronized Caps (LEF), 1.66 g Curcumin 95 (Jarrow), 1.66 g DHEA (LEF), 248 mg Ginkgo biloba (LEF), 189 mg Glutathione Liposomal Liquid (EN), 48.2 μl GSH/ml water in mouse water bottles Green Tea Extract (Now), 1.14 g Hawthorn Extract (Flower & Leaf) (PE), 607 mg Neptune Krill Oil-NKO (Jarrow), 1.17 g (1.17 g of soybean oil was removed from the diet)] l-Carnitine caps (LEF), 1.30 g Lecithin (Solaray), 3.50 g Life Extension Mix (LEF), 0.89 g Melatonin (SN), 340 mg Milk Thistle (Solaray), 1.36 g Mineral Formula for Men (LEF), 105 mg Mitochondrial Energy Optimizerl (LEF), 2.1 g MSM (also known as methy-lsulfonylmethane and dimethyl sulfone) (LEF), 3.5 g Nanogreens10 (BPS), 14 g Nicotinic acid (Sigma), 1.17 g Opti-DHA (Douglas), 1.17 g Optimized Carnitine Caps (LEF), 1.96 g Ortho Corep (AOR), 5.76 g Ortho Mind 1.0 (AOR), 1.75 g Pomegranate extract (LEF), 911 mg Quercetina 1000 (Jarrow), 876 mg Resveratrol (Longevinex), 940 mg SAMe (CN), 619 mg Sesamin (Scivation), 2.15 g Super Digestive Enzyme Caps (LEF), 3.85 g Super K w k2 (LEF), 315 mg Super Zeanxanthin with Lutein (LEF), 315 mg TMG (also known as Trimethylglycine, glycine betaine) (LEF), 1.75 g Ultra K2 (VRP) (Menatetrenone), 350 mg |
| Juvenon® (Juvenon Inc.) (Ames 2004) (3.74 g of capsule material/kg diet) (Recommended human dosage 3.2 g capsule material/day) |
α-Lipoic acid, 400 mg Acetyl-l-carnitine, 1.00 g Biotin, 200 μg |
| LRcombo diet supplement (Lemon et al. 2005) (27.8 g total/kg diet) (This concentration produces the same dose per mouse per day as in the original publication.) |
Vitamin B1 (JV), 174 mg Vitamin B3 (JV), 174 mg Vitamin B6 (JV), 174 mg Vitamin B12 (JV), 17.4 mg Vitamin C (JV), 871 mg Vitamin D (JV), 605 IU Vitamin E (JV), 349 IU Acetyl-l-carnitine (Jarrow), 3.49 g α-Lipoic acid (NF), 174 mg Acetylsalicylic acid (Sigma), 605 mg β-Carotene (Jarrow) Bioflavinoids (SN), 1.045 g Chromium picolinate (SN) Cod liver oil (JV), 1,220 IU (an equivalent amount of soybean oil was removed from the diet) CoEnzyme Q10 (LEF), 107 mg DHEA (LEF), 40.4 mg Flax seed oil (LEF), 5.23 g (an equivalent amount of soybean oil was removed from the diet) Folic acid (JV), 2.42 mg Garlic (JV), 5.23 mg Ginger (LEF), 1.74 g Gingko biloba (LEF), 348 mg Ginseng (SN) Green tea extracts (NOW), 1.74 g l-Glutathione (Cell Life), 87.1 mg Magnesium (JV), 174 mg Melatonin (SN), 2.42 mg N-Acetyl cysteine (Jarrow), 1.74 g Potassium (JV), 87 mg Rutin (LEF), 174 mg Selenium (LEF), 261 μg Zinc (chelated) (JV), 33.9 mg |
| Life Extension Mix® (LEF) (12.5 g capsule material/kg diet) (Recommended human dosage 10.7 g capsule material/day) |
Vitamin A, 467 IU Vitamin C, 187 mg Cholecalciferol, 75 IU; Vitamin E (as d-α-tocopheryl succinate), 37.4 IU Thiamine (vitamin B1) (as thiamine HCl), 11.7 mg Riboflavin (vitamin B2), 237 μg Niacin (vitamin B3) (as 53 % niacinamide, 38 % niacin, 9 % niacinamide ascorbate), 17.8 mg Vitamin B6 (as pyridoxine HCI and pyridoxal 5′ phosphate coenzyme), 9.4 mg Folic acid, 75 μg Vitamin B12 (as 42 % cyanocobalamin, 42 % hydroxylcobalamin, 16 % ion exchange resin), 56 μg Biotin, 280 μg Pantothenic acid (as d-calcium pantothenate with pantethine), 56 mg Calcium (as calcium carbonate, calcium ascorbate, d-calcium pantothenate, Calcium d-Glucarate), 20.4 mg Iodine (as potassium iodide), 7.0 μg Magnesium (as magnesium oxide, citrate, glycinate, taurinate, arginate, ascorbate), 37.4 mg Zinc [as methionate (OptiZinc®3), zinc succinate], 33 mg Selenium (as 50 % se-methylselenocysteine, 25 % l-selenomethionine (yeast free) (SelenoPure®4), and 25 % sodium selenate), 18.7 μg Copper (as copper bisglycinate chelate), 93 μg Manganese (as manganese gluconate), 93 μg Chromium (as Chromium 454™5 bio-organic yeast extract matrix), 47 μg Molybdenum (as sodium molybdate), 11.7 μg Potassium (as potassium chloride), 3.5 mg N-Acetyl- l-cysteine (NAC), 56.1 mg Taurine, 200 mg; Inositol, 23.4 mg Phosphatidylcholine (from soy), 14 mg Choline (as choline bitartrate), 11.2 mg Boron (as boron citrate/aspartate/glycinate complex), 280 μg Ascorbyl palmitate (fat soluble vitamin C), 23.4 mg para-Aminobenzoic acid (PABA), 18.7 mg Trimethylglycine (TMG; as betaine anhydrous) (from sugar beets), 9.4 mg α-Carotene 9.4 IU Citrus bioflavonoid complex [50 % total bioflavonoids; Typical profile: (to equal 50 % total bioflavonoids) Flavanone (Hesperidin) 35 %, Flavonones (Naringin, Naringenin 7-B-Rutinoside and others) 14 %, Flavonols, Flavones and related phenolic compounds 1 %], 18.7 mg Broccoli sprout concentrate (a proprietary blend of broccoli sprout concentrates and Calcium d-Glucarate providing sulforaphane, glucosinolates, D-3 T, and PEITC), 49 mg Calcium d-Glucarate, 18.7 mg Decaffeinated Green tea (Camellia sinensis) extract (leaf) [std. to 98 % polyphenols and 45 % Epigallocatechin gallate], 30.4 mg Acerola juice powder extract 1:4 (Malpighia punicifolia fruit), 28.0 mg Ginger root extract (Zingiber officinale root) [standardized for 5 % gingerols], 18.7 mg HiActives 100 % fruit/berry complex (a proprietary blend of concentrated blackberry, blueberry, cranberry, elderberry, persimmon, plum, and cherry powders), 18.7 mg VitaBlue®6 Wild Blueberry [(Vaccinium angustifolium) 130:1 extract (fruit) standardized to 14 % Total Phenolics, 4.9 % Total Anthocyanins, 660 ppm Pterostilbene], 14 mg CocoaGold™ Cocoa bean extract (Theobroma cacao L.) [std. to 45 % polyphenols], 6.3 mg Milk thistle extract (Silybum marianus) (seeds) [standardized for 85 % silymarin (85 mg)], 9.4 mg Pomegranate (Punica granatum) extract (fruit) [standardized to 30 % Punicalagins], 7.9 mg Bilberry extract (Vaccinium myrtillus) (berry) [standardized for 25 % anthocyanidins], 2.8 mg Leucoselect®7 grapeseed extract (Vitis vinifera seeds) (std. for 95 % proanthocyanidins), 2.34 mg BioVin®8 grape extract (Vitis vinifera, whole grapes) [std. for minimum 95 % proanthocyanidins, minimum 75 % total polyphenols as gallic acid monohydrate, minimum 200 ppm trans-resveratrol], 2.34 mg Bromelain (from pineapple) (2,400 gelatin digestive units per gram), 1.4 mg Lutein (purified concentrate from marigold flowers) (Tagetes erecta), 1.4 mg Olive juice extract (fresh fruit) (std. to 50 % polyphenols, 6 % hydroxytyrosol), 1.17 mg Sesame (Sesamum indicum) lignan extract, 930 μg Luteolin [from perilla leaf extract (Perilla frutescens)], 748 μg Lycopene (from natural tomato extract) (Lyc-O-Mato®9), 280 μg |
| Ortho Core® (AOR) (5.76 g capsule material/kg diet) (Recommended human dosage = 4.94 g capsule material/day) |
Pomegranate extract (40 % ellagic acid), 121.5 mg, Chlorophyllin complex, 182 mg trans-Resveratrol, 2.2 mg Sulforaphane, 8.6 mg Vitamin A Complex, Retinol (palmitate), 182 μg (608 IU) Natural-Source Mixed Carotenoids [α-carotene 1.94 mg (1618 IU), β-carotene, 7.3 mg (121379 IU), cryptoxanthin, 365 μg (303 IU); lutein, 8.14 mg; lycopene, 12 mg; astaxanthin, 2.4 mg; Zeaxanthin, 382 μg] Vitamin B Complex [B1 [(thiamine), 10.9 mg; B2 (riboflavin), 3.0 mg; B3 (niacin as 175 mg inositol hexanicotinate), 140 mg; B5 (d-Ca Pantothenate), 121 mg; B6 (Pyridoxal-5′-phosphate), 121 mg; B12 (Methylcobalamin), 786 μg] Folic acid, 972 μg Biotin, 365 μg Choline, 122 mg Inositol (from inositol, inositol hexanicotinate), 122 mg Vitamin C Complex: vitamin C (magnesium ascorbate), 146 mg Mixed Citrus Bioflavonoids, 122 mg Quercetin,a 79 mg Vitamin D3 (cholecalciferol), 30 μg (1215 IU) Vitamin E Complex (including α-tocopherol, β-tocopherol, γ-tocopherol, δ-tocopherol; Tocotrienols, including: α-tocotrienol, β-tocotrienol, γ-tocotrienol, δ-tocotrienol), 122 mg Vitamin K2 (as menatetrenone), 146 μg Boron citrate, 850 μg Calcium (Citrate, malate, carbonate, glucarate), 365 mg Chromium Picolinate, 122 μg Copper Citrate, 1.8 mg Potassium Iodide, 182 μg Magnesium (citrate, aspartate, oxide, ascorbate; Chlorophyllin), 255 mg Potassium chloride, 61 mg Manganese glycinate, 2.8 mg Sodium molybdate, 55 μg Se-Methylselenocysteine, 243 μg Sodium metasilicate, 61 mg Strontium citrate, 1.8 mg Vanadium picolinate, 22 μg Zinc citrate, 14 mg R(+)-Lipoic acid, 182 mg Ubidecarenone, 37 mg Green tea extract (45 % EGCG; 1 % caffeine), 607 mg N-Acetylcysteine, 243 mg |
| Ortho Mind® (AOR) (5.25 g capsule material/kg diet) (Recommended human dosage = 4.5 g capsule material/day) |
R(+)-lipoic acid, 100 mg Huperzine-A (from 20 mg Huperzia serrata 0.5 %), 100 μg Vinpocetine, 15 mg Bacopa monniera extract (50 % baccosides A and B), 300 mg Ginkgo biloba extract (24 % ginkgoflavone glycosides, 6 % terpene lactones), 100 mg Cytidine diphosphate choline, 500 mg l-Pyroglutamic acid, 1,500 mg d-calcium pantothenate, 500 mg |
BPS BioPharma Scientific, CN Cognitive Nutrition, EN Essential Nutraceuticals, JV Jamieson Vitamins, LEF Life Extension Foundation, NF Natural Factors, PE Pure Encapsulations, SN Source Naturals, VRP Vitamin Research Products
aQuercetin was dissolved in the soybean oil component of the AIN-93M diet
Results
Combinations tested
The combinations and supplement groups used for these studies are described in Table 1. The composition of the commercial products which are not defined in this table is summarized in Table 5. The combinations include the nutraceutical, vitamin and mineral combination reported by Lemon and colleagues to extend the lifespan of enfeebled growth hormone overexpressing mice (Lemon et al. 2005). We refer to the diet containing this combination as the LRcombo diet. As nearly as possible we utilized the same suppliers and products used by these authors. Swisse Vitamins and Promatrix were not available in the USA when we performed the study. We substituted the highest quality nutraceuticals available. We also tested the combination of "nonvitamin, nonmineral" botanicals and nutraceuticals implicated in human longevity by the longitudinal study of participants from Beaver Dam, Wisconsin (Knudtson et al. 2007). The diet containing this combination is here referred to as the Beaver Dam diet. We tested the combination of α-lipoic acid, acetyl-l-carnitine and biotin reported to optimize metabolism; delay mitochondrial decay; and decrease DNA damage, cancer, and other degenerative diseases of aging in rats (Ames 2004; Ames 2010). This combination is sold under the trade name Juvenon, and we here refer to the diet containing this supplement as the Juvenon diet. The effects on lifespan of diets supplemented with other tradename nutraceutical combinations also were tested. These were Bone Restore®, Ultra K2®, and Super K w k2®; Life Extension Mix®, Ortho Core®; and Ortho Mind®. Many of these combinations are consumed by lifespan extensionists and health enthusiasts, alone and as a part of more complex combinations, sometimes in high dosages. For these reasons, we compounded a more complex mixture of commercial botanical extracts, vitamins and nutraceuticals, which we termed LGcombo (Table 1). This mixture was rich in substances touted as antioxidants and anti-inflammatories in scientific and popular publications (Table 1 and Table 5; see Discussion). The supplement mixture was administered at a high dosage by comparison to the other preparations to ensure that it was consumed at orthomolecular (also called megavitamin) levels.
Table 5.
Composition of commercial supplements not described in Table 1 which are components of the diets listed in Table 1
| Product | Contents per gram product |
|---|---|
| Super Digestive Enzyme Caps (LEF) | Pancreatin 8× [equal to 2,910 mg pancreatin USP (amylase 40,000 USP units/g, protease 40,000 USP units/g, lipase 7200 USP units/g), 364 mg Protease II (from papain; 43,333 USP/mg or 7,800 PU), 16 mg Protease III (60,000 FCC/gm or 1,300 HUT), 20 mg Amylase (125,000 FCC/gm or 1,300 DU), 51 mg Lactase (32,500 FCC/gm or 2,000 ALU), 58 mg Cellulase (20,000 FCC/gm or 1,600 CU), 73 mg Lipase (20,000 FCC/gm or 1,000 FIP), 46 mg Whole fruit papaya powder, 182 mg |
| Mineral Formula for Men (LEF) | Calcium (as calcium citrate malate, amino acid chelate), 295 mg Magnesium (as magnesium oxide, amino acid chelate, succinate, aspartate), 2.7 g Manganese (as manganese gluconate), 4.8 mg Potassium (as potassium aspartate), 77.6 mg |
| Mitochondrial Energy Optimizer (LEF) | Thiamine (vitamin B1) (as thiamine HCI), 56 mg Acetyl-l-carnitine hydrochloride, 843 mg Acetyl-l-carnitine arginate dihydrochloride, 843 mg Carnosine, 1.12 g Benfotiamine, 169 mg Luteolin [from Perilla leaf extract (Perilla frutescens)], 9 mg R-lipoic acid (as Bio-Enhanced™ R-lipoic acid sodium salt), 169 mg Rhodiola rosea root extract [standardized for 3 % Rosavins (5.1 mg) and 1 % Salidrosides (1.7 mg)], 169 mg |
| Nanogreens10 (BPS) | Phyto-Nutrient Blend (Proprietary) (blueberry, green tea extract, grape seed extract, cranberry, raspberry, tart cherry, pine bark extract, broccoli, tomato, carrot, spinach, kale, Brussels sprout, bilberry, elderberry, pomegranate, blackberry), 138 mg Isoquercitin/rutin 50/50, 68 mg Raspberry extract (20 % Ellagic Acid), 21 mg Fruit & Vegetable Blend (Proprietary; freeze-dried, low temperature dried) [apple, carrot, mango, sweet potato, lemon, parsley, peach, kale, broccoli, spinach, leek, beet, cranberry (quinic acid 6 %)], 383 mg Acerola cherry powder (17.5 % ascorbic acid), 75 mg Soluble rice bran, 1,064 mg Aloe vera powder extract (100:1 freeze dried), 13 mg Green tea, white tea (decaffeinated, 50 % polyphenol), 43 mg Polygonum cuspidatum (15 % resveratrol), 21 mg Oat β-glucan, 936 mg Cinnamon Blend (proprietary), 21 mg Milk thistle (20 % silymarin), 21 mg Marigold extract (5 % lutein with zeaxanthin), 21 mg Dunaliella salina, 42 mg Enzymes (plant-based) (α-amylase, bromelain, cellulase, galactosidase, glucoamylase, hemicellulase, lipase, papain, protease), 17 mg Lecithin (from soy), 819 mg Cabbage (Japanese, fermented), 13 mg Lycopene Extract-10 % (from tomato), 10.6 mg Lemon Peel Powder, 10.6 mg Quinoa Sprout, 38 mg Artichoke Extract (5 % cynarin), 8.5 mg Atlantic Kelp Powder (Laminara digitata), 8.5 mg Stevialite™ (Stevia rebaudiana), 85 mg |
| Opti-DHA (Douglas) | Docosahexaenoic acid (DHA), 450 mg Eicosapentaenoic acid (EPA), 150 mg |
| Optimized Carnitine Caps (LEF) | Acetyl-l-carnitine HCl, 476 mg ArginoCarn®, acetyl l-carnitine arginate Di-HCl, 179 mg GlycoCarn®, glycine propionyl l-carnitine HCl, 179 mg |
| Super K w k2 (LEF) | Vitamin K1, 33.3 mg Vitamin K2 (menatetrenone), 3.7 mg |
| Super Ubiquinol CoQ10 (LEF) | Ubiquinol, 100 mg |
| Ultra K2 (VRP) | Vitamin K2 (menatetrenone), 150 mg |
Effects on lifespan
The combinations were cold packed in the chemically defined AIN-93M diet, and fed to male mice beginning at 12 months of age (Reeves 1997; Reeves et al. 1993). There were three reasons for beginning the treatments at this age. First, human treatment with longevity enhancing therapeutics is most appropriately confined to the period of life after growth, development and reproduction have ceased (Spindler 2010). It is difficult to envision FDA approval of a longevity therapeutic for younger individuals. Second, therapeutics may have both negative and positive effects on lifespan and health-span. Beginning treatment at a later age may reduce the accumulated toxic effects of a potential therapeutic (Spindler et al. 2013c). Third, rapamycin, the most efficacious model therapeutic yet found in mice, is approximately equally effective whether administration is begun at 9 or 20 months of age (Miller et al. 2011).
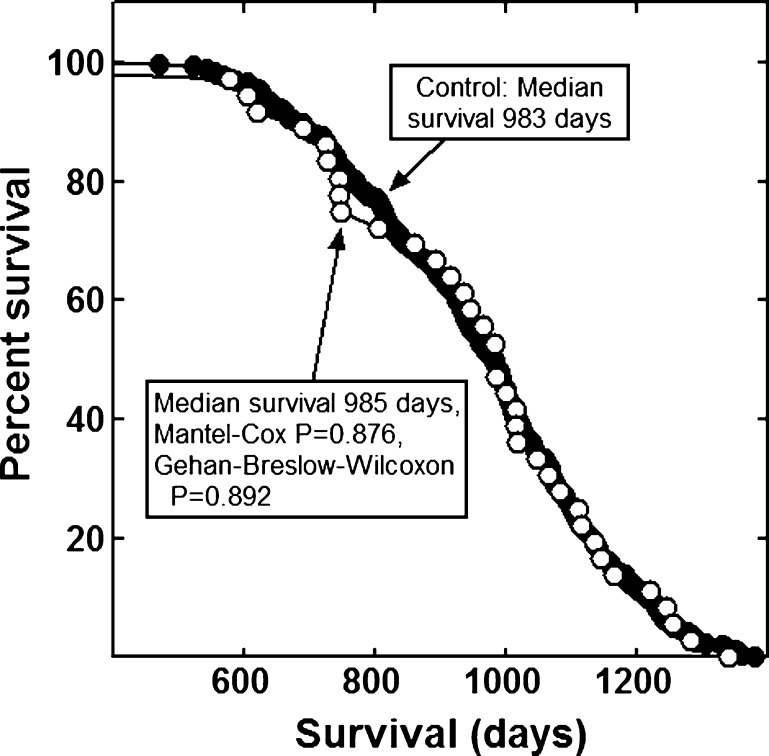
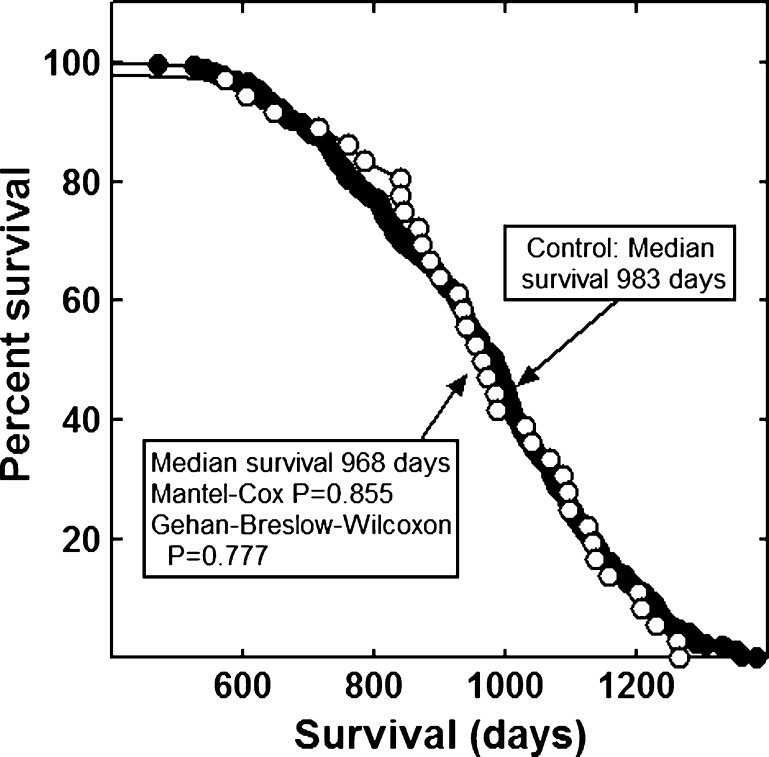
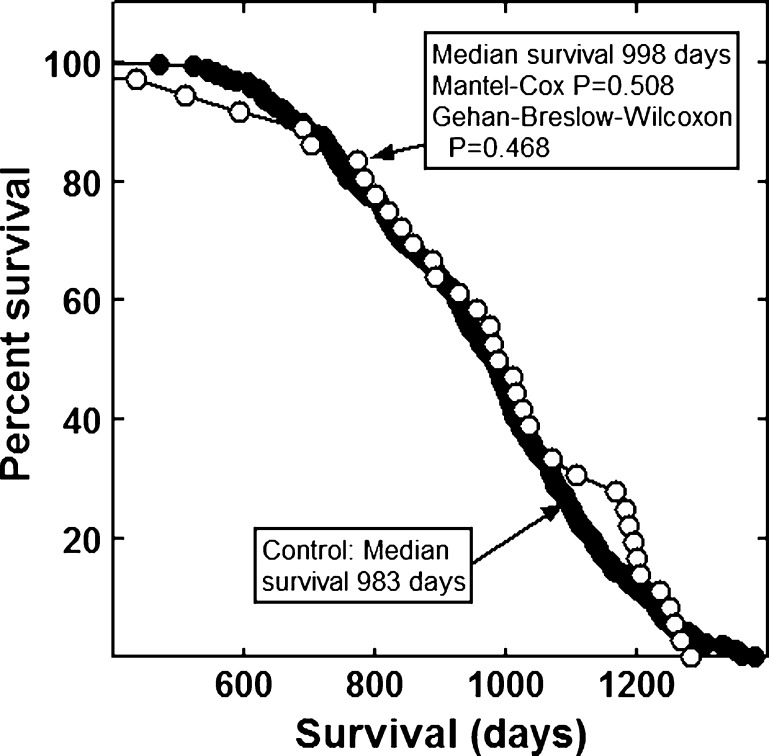
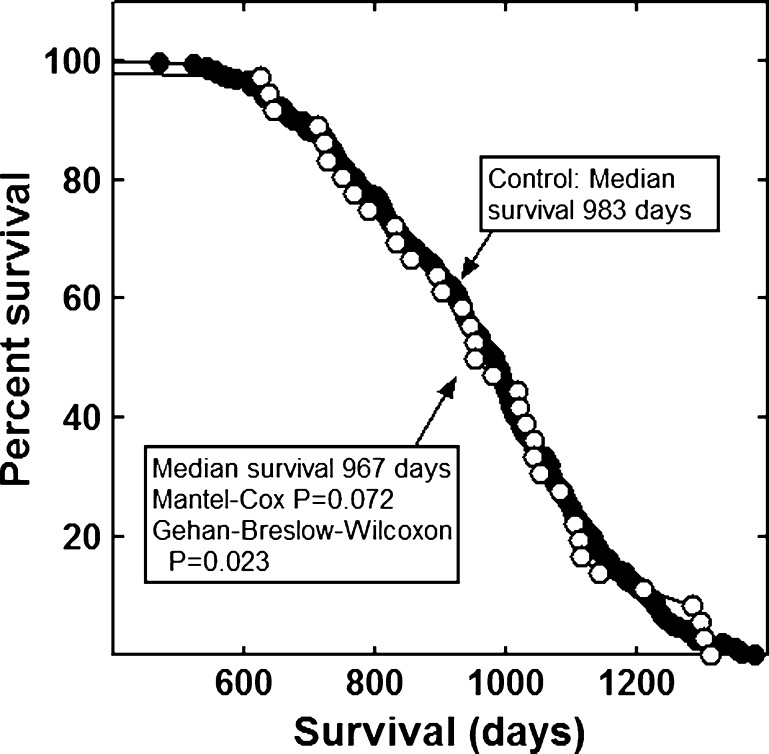
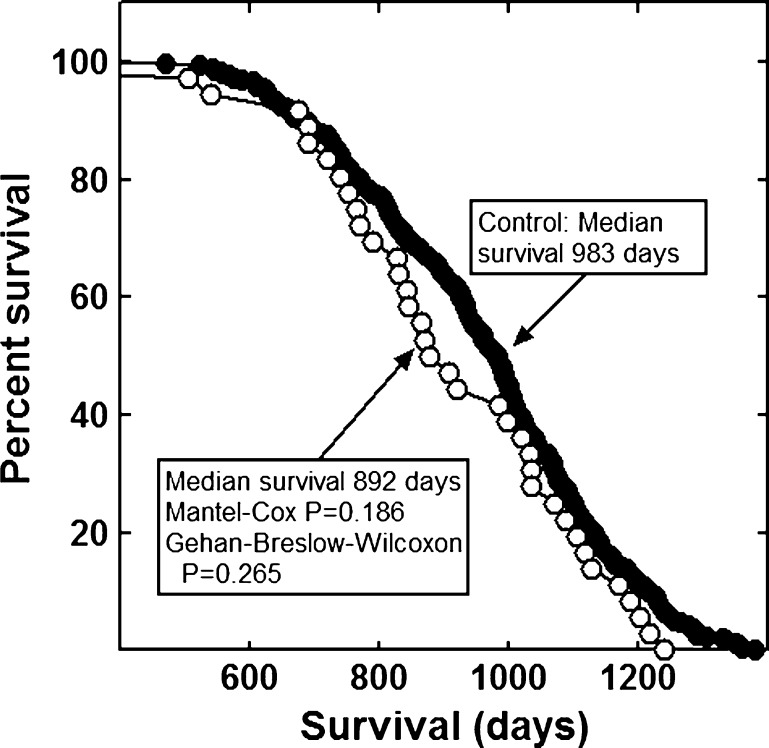
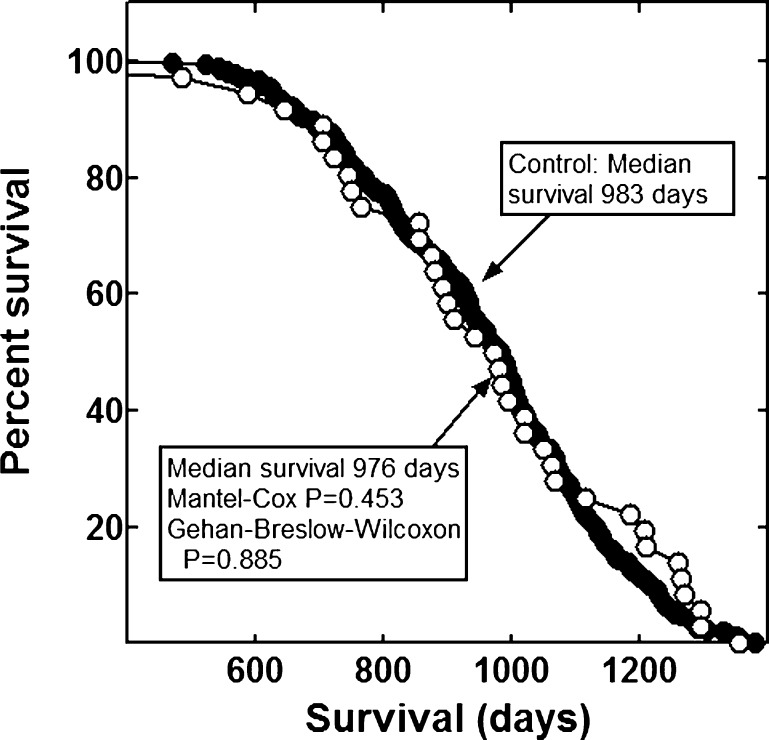
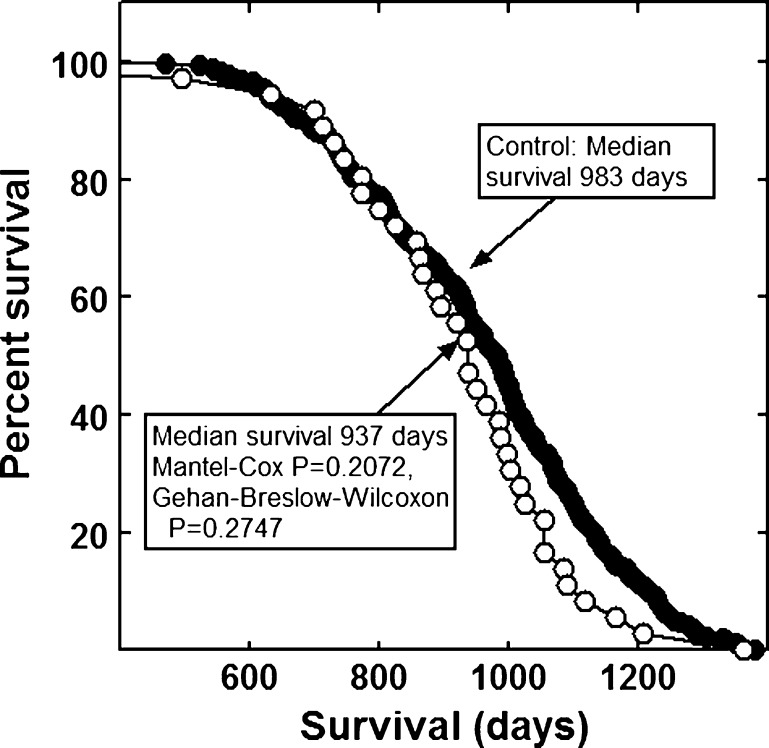
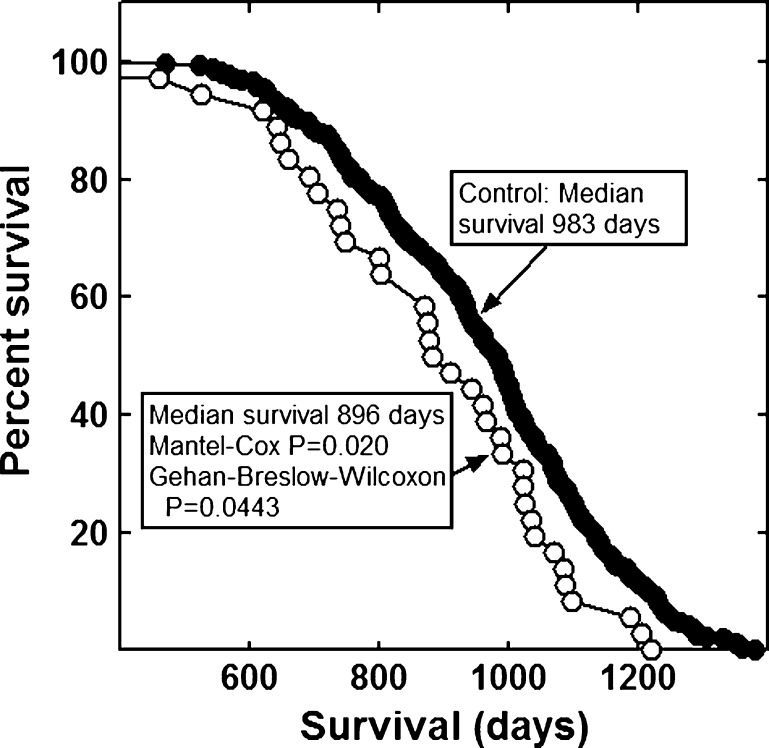
None of the combinations significantly increased the lifespan of the mice (Figs. 1, 2, 3, 4, 5, 6 and 7). The highly diverse LGcombo diet actually shortened lifespan significantly, according to both of the statistical tests (Fig. 8). This decrease may have been due in part to the marine oil present in the diet.
Fig. 1.
Lifespan of mice fed the LRcombo or a control diet
Fig. 2.
Lifespan of mice fed Beaver Dam or control diet
Fig. 3.
Lifespan of mice fed a diet containing Juvenon or a control diet
Fig. 4.
Lifespan of mice fed a diet containing Bone Restore or a control diet
Fig. 5.
Lifespan of mice fed a diet containing Life Extension Mix or a control diet
Fig. 6.
Lifespan of mice fed a diet containing Ortho Core or a control diet
Fig. 7.
Lifespan of mice fed a diet containing Ortho Mind or a control diet
Fig. 8.
Lifespan of mice fed a diet containing LGcombo or a control diet
We chose to analyze only male mice in this study to maximize the throughput of the assay. Inclusion of females, which have physiological complexities related to estrus cycling, would have reduced the number of tested compounds and combination by half. These studies were part of a larger umbrella study of one large control group and 58 smaller treatment groups (e.g., Spindler 2012). This statistical design was utilized to maximize the number of treatment groups (Jeske et al. 2013). The sample sizes in this study are similar to those required for a Weibull survival analyses designed to have a better than 75 % probability of detecting an 10 % increase in mean lifespan with a 1 % (α ≤ 0.01) probability of a false positive across 58 test groups (Jeske et al. 2013). The Weibull survival analysis is more stringent than those used here.
In the other groups, lifespan was significantly extended by treatments. For example, a 40 % CR group and two groups treated with β-adrenergic receptor blockers achieved 23 % and 9 % lifespan extension, respectively (Spindler et al. 2013b,c). These results demonstrate that lifespan can be extended with these mice under the husbandry conditions used.
Rationale for the dosages
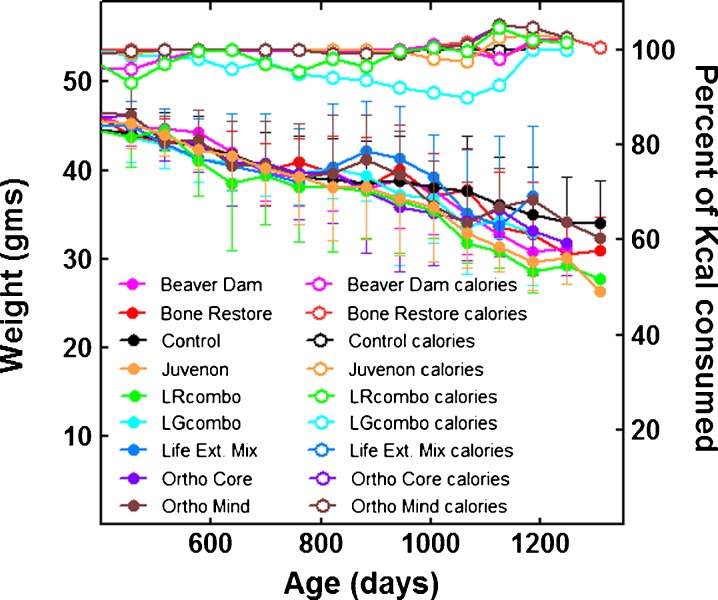
The components of the LRcombo diet were administered at the dosages used in the published study (Lemon et al. 2005). The concentration of each supplement used in the Beaver Dam diet was calculated from the human dose recommended by each supplier, scaled up according to accepted cross-species scaling factors (reviewed by Spindler 2012). These scaling factors are designed to adjust dosages between animals and humans to account for species-specific pharmacodynamic and pharmacokinetic differences. Assuming an 80-kg adult and a 39-g mouse, they suggest that mice should receive between 8- and 12-times (in mg/kg body weight) the recommended human dosage of a drug. Thirty-nine grams is approximately the median weight of the mice in this study during the treatment period (Fig. 9). The recommended human dosage of the Juvenon used was two caplets per day per adult, which totaled to 3.2 g of the capsule material/d. This contained 1,000 mg of acetyl-l-carnitine, 400 mg of α-lipoic acid, and 300 μg of biotin. The concentration of Juvenon caplet material in the mouse diet was 3.74 g/kg diet. This supplied 106 mg of acetyl-l-carnitine, 43 mg of α-lipoic acid, and 32 μg of biotin per kg bw/d to the mice. The concentrations of Bone Restore plus K2, Life Extension Mix, Ortho Core, and Ortho Mind in the mouse diets were scaled up in the same way, based on the manufacturer's recommended human daily dosages. For the LGcombo diet, the dosage per kilogram body weight was calculated as described above for each component in the diet except Bone Restore and Mineral Formula for Men, which were not increased in mg/kg bw to avoid the potential for toxicity of the minerals present in these supplements. The aspirin concentration in the LGcombo was calculated according to a cross-species scaling factor of 10, based on a human dosage for the prevention of myocardial events of 163 mg/day, assuming an 80 kg adult. This amount is at the upper range of the dosages currently recommended by the American Diabetes Association and the American Heart Association of 75–163 mg daily for primary prevention of cardiovascular disease in men aged 45–79 years (Maciosek et al. 2006). It appears unlikely that higher dosages of these supplement combinations would have a positive effect on lifespan. The higher dose LGcombo had a negative effect.
Fig. 9.
Weights (filled symbols) and food consumption (open symbols) of the mice consuming the Beaver Dam (fuchsia), Bone Restore (red); Control (black), Juvenon (gold), LRcombo (green), LGcombo (turquoise), Life Extension Mix (blue), Ortho Core (purple), and Ortho Mind (brown) diets
Food consumption and body weight
To determine the possible effects of the compounds on food intake and body weight, the mice in each group were fed the same number of calories each day, and both parameters were quantified throughout the study (Fig. 9). None of the treatments affected food consumption or body weight (Fig. 9). As observed previously, mean body weight estimates became increasingly unstable as days on diet increased, because the number of mice diminished with time (Spindler et al. 2013b; Spindler et al. 2013c). Because the ratio of food consumption to body weight was not consistently different between groups, the supplements do not appear to change energy adsorption or utilization. Also, as observed previously with these mice, both the control and treatment groups gradually lost weight after the shift to meal feeding, even though their weights approximated those of ad libitum fed mice (Spindler et al. 2013b).
Effects of LGcombo on serum chemistries
To investigate the reasons for the shortening of lifespan by LGcombo, mice of the same sex and strain used in the lifespan study were fed the LGcombo diet for 9 weeks, and their serum analyzed for markers of health status (Table 2). Most of the parameters measured were not changed by the diets. However, total serum protein and blood urea nitrogen (BUN) significantly decreased, while total bilirubin significantly increased. These results are difficult to interpret. Decreased serum protein and BUN would most commonly be associated with a low-protein diet, malnutrition or starvation, or impaired metabolic activity in the liver due to parenchymal liver damage, or with kidney disease (Waner and Nyska 1991). Because the mice did not change their food consumption or body weight, liver and/or kidney toxicity are the most likely explanations. The highly significant elevation of total bilirubin also is consistent with liver injury or hemolysis, which are both signs of toxicity. A numerical reduction in LDL was very near statistical significance (Table 2). This decrease may have been due to the marine oils present in the LGcombo diet. Together, these results suggest that the LGcombo diet produced liver and possibly kidney damage. Determining which component of LGcombo is responsible for reduced lifespan and the damage to the liver and kidney would be difficult because of the its complexity.
Table 2.
Serum tests for the LGcombo-treated mice
| Testa | Control | LGcombo | P valueb | Indication |
|---|---|---|---|---|
| Alanine aminotransferase, U/l | 40.3 ± 23.8 | 31.4 ± 7.5 | 0.292 | |
| Aspartate aminotransferase, U/l | 109.1 ± 57.9 | 90.8 ± 26.4 | 0.397 | |
| Alkaline phosphatase, U/l | 81.9 ± 33.4 | 83.2 ± 16.1 | 0.929 | |
| Blood urea nitrogen, mg/dl | 19.6 ± 1.1 | 16.5 ± 1.3 | 0.003 | Liver injury; reduced albumin secretion |
| Cholesterol, mg/dl | 161.1 ± 42.6 | 155.0 ± 24.2 | 0.739 | |
| Creatinine, mg/dl | 0.12 ± 0.03 | 0.14 ± 0.02 | 0.076 | |
| High density lipoprotein, mg/dl | 156.3 ± 33.6 | 150.6 ± 22.3 | 0.72 | |
| Low density lipoprotein, mg/dl | 16.7 ± 5.6 | 11.9 ± 3.3 | 0.054 | |
| Total bilirubin, mg/dl | 0.06 ± 0.02 | 0.12 ± 0.02 | 0.001 | Hemolysis; jaundice |
| Total protein, g/dl | 5.7 ± 0.4 | 5.3 ± 0.1 | 0.046 | Liver injury; reduced albumin secretion |
| Triglyceride, mg/dl | 77.8 ± 20.6 | 73.0 ± 38.3 | 0.765 | |
| Glucose, mg/dl (non-fasting) | 183.3 ± 37.1 | 142.1 ± 22.4 | 0.083 |
aBlood glucose levels were measured with the FreeStyle Lite Blood Glucose Monitoring System (Abbot Laboratories). The other blood tests were performed by the Comparative Pathology Laboratory, University of California, Davis
bCalculated using t-tests
Necropsy results
The necropsy results for the control and LGcombo mice are summarized in Tables 3 and 4. The LGcombo mice had few differences from the control mice in the pathologies detected. There may have been fewer hemangiomas in the LGcombo mice, while the number of enlarged seminal vesicles may have been higher (Table 3). However, these differences involved relatively few mice, and thus are of uncertain significance. There were no effects on liver tumor number or size (Table 4).
Table 3.
Necropsy results from the mouse longevity studies shown in Fig. 8
| Organ | Pathology | Control (n = 72) | LGcombo (n = 35) | ||
|---|---|---|---|---|---|
| Numbera | %b | Number | % | ||
| Spleen | Enlarged/tumorous | 43 | 59.7 % | 14 | 40.0 % |
| Liver | Tumor | 22 | 30.6 % | 10 | 28.6 % |
| Enlarged/fatty liver | 3 | 4.2 % | 2 | 5.7 % | |
| Hemangioma | 7 | 9.7 % | 0 | 0.0 % | |
| Intestinal | Tumor | 9 | 12.5 % | 6 | 17.1 % |
| Lung | Tumor | 11 | 15.3 % | 4 | 11.4 % |
| Penis | Necrosed/inflamed | 6 | 8.3 % | 3 | 8.6 % |
| Seminal vesicles | Enlarged | 3 | 4.2 % | 4 | 11.4 % |
| Bladder | Distended | 12 | 16.7 % | 3 | 8.6 % |
| Kidneys | Enlarged/tumorous | 3 | 4.2 % | 2 | 5.7 % |
| Thymus | Enlarged | 2 | 2.8 % | 2 | 5.7 % |
| Skin/abdominal cavity | Fibroma | 4 | 5.6 % | 2 | 5.7 % |
| Body cavity | Hemorrhage | 11 | 15.3 % | 7 | 20.0 % |
aNumber of mice in the treatment group showing the indicated pathologies
bPercent of the mice in the treatment group showing the indicated pathologies
Table 4.
Liver tumor mass of the mice shown in Fig. 8
| Liver tumors | Control (n = 72) | LGcombo (n = 35) |
|---|---|---|
| Mass (g)a | Mass (g) | |
| Median tumor mass | 0.84 | 0.57 (P = 0.3013)b |
| Tumor mass/number of mice with tumors | 1.2 | 1.4 |
acm3 = 1 g
b P value calculated using the Mann–Whitney test
Discussion
We tested the hypothesis that complex mixtures of dietary supplements are capable of extending the lifespan of initially healthy mammals. Simple and highly complex mixtures of vitamins, minerals, phytonutrients, and fruit, leaf, spice, and seed extracts were tested for their effects on the lifespan and mortality-related pathologies. F1 hybrid mice were used because they are a robust, defined and well-controlled experimental system. None of the combinations extended lifespan, and one very complex mixture of supplements decreased lifespan. These results are consistent with other rodent studies indicating that nutraceutical supplements have no effect on lifespan, or shorten it (Ristow and Schmeisser 2011; Selman et al. 2013; Spindler et al. 2013b). Our results also are consistent with studies of initially healthy humans indicating that the use of dietary supplements is associated with either no effect or a negative effect on survival (e.g., Bjelakovic et al. 2004; Chowdhury et al. 2012; Macpherson et al. 2013; Miller et al. 2005; Myung et al. 2013; Rizos et al. 2012). While some supplements may be effective in treating specific disease states, most data suggest that either simple or complex combinations of supplements are not effective in delaying the onset or progress of the major causes of death in mice or humans.
The toxicity of the LGcombo may be due in part to the Krill oil and opti-DHA present in the diet (Table 1). Opti-DHA is composed of marine lipids rich in docosahexaenoic acid (DHA; 450 mg/g) and eicosapentaenoic acid (EPA; 150 mg/g). Mice consuming AIN-93M diet supplemented with either krill oil or Lovaza, which are also DHA and EPA rich oils, had reduced lifespans relative to the unsupplemented control mice (Spindler et al. 2013a). The husbandry procedures were identical to those used for the LGcombo mice. Both the LGcombo and Lovaza diets produced elevated levels of BUN (Table 2; Spindler et al. 2013a). These data suggest that the ω-3 rich oils may have been at least partially responsible for the reduced lifespan of the LGcombo supplemented mice. Other components in the diet may also have produced adverse effects. The LGcombo mice had elevated bilirubin and total serum protein levels, which were not observed in the Lovaza diet fed mice (Table 2; Spindler et al. 2013a). The high concentrations of phenolic compounds in the LGcombo diet may have produced these changes. The LGcombo supplement was approximately 6 % of the diet by weight (Table 1), and Nanogreens10 were 23 % of the LGcombo supplement. Nanogreens10 contains extracts of many fruits, vegetables, grasses and barks rich in phenolics. High levels of these may have saturated the phase I/phase II enzyme systems, interfering with normal endobiotic metabolism, resulting in hepatic and systemic toxicity.
The mice were isocalorically fed to avoid the supplement-related food aversion that can reduce caloric consumption and induce CR-related lifespan extension in ad libitum fed mice (Spindler 2012). Our studies found that approximately half of the supplements administered to mice in their food reduce ad libitum food consumption, usually slightly, but sometimes substantially (Spindler 2012). For these reasons, the studies described here monitored food intake daily and measured body weight bimonthly.
We used F1 hybrid mice for these studies because they are more disease- and stress-resistant and have larger litters and longer lifespans than their inbred parental lines (Flurkey et al. 2009). Hybrid vigor of this type is thought to arise from the increase in heterozygosity at the loci for which their parents are heteroallelic. B6C3F1 mice have the advantages of being easily produced by a single cross. They are genetically defined and are the longest lived mouse strain of which we are aware (Spindler 2012). It seems likely that compounds which increase the lifespan of healthy, long-lived mice will be more likely to extend the lifespan of other healthy, long-lived mammals, such as humans.
Our results do not support the assumption made in some published studies that screening using enfeebled rodents will expedite the identification of longevity therapeutics (Spindler 2012; Spindler et al. 2013b). The LRcombo diet combination extended the lifespan of mice enfeebled by the overexpression of the growth hormone gene, which markedly shortens lifespan (Lemon et al. 2005; Steger et al. 1993). However, this supplement combination produced no effect on the lifespan of our healthy, F1 mice (Fig. 1). While many compounds have been shown to extend the lifespan of short-lived or enfeebled mice, to the best of our knowledge, metformin is the only compound which was first identified in this way which later was shown to extend the lifespan of more robust mouse strains (Anisimov et al. 2005a,b; Martin-Montalvo et al. 2013). While other examples may exist, enfeebled rodent models, at present, seem prone to false positives (Spindler 2012). Thus, screening for potential longevity therapeutics might be more productively performed using robust rodent strains.
The data found here are consistent with the growing body of evidence indicating that compounds thought to be biologically relevant antioxidants do not increase the lifespan of normal mammals (e.g., Salmon et al. 2010; Selman et al. 2013; Spindler et al. 2013b). Rather, many micronutrients chronically taken in excess can become toxic and even lethal (McCormick 2010). Antioxidant supplements, for example, appear to either have no effect on lifespan, or to increase morbidity and mortality in humans (McCormick 2010). In contrast to the results cited above, many antioxidants appear to extend the lifespan of worms or flies (e.g., Liao et al. 2011; Peng et al. 2012; Shen et al. 2013). These results suggest that screening drugs and supplements in lower eucaryotes may be confounded by high false discovery rates. However, our experience has been that many compounds which extend mouse lifespan also extend the lifespan of Drosophila (e.g., Spindler et al. 2013c).
Summary
The data presented here suggest that the consumption of complex mixtures of dietary supplements do not provide the same lifespan and health benefits as their whole food sources. Extracted or isolated botanical components or chemicals with antioxidant or anti-inflammatory properties did not increase the longevity of the mice in this study. The results are not likely related to the dosages used. We tested multiple commercial compilations at the mouse equivalent of the human dosages recommended, two published supplement combinations at the dosages reported to have longevity or cognitive benefits in rodents, and a highly complex, high dosage supplement combination. These combinations either had no effect or a negative effect on lifespan. Together our results are not consistent with the view that the consumption of complex mixtures of extracts and isolated components of whole foods is effective at extending lifespan. These results are instead consistent with a large body of epidemiological evidence indicating that the consumption of dietary supplements is associated either with no effect or an increase in morbidity and mortality.
Acknowledgements
The authors thank Ms. Carol Boyd for her help feeding and monitoring the mice. This work was funded by anonymous donors. The funders had no role in study design, data collection or analysis, decision to publish, or preparation of the manuscript.
Conflicts of interest
The authors have no conflict of interest to declare.
Appendix
References
- Ames BN (2004) Delaying the mitochondrial decay of aging. Ann.N.Y.Acad.Sci. 1019:406–11, 406–411 [DOI] [PubMed]
- Ames BN (2010) Prevention of mutation, cancer, and other age-associated diseases by optimizing micronutrient intake. J Nucleic Acids 2010:11 pp. doi:10.4061/2010/725071 [DOI] [PMC free article] [PubMed]
- Anisimov VN, Berstein LM, Egormin PA, Piskunova TS, Popovich IG, Zabezhinski MA, Kovalenko IG, Poroshina TE, Semenchenko AV, Provinciali M, Re F, Franceschi C. Effect of metformin on life span and on the development of spontaneous mammary tumors in HER-2/neu transgenic mice. Exp Gerontol. 2005;40:685–693. doi: 10.1016/j.exger.2005.07.007. [DOI] [PubMed] [Google Scholar]
- Anisimov VN, Egormin PA, Bershtein LM, Zabezhinskii MA, Piskunova TS, Popovich IG, Semenchenko AV. Metformin decelerates aging and development of mammary tumors in HER-2/neu transgenic mice. Bull Exp Biol Med. 2005;139:721–723. doi: 10.1007/s10517-005-0389-9. [DOI] [PubMed] [Google Scholar]
- Bellavia A, Larsson SC, Bottai M, Wolk A, Orsini N (2013) Fruit and vegetable consumption and all-cause mortality: a dose–response analysis. Am J Clin Nutr [DOI] [PubMed]
- Bjelakovic G, Nikolova D, Simonetti RG, Gluud C. Antioxidant supplements for prevention of gastrointestinal cancers: a systematic review and meta-analysis. Lancet. 2004;364:1219–1228. doi: 10.1016/S0140-6736(04)17138-9. [DOI] [PubMed] [Google Scholar]
- Cameron E, Pauling L. The orthomolecular treatment of cancer: I. The role of ascorbic acid in host resistance. Chem Biol Interact. 1974;9:273–283. doi: 10.1016/0009-2797(74)90018-0. [DOI] [PubMed] [Google Scholar]
- Chowdhury R, Stevens S, Gorman D, Pan A, Warnakula S, Chowdhury S, Ward H, Johnson L, Crowe F, Hu FB, Franco OH. Association between fish consumption, long chain omega 3 fatty acids, and risk of cerebrovascular disease: systematic review and meta-analysis. BMJ. 2012;345:e6698. doi: 10.1136/bmj.e6698. [DOI] [PMC free article] [PubMed] [Google Scholar]
- Flurkey K, Currer JM, Leiter EH, Witham B (eds) (2009) The Jackson Laboratory Handbook on Genetically Standardized Mice, 6th edn. The Jackson Laboratory, ME
- Heinonen OP, Albanes D. the Alpha-Tocopherol, Beta Carotene Cancer Prevention Study Group. The effect of vitamin E and beta carotene on the incidence of lung cancer and other cancers in male smokers. N Engl J Med. 1994;330:1029–1035. doi: 10.1056/NEJM199404143301501. [DOI] [PubMed] [Google Scholar]
- Hemila H, Kaprio J. Vitamin E may affect the life expectancy of men, depending on dietary vitamin C intake and smoking. Age Ageing. 2011;40:215–220. doi: 10.1093/ageing/afq178. [DOI] [PubMed] [Google Scholar]
- Jeske DR, Flegal J, Spindler SR (2013) Minimum size survival analysis sampling plans for comparing multiple treatment groups to a single control group. Communications in Statistics - Theory and Methods. In press
- Knudtson MD, Klein R, Lee KE, Reinke JO, Danforth LG, Wealti AM, Moore E, Klein BE. A longitudinal study of nonvitamin, nonmineral supplement use: prevalence, associations, and survival in an aging population. Ann Epidemiol. 2007;17:933–939. doi: 10.1016/j.annepidem.2007.07.098. [DOI] [PMC free article] [PubMed] [Google Scholar]
- Lemon JA, Boreham DR, Rollo CDA. Complex dietary supplement extends longevity of mice. J Gerontol A Biol Sci Med Sci. 2005;60:275–279. doi: 10.1093/gerona/60.3.275. [DOI] [PubMed] [Google Scholar]
- Liao VH, Yu CW, Chu YJ, Li WH, Hsieh YC, Wang TT. Curcumin-mediated lifespan extension in Caenorhabditis elegans. Mech Ageing Dev. 2011;132:480–487. doi: 10.1016/j.mad.2011.07.008. [DOI] [PubMed] [Google Scholar]
- Maciosek MV, Coffield AB, Edwards NM, Flottemesch TJ, Goodman MJ. and Solberg, L. I. Priorities among effective clinical preventive services: results of a systematic review and analysis. Am.J Prev Med. 2006;31:52–61. doi: 10.1016/j.amepre.2006.03.012. [DOI] [PubMed] [Google Scholar]
- Macpherson H, Pipingas A, Pase MP. Multivitamin–multimineral supplementation and mortality: a meta-analysis of randomized controlled trials. Am.J Clin. Nutr. 2013;97:437–444. doi: 10.3945/ajcn.112.049304. [DOI] [PubMed] [Google Scholar]
- Martin-Montalvo A, Mercken EM, Mitchell SJ, Palacios HH, Mote PL, Scheibye-Knudsen M, Gomes AP, Ward TM, Minor RK, Blouin MJ, Schwab M, Pollak M, Zhang Y, Yu Y, Becker KG, Bohr VA, Ingram DK, Sinclair DA, Wolf NS, Spindler SR, Bernier M, de Cabo R. Metformin improves healthspan and lifespan in mice. Nat Commun. 2013;4:2192. doi: 10.1038/ncomms3192. [DOI] [PMC free article] [PubMed] [Google Scholar]
- McCormick DB. Vitamin/mineral supplements: of questionable benefit for the general population. Nutr Rev. 2010;68:207–213. doi: 10.1111/j.1753-4887.2010.00279.x. [DOI] [PubMed] [Google Scholar]
- McCormick DB. Vitamin/trace mineral supplements for the elderly. Adv Nutr. 2012;3:822–824. doi: 10.3945/an.112.002956. [DOI] [PMC free article] [PubMed] [Google Scholar]
- Miller ER, III, Pastor-Barriuso R, Dalal D, Riemersma RA, Appel LJ, Guallar E. Meta-analysis: high-dosage vitamin E supplementation may increase all-cause mortality. Ann Intern Med. 2005;142:37–46. doi: 10.7326/0003-4819-142-1-200501040-00110. [DOI] [PubMed] [Google Scholar]
- Miller RA, Harrison DE, Astle CM, Baur JA, Boyd AR, de Cabo R, Fernandez E, Flurkey K, Javors MA, Nelson JF, Orihuela CJ, Pletcher S, Sharp ZD, Sinclair D, Starnes JW, Wilkinson JE, Nadon NL, Strong R. Rapamycin, but not resveratrol or simvastatin, extends life span of genetically heterogeneous mice. J Gerontol A Biol Sci Med Sci. 2011;66:191–201. doi: 10.1093/gerona/glq178. [DOI] [PMC free article] [PubMed] [Google Scholar]
- Myung SK, Ju W, Cho B, Oh SW, Park SM, Koo BK, Park BJ. Efficacy of vitamin and antioxidant supplements in prevention of cardiovascular disease: systematic review and meta-analysis of randomised controlled trials. BMJ. 2013;346:f10. doi: 10.1136/bmj.f10. [DOI] [PMC free article] [PubMed] [Google Scholar]
- National Institutes of Health (1994) Manual of microbiologic monitoring of laboratory animals, 151–154
- Committee on Infectious Diseases of Mice and Rats (1991) Infectious diseases of mice and rats. Institute for Laboratory Animal Research, Commission on Life Sciences, National Research Council. National Academies Press, Washington, DC 7:141–145
- Pauling L, Wyatt RJ, Klein DF. and Lipton, M. A. On the orthomolecular environment of the mind: orthomolecular theory. Am.J Psychiatry. 1974;131:1251–1267. doi: 10.1176/ajp.131.11.1251. [DOI] [PubMed] [Google Scholar]
- Peng C, Zuo Y, Kwan KM, Liang Y, Ma KY, Chan HY, Huang Y, Yu H, Chen ZY. Blueberry extract prolongs lifespan of Drosophila melanogaster. Exp Gerontol. 2012;47:170–178. doi: 10.1016/j.exger.2011.12.001. [DOI] [PubMed] [Google Scholar]
- Reeves PG. Components of the AIN-93 diets as improvements in the AIN-76A diet. J Nutr. 1997;127:838S–841S. doi: 10.1093/jn/127.5.838S. [DOI] [PubMed] [Google Scholar]
- Reeves PG, Nielsen FH, Fahey GC., Jr AIN-93 purified diets for laboratory rodents: final report of the American Institute of Nutrition ad hoc writing committee on the reformulation of the AIN-76A rodent diet. J Nutr. 1993;123:1939–1951. doi: 10.1093/jn/123.11.1939. [DOI] [PubMed] [Google Scholar]
- Ristow M, Schmeisser S. Extending life span by increasing oxidative stress. Free Radic Biol Med. 2011;51:327–336. doi: 10.1016/j.freeradbiomed.2011.05.010. [DOI] [PubMed] [Google Scholar]
- Rizos EC, Ntzani EE, Bika E, Kostapanos MS, Elisaf MS. Association between omega-3 fatty acid supplementation and risk of major cardiovascular disease events: a systematic review and meta-analysis. JAMA. 2012;308:1024–1033. doi: 10.1001/2012.jama.11374. [DOI] [PubMed] [Google Scholar]
- Salmon AB, Richardson A, Perez VI. Update on the oxidative stress theory of aging: does oxidative stress play a role in aging or healthy aging? Free Radic Biol Med. 2010;48:642–655. doi: 10.1016/j.freeradbiomed.2009.12.015. [DOI] [PMC free article] [PubMed] [Google Scholar]
- Selman C, McLaren JS, Collins AR, Duthie GG, Speakman JR. Deleterious consequences of antioxidant supplementation on lifespan in a wild-derived mammal. Biol Lett. 2013;9:20130432. doi: 10.1098/rsbl.2013.0432. [DOI] [PMC free article] [PubMed] [Google Scholar]
- Shen LR, Xiao F, Yuan P, Chen Y, Gao QK, Parnell LD, Meydani M, Ordovas JM, Li D, Lai CQ. Curcumin-supplemented diets increase superoxide dismutase activity and mean lifespan in Drosophila. Age (Dordr.) 2013;35:1133–1142. doi: 10.1007/s11357-012-9438-2. [DOI] [PMC free article] [PubMed] [Google Scholar]
- Spindler SR. Caloric restriction: from soup to nuts. Ageing Res Rev. 2010;9:324–353. doi: 10.1016/j.arr.2009.10.003. [DOI] [PubMed] [Google Scholar]
- Spindler SR. Review of the literature and suggestions for the design of rodent survival studies for the identification of compounds that increase health and life span. Age (Dordr) 2012;34:111–120. doi: 10.1007/s11357-011-9224-6. [DOI] [PMC free article] [PubMed] [Google Scholar]
- Spindler SR, Mote PL. Screening candidate longevity therapeutics using gene-expression arrays. Gerontology. 2007;53:306–321. doi: 10.1159/000103924. [DOI] [PubMed] [Google Scholar]
- Spindler SR, Mote PL, Flegal JM (2013a) Dietary supplementation with Lovaza and krill oil shortens the lifespan of long-lived F1 mice. Submitted [DOI] [PMC free article] [PubMed]
- Spindler SR, Mote PL, Flegal JM, Teter B. Influence on longevity of blueberry, cinnamon, green and black tea, pomegranate, sesame, curcumin, morin, Pycnogenol, quercetin and taxifolin fed isocalorically to long-lived, F1 hybrid mice. Rejuvenation Res. 2013;16:143–151. doi: 10.1089/rej.2012.1386. [DOI] [PubMed] [Google Scholar]
- Spindler SR, Mote PL, Li R, Dhahbi JM, Yamakawa A, Flegal JM, Jeske DR, Li R, Lublin AL (2013c) β1-Adrenergic receptor blockade extends the life span of Drosophila and long-lived mice. Age (Dordr) 35:2099–2109. doi:10.1007/s11357-012-9498-3 [DOI] [PMC free article] [PubMed]
- Steger RW, Bartke A, Cecim M. Premature ageing in transgenic mice expressing different growth hormone genes. J Reprod Fertil Suppl. 1993;46:61–75. [PubMed] [Google Scholar]
- Waner T, Nyska A. The toxicological significance of decreased activities of blood alanine and aspartate aminotransferase. Vet Res Commun. 1991;15:73–78. doi: 10.1007/BF00497793. [DOI] [PubMed] [Google Scholar]


