

Summary
Mammalian cells have a remarkable capacity to compensate for heterozygous gene loss or extra gene copies. One exception is Down syndrome (DS) where a third copy of chromosome 21 mediates neurogenesis defects and lowers the frequency of solid tumors. Here we combine live-cell imaging and single-cell analysis to show that increased dosage of chromosome 21-localized Dyrk1a steeply increases G1 cell cycle duration through direct phosphorylation and degradation of cyclin D1 (CycD1). DS-derived fibroblasts showed analogous cell cycle changes that were reversed by Dyrk1a inhibition. Furthermore, reducing Dyrk1a activity increased CycD1 expression to force a bifurcation, with one subpopulation of cells accelerating proliferation and the other arresting proliferation by co-stabilizing CycD1 and the CDK inhibitor p21. Thus, dosage of Dyrk1a repositions cells within a p21-CycD1 signaling map, directing each cell to either proliferate or to follow two distinct cell cycle exit pathways characterized by high or low CycD1 and p21 levels.
Introduction
The term “dosage effect” is often used to describe a heterozygous gene loss or the presence of an extra gene copy that causes a profound change in phenotype. Reported heterozygous phenotypes are relatively rare in mammals with ∼75% of known loss-of-function mutations in human diseases being recessive (Jimenez-Sanchez et al., 2001). This suggests that compensation mechanisms exist for many genes to accommodate two-fold protein level changes. A model case of a mammalian dosage effect is Down syndrome (DS) where a third copy of chromosome 21 (trisomy 21) is associated with mental retardation, early onset of Alzheimer's diseases and a number of additional phenotypic changes (Coyle et al., 1988).
To determine how dosage effects create phenotypes and to understand how dosage mechanisms might be used for cell regulation, we focused on the protein Dyrk1a, dual-specificity tyrosine-(Y)-phosphorylation regulated protein kinase 1A, whose gene is localized within the DS-critical region on chromosome 21. We selected Dyrk1a since it is one of the relevant contributors to the neurological abnormalities associated with DS (Park et al., 2009) and since it clearly shows dosage effects on neurogenesis and brain development on its own. For instance, Dyrk1a heterozygous knockout mice show reduced brain size whereas Dyrk1a overexpression was sufficient to induce learning defects and delay neuromotor development in mice (Altafaj et al., 2001; Fotaki et al., 2002).
While most studies on Dyrk1a focused on neuronal defects, studies of Dyrk1a orthologs in yeast, C. elegans, Dictyostelium, and mammals have shown that Dyrk family proteins also have conserved roles in regulating proliferation (Becker, 2012; Litovchick et al., 2011). Since neurogenesis encompasses transitions from proliferating precursor cells to terminally differentiated cells, it is conceivable that Dyrk1a contributes to the neurogenesis defect indirectly through regulating the cell cycle exit decision during neurogenesis. Supporting such a hypothesis, Litovchick et al., 2011 identified a potential link from Dyrk1a to Lin52 and DREAM complex assembly which in turn regulates quiescence and sensescence. We recently identified Dyrk1a in an siRNA screen of nerve growth factor (NGF)-triggered differentiation using a PC12 model system (Chen et al., 2012). Among a set of regulatory proteins that we targeted by siRNA, Dyrk1a was the strongest hit when we separated a group of genes that controlled the proliferative state under NGF stimulation. Other genes in this group were cell cycle regulatory proteins such as cyclin D1 (CycD1). This suggested a potential role for Dyrk1a in regulating the G1 phase where CycD1 acts and where the cell cycle entry versus exit decision is made (Massague, 2004). However, it remained unclear whether Dyrk1a plays a role in cell cycle regulation under normal growth condition and if so, which cell cycle steps are controlled by Dyrk1a. Moreover, it was unknown how Dyrk1a's dosage might contribute to cell cycle regulation in normal versus DS-derived cells.
Here, we investigated the role of Dyrk1a in controlling cell cycle entry and exit using long-term time-lapse microscopy, single-cell image analysis, and biochemical validation. We show that Dyrk1a mediates a dose-dependent increase in the duration and variability of the G1 phase via direct phosphorylation and subsequent degradation of CycD1. In contrast, knockdown of Dyrk1a greatly increased CycD1 protein levels and split cells into two fates, with one subpopulation accelerating the cell cycle with a significantly shortened G1 duration while the other entering an arrested state. We show that this arrested state results from the co-stabilization between CycD1 and p21 which is distinct from a quiescent state reached during serum starvation where p21 and CycD1 are both low. Finally, in DS-derived fibroblasts, we observed a prolongation of G1, a reduced percentage of cycling cells, and significantly lower CycD1 levels. These phenotypes could be rescued by knockdown or inhibition of Dyrk1a. Together, our study introduces a dosage effect for cell fate whereby Dyrk1a controls the relative CycD1 to p21 levels to guide cells either towards cell cycle entry or towards one of two distinct cell cycle exit pathways.
Results
Dyrk1a extends the duration of the G1 phase of the cell cycle and increases its variability
We monitored the fraction of cells in S-phase to test whether Dyrk1a has a role in regulating cell cycle progression under normal growth condition in non-transformed neonatal foreskin fibroblasts (BJ-5ta cells). Using two independent siRNAs, knockdown of Dyrk1a significantly enhanced the percentage of cells in S-phase, consistent with prior observations (Figure 1A & B) (Litovchick et al., 2011).
Figure 1. Loss of Dyrk1a leads to shortened G1 duration and reduced G1 variability.
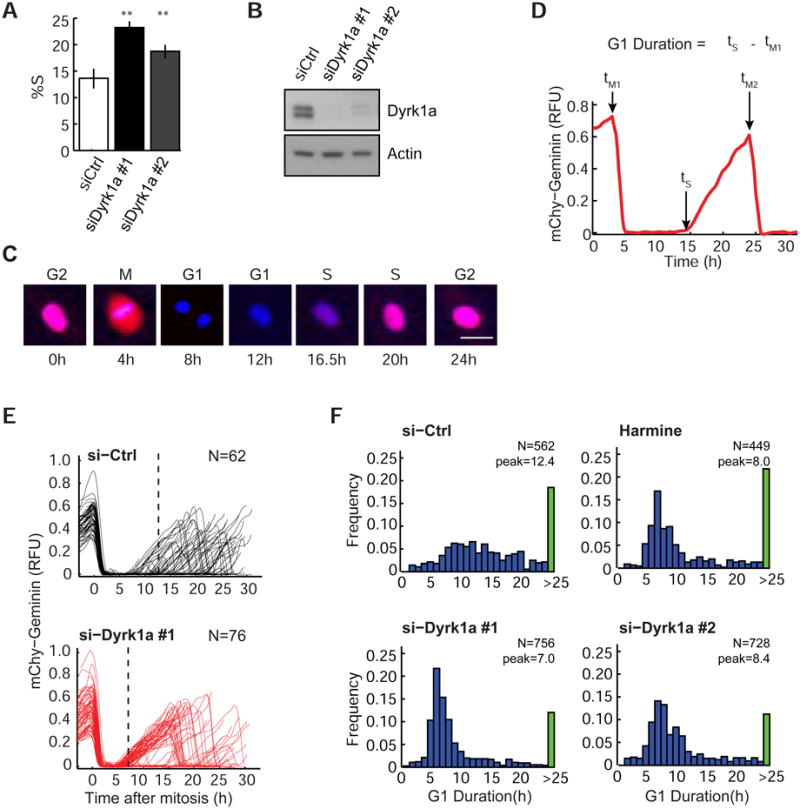
(A) Knockdown of Dyrk1a increases the percentage of cells in S-phase (%S) (mean ± SD of 4 wells; **: p<0.01). (B) Knockdown efficiency of synthetic siRNAs against Dyrk1a. (C) Images of a BJ-5ta cell proceeding through the cell cycle. Images are overlays of H2B-mTurq (blue) and mChy-Geminin (red). Scale: 40nm. (D) Single cell trace of mChy-Geminin shown in (C). (E and F) Loss of Dyrk1a significantly shortens G1 duration. Graph showing mChy-Geminin traces in individual cells treated with control or Dyrk1a siRNA (dotted line: median G1 duration) (E). Histograms of G1 duration in cells treated with the indicated siRNAs or Dyrk1a-specific inhibitor (Harmine) at 3μM (peak: median G1 duration excluding cells that do not finish G1 phase (>25h, green bar)) (F). Only cells with at least one mitosis during the imaging period were included in the plot. N: cell numbers. See also Figure S1.
Metazoans typically regulate proliferation by controlling exit and reentry into the cell cycle in the G1 phase. We therefore examined whether Dyrk1a regulates the duration of G1 by combining fluorescent reporters with long-term time-lapse microscopy. We expressed two fluorescent protein conjugates: Histone 2B-mTurquoise (H2B-mTurq) to track cell nuclei over time and a cell cycle reporter, mCherry-Geminin (mChy-Geminin) to measure the time between anaphase and the G1/S transition in each cell (Figure S1A & B). Geminin is a substrate of the APC (anaphase promoting complex) E3 ubiquitin ligase and is degraded at anaphase (tM) during mitosis and starts to gradually accumulate at the G1/S transition (ts) when APC is inactivated (Figure 1C & D) (Sakaue-Sawano et al., 2008). The time spent between M and S phase (ts – tM1), defined in this work as “G1”, can be measured computationally by automated image analysis based on the rapid drop and subsequent rise in mChy-Geminin levels (Figure 1D). When we aligned individual traces to the time of mitosis, G1 phase was highly variable under normal growth conditions (Figure 1E). Strikingly, either knockdown or inhibition of Dyrk1a using Harmine (a Dyrk1a kinase inhibitor) greatly shortened G1 duration (median 12.4h vs. 7-8h), and at the same time markedly reduced its variability (Figure 1F). Thus, Dyrk1a increases the median duration between mitosis and DNA replication and renders this time interval more variable.
Increased dosage of Dyrk1a causes a steep increase in G1 duration
We next asked whether the variability of G1 duration under normal growth condition can be explained by a dosage effect whereby small changes in the expression of Dyrk1a may cause a non-linear increase in the duration of the cell cycle. To gain control over the single cell expression level of Dyrk1a, we knocked down endogenous Dyrk1a and replaced it with a tetracycline-inducible, mCitrine-tagged Dyrk1a (tet-mCit-Dyrk1a) (designed to be Dyrk1a siRNA resistant) (Figure 2A) using BJ-5ta cells (stably expressing H2B-mTurq and mChy-Geminin). The tet-mCit-Dyrk1a rescued the Dyrk1a knockdown effect on G1 duration (Figure 2B), arguing that the conjugated form of Dyrk1a maintains the function of the endogenous kinase. Moreover, cells over-expressing wild-type Dyrk1a (WT) but not catalytically inactive Dyrk1a (K188R, hereafter “KR”) exhibited prolonged G1 (Figure 2B) as well as an increased fraction of non-cycling cells (entirely blue traces, Figure 2C), suggesting that Dyrk1a's kinase activity is required for its cell cycle effect.
Figure 2. Dosage effect of Dyrk1a on G1 cell cycle progression.

(A) Induction of siRNA-resistant mCit-Dyrk1a by doxycycline (DOX). DOX was used at 0.1μg/ml. (B) Rescue of Dyrk1a knockdown by DOX-induced expression of WT but not kinase-dead (KR) mCit-Dyrk1a. G1 duration is shown with boxplots (**: p<0.01). Only cells that had finished an entire G1 phase were counted. For the rescue (+DOX), only cells that were mCit-positive were included. (C) Comparison of cell cycle progression in cells expressing mCit-Dyrk1a WT (left) or mCit-Dyrk1a KR (right) under si-Dyrk1a conditions. DOX (0.1μg/ml) was added to cells 24h prior to live-imaging. Heat-maps of mChy-Geminin intensities in individual cells over time are shown. Each horizontal line represents a single cell. Blue and yellow represent low and high mChy-Geminin intensity, respectively. Cells were clustered first according to their time of mitosis and then to their time of S-phase entry. (D) Examples of two BJ-5ta cells expressing high or low levels of mCit-Dyrk1a WT, proceeding through the cell cycle. (Left) Images are overlays of H2B-mTurq (blue) and mChy-Geminin (red). Images of mCit-Dyrk1a WT (green) were taken and shown at the end of the movie (42h). (Right) mChy-Geminin traces of the two indicated cells (left) in the images. The corresponding mCit-Dyrk1a intensity is marked on the right (green dots). “G1” indicates G1 duration. Scale: 40μm. (E-F) Dose-dependent effect of Dyrk1a on G1 cell cycle progression. As in (D), after extracting the G1 duration and final mCit intensities from all of the tracked cells (C), G1 duration (E) was plotted as a function of mCit intensity. For (F), CycD1 intensity was then measured by immunostaining as a function of mCit intensity in the final frame. The gray box marks the mCit-tagged protein expression levels that are equal to 100-200% of the endogenous Dyrk1a levels. Data represents mean ± SEM of cells within a given bin. (G) Effect of Dyrk1a on CycD1 protein level changes. See also Figure S2.
We then asked if small increases in the single-cell expression level of mCit-Dyrk1a alters G1 duration by quantifying the fluorescence intensity of mCit-Dyrk1a in each of the analyzed cells at the end of time-lapse imaging (Figure 2D). The absolute expression level was calibrated to endogenous expression of Dyrk1a (Figure S2 and Supplemental Methods). This analysis revealed a sensitive Dyrk1a dose- and kinase activity-dependent increase in G1 duration. The sensitive region where mCit-Dyrk1a WT expression steeply increased G1 duration was in a window 100-200% above the endogenous Dyrk1a levels (Figure 2E), exactly in the region where the dosage effect of Dyrk1a would be expected to occur in DS patients. Thus, given that the typical noise in single cell protein expression level is ∼30% (Niepel et al., 2009), the high variability of the G1 duration in the presence of Dyrk1a (Figure 1) can at least in part be explained by a combination of a dosage effect and a natural variation in endogenous Dyrk1a levels.
Dyrk1a controls G1 duration by reducing CycD1 expression
We then focused on the mechanism by which Dyrk1a mediates its dosage effect on the G1 phase by examining whether Dyrk1a may regulate CycD1, a key driver of cell cycle entry. Immunostaining and single cell analysis showed that increased levels of Dyrk1a significantly decreased the levels of CycD1 within the same range where a steep increase in G1 duration occurs (Figure 2F). This decrease in CycD1 level upon Dyrk1a induction was confirmed by western blot analysis (Figure 2G, lanes 2 & 4). We also tested whether reduced Dyrk1a activity could increase CycD1 levels. Indeed, a loss-of-function of Dyrk1a using either si-Dyrk1a or Harmine resulted in a marked increase in CycD1 expression (Figure 2G, lanes 1 & 2, and 3A). We further showed that the proliferation increase upon Dyrk1a knockdown or inhibition can be suppressed by co-knockdown of CycD1 (Figure 3B). This argues that CycD1 acts downstream of Dyrk1a and that the regulation of CycD1 levels by Dyrk1a is an important mechanism through which Dyrk1a regulates the G1 phase of the cell cycle.
Figure 3. The cell cycle effect of Dyrk1a is mediated by direct phosphorylation and subsequent degradation of CycD1.
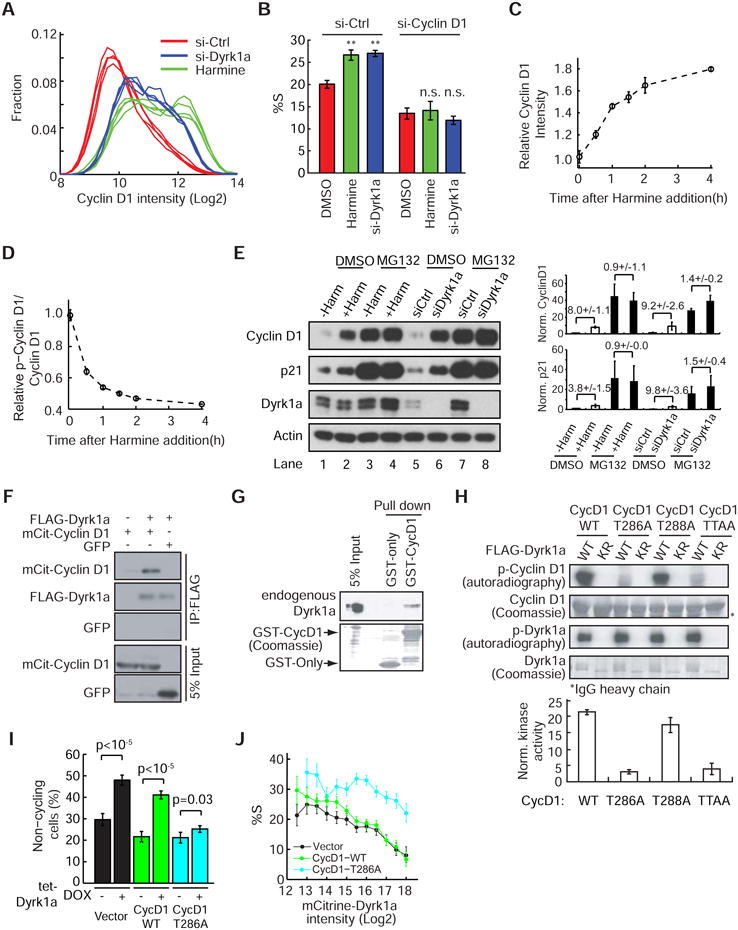
(A) Frequency plot showing the increase of CycD1 in cells treated with Dyrk1a-siRNA or Harmine. Each line represents the average frequency data from one well as a function of CycD1 intensity (n>2000 cells per well). (B) The %S (percent in S-phase) increase in cells treated with Dyrk1a-siRNA or Harmine is mediated through CycD1 (**: p<0.01; n.s.: p-value is not significant; mean ± SD of 4 replicate wells). (C & D) Rapid increase of CycD1 and decrease of phospho-CycD1 (T286) after Harmine treatment (mean ± SD of 4 replicate wells). The phospho-CycD1 staining signal was normalized by the CycD1 staining intensity per cell. (E) The Dyrk1a-mediated CycD1 degradation is proteasome-dependent. Mock or siRNA-treated cells were incubated with either DMSO or MG132 ± 5μM Harmine for 4h, lysed and analyzed by western blotting (left). The expression level of CycD1 and p21 were quantified and normalized with actin (right, mean ± SEM of 4 replicates). Fold-changes ± SEM are labeled on top of each pair. (F) Dyrk1a interacts with CycD1. Transfected 293T cells were lysed and FLAG-tagged proteins were isolated with M2-beads. (G) CycD1 interacts with Dyrk1a. The recombinant GST-tagged proteins were incubated with crude cell lysates. Glutathione beads-bound protein complex were isolated and analyzed. (H) Dyrk1a phosphorylates CycD1 at Thr 286. 293T cells were transfected with FLAG-Dyrk1a WT or KR. FLAG-tagged proteins were isolated and an in vitro kinase assay was performed using recombinant GST-CycD1 variants as substrates. The kinase reactions were analyzed by SDS-PAGE and autoradiography. The kinase activities were quantified and normalized with FLAG-Dyrk1a (bottom, mean ± SEM of 4 replicates). (I & J) Overexpression of CycD1-T286A but not the wild-type can suppress the Dyrk1a-dependent cell cycle arrest. Empty vector, CycD1-WT, or the CycD1-T286A mutant were introduced to BJ-5ta reporter cells expressing tet-mCit-Dyrk1a and subjected to antibiotic selection. In (I), the cell lines were followed by time-lapse imaging ± DOX and the percent of non-cycling cells were calculated (mean ± SD of 4 replicate wells). In (J), the cell lines were pulsed with BrdU and the percent in S-phase (%S) was then measured as a function of mCit-Dyrk1a intensity (mean ± 95% bootstrap confidence interval). See also Figure S3.
Dyrk1a degrades CycD1 by direct phosphorylation of CycD1 at Thr286
We next tested whether CycD1 protein levels are directly regulated by Dyrk1a by examining the kinetics of CycD1 changes after inhibiting Dyrk1a. Harmine addition triggered a rapid increase in CycD1 with a half-time of 50 minutes (Figure 3C). In the same experiment, we observed an even more rapid decrease (t½ = 25 min) in CycD1 Thr 286 phosphorylation following Harmine addition (Figure 3D). Since phosphorylation of CycD1 at T286 by other kinases has previously been associated with a decrease in CycD1 stability (Diehl et al., 1997), we considered that the regulation of CycD1 levels by Dyrk1a might result from phosphorylation-mediated CycD1 degradation. Indeed, using the proteasome inhibitor MG132, we found that the effect of Dyrk1a on the CycD1 concentration is lost (Figure 3E). Thus, the Dyrk1a-mediated CycD1 down-regulation is controlled by proteasome-driven degradation.
The rapid dephosphorylation of the CycD1 T286 site after Harmine addition (Figure 3D) suggests that CycD1 might be directly phosphorylated by Dyrk1a. To test this, we first used co-immunoprecipitation to examine whether Dyrk1a interacts with CycD1. As shown in Figure 3F, FLAG-tagged Dyrk1a pulls down mCit-fused CycD1. This interaction was bidirectional as recombinant GST-CycD1 was able to pull down endogenous Dyrk1a, supporting the interpretation that Dyrk1a directly interacts with CycD1 (Figure 3G). To test for a direct phosphorylation of CycD1 by Dyrk1a, we conducted an in vitro kinase assay using recombinant CycD1 as a substrate. As shown in Figure 3H, the WT Dyrk1a, but not the KR mutant, phosphorylated CycD1 in vitro. Furthermore, the Dyrk1a activity toward the T286A mutant of CycD1 was dramatically reduced (Figure 3H & S3A), while a construct with the T288A mutation on CycD1 retained a similar level of phosphorylation (Figure 3H). The latter result points to a role of Dyrk1a in regulating CycD1 T286, contrasting with a previous study showing selective phosphorylation on the T288 site by Myrk/Dyrk1b, a kinase with sequence homology to Dyrk1a (Takahashi-Yanaga et al., 2006).
We next examined whether CycD1 T286 phosphorylation is sufficient to explain Dyrk1a's dosage effect on CycD1 protein level and cell cycle entry. To test this hypothesis, HA-tagged CycD1 WT or CycD1 T286A constructs were stably introduced into the tet-mCit-Dyrk1a reporter cell line (Figure 2). Upon Dyrk1a induction, the mutant CycD1 T286A protein remained at a high level (Figure S3B) and did not undergo Dyrk1a dosage-dependent degradation in contrast to the wild-type CycD1 (Figure S3C). Time-lapse imaging and single-cell analysis further suggested that CycD1 T286A suppresses the Dyrk1a-mediated increase of the fraction of non-cycling cells (Figure 3I & S3D) and decreases the fraction of cells in S-phase (Figure 3J).
Overall, these experiments demonstrate that Dyrk1a controls the rate of CycD1 degradation by directly phosphorylating CycD1 at Thr 286 and thereby regulates the fraction of cycling cells.
Increased CycD1 expression causes a parallel increase in the expression of the CDK inhibitor p21
The activity of CycD1/CDK4/6 complexes is not only regulated by the concentration of CycD1, but also by the concentration of CDK inhibitors (CKIs) that keep CDK/Cyclin complexes inactive or active (Sherr and Roberts, 1999). We therefore tested whether Dyrk1a may have an additional role in regulating the CDK inhibitor, p21, which can be tightly associated with CycD/CDK4/6 complexes. Surprisingly, Dyrk1a knockdown or kinase inhibition not only increased CycD1 levels but also increased p21 (Figure 3E, S4A & B). This upregulation of p21 was likely due to an increase in protein stability, as it was lost upon proteasome inhibition (Figure 3E).
This raised the question whether Dyrk1a directly regulates p21 stability or if the upregulation is indirectly caused by CycD1 upregulation. To differentiate between these two possibilities, we treated cells with Harmine in control or CycD1 knockdown cells (with CycD3 co-knockdown to prevent compensation). As expected, addition of Harmine resulted in an increase in p21 levels (Figure 4A, top). However, the increase was lost when Dyrk1a inhibition was combined with CycD knockdown (Figure 4A, bottom). Thus, p21 levels are not directly controlled by Dyrk1a but change instead indirectly as a result of the Dyrk1a-mediated change in CycD1 level.
Figure 4. Co-dependent stabilization of CycD1 and p21.
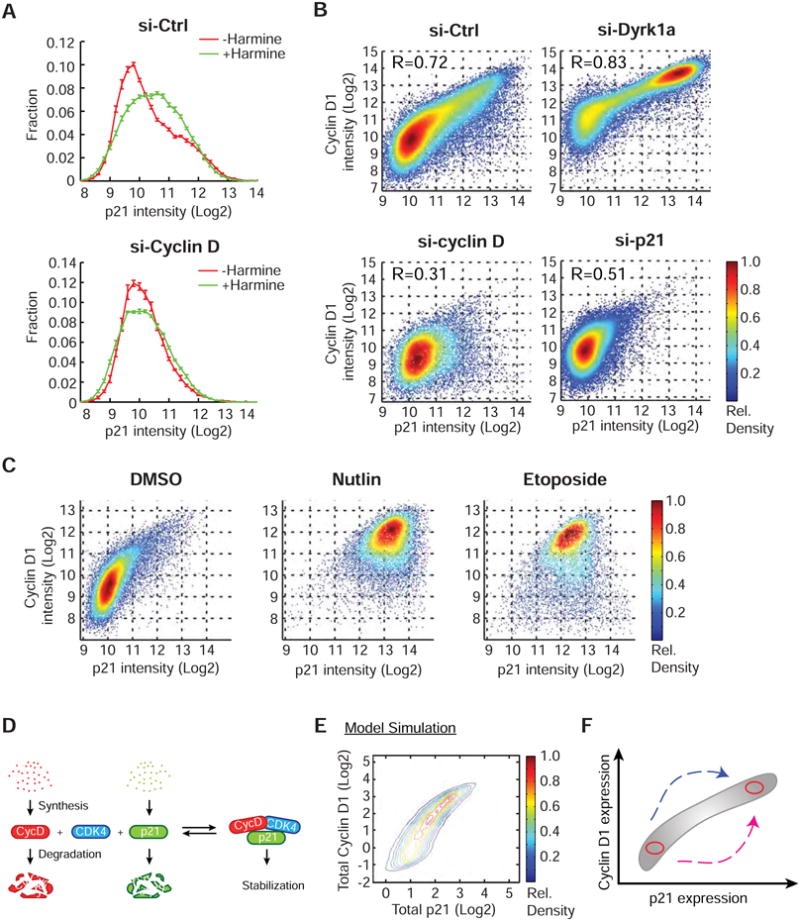
(A) Frequency plots showing that the increase of p21 after 6h of Harmine treatment is due to CycD (mean ± SD of 4 replicate wells). (B) Density scatter plots of p21 versus CycD1 fluorescence intensity. Note that cells with high-CycD1 and high-p21 levels (top-right quadrant) were lost upon CycD1 or p21 knockdown. R: Pearson's correlation coefficients. (C) Density scatter plots showing that an increase in p21 leads to an increase in CycD1. Nutlin and Etoposide (24h) were used to increase p21 levels. (D) Schematic showing that CycD1 and p21 are protected from degradation when they assemble in a p21/CycD1/CDK4 complex. (E) Model simulations for the single cell distribution of total p21 and CycD1 levels using the scheme shown in (D). (F) Schematic showing two routes to reach high-CycD1 and high-p21 protein levels. See also Figure S4.
Single-cell expression levels of CycD1 and p21 are highly correlated due to co-stabilization
The CycD1-dependent increase in p21 led us to hypothesize that CycD1 and p21 stabilize each other. Indeed, knockdown of either p21 or CycD1 reduced the other accordingly (Figure S4C & D). This may reflect a mechanism whereby p21 and CycD1 degradation is suppressed when a CycD1/CDK4/p21 complex is formed while the non-complexed proteins can readily be degraded.
To better understand this inter-dependence between p21 and CycD1, we visualized the respective levels of the two proteins in each cell. We then plotted the data in a density plot that shows the fraction of cells within the population that have a given level of p21 and CycD1. This single cell analysis showed a significant overall correlation between p21 and CycD1 levels (R=0.72) that became increasingly stronger as the level of CycD1 and p21 increased (Figure 4B, si-Ctrl). Cells in which we depleted CycD1 or p21 lost the correlation (Figure 4B). In contrast, cells in which we depleted Dyrk1a, CycD1 levels increased and the correlation between p21 and CycD1 became stronger (R=0.83, Figure 4B). As an additional test of this hypothesis, we considered that an increase in p21 should also lead to an increase in CycD1 levels. Indeed, a p21 increase induced by Nutlin (an Mdm2 inhibitor which stabilizes the p21 activator p53) or Etopside (a DNA damage inducer which causes the upregulation of p21) both led to a clear increase in CycD1 levels (Figure 4C).
To validate whether the correlation in the total expression levels of p21 and CycD1 can be explained by co-stabilization, we tested whether the shape of the observed distribution can be recreated by a quantitative model, assuming that CycD1 and p21 are protected from degradation when they assemble in a p21/CycD1/CDK4 complex (Figure 4D). Figure 4E shows model calculations for the single cell distribution of total p21 and CycD1 levels assuming a constant average level of free p21, a variable level of free CycD1, and a previously reported level of protein expression noise. Indeed, this simplified model recreated the co-dependence in the 2-dimensional (2D) p21-CycD1 map (Figure 4F). Similar to the experimental perturbations, the simulation also recapitulated the curved co-dependent increase of total p21 and CycD1 protein levels when we modeled either an increased synthesis of CycD1 in the context of constant free p21 or an increased synthesis of p21 in the context of constant free CycD1 (Figure 4F & S4E).
Dyrk1a generates a bimodal distribution in the p21-CycD1 map that can be explained by a double negative feedback for p21 degradation
While co-stabilization explains the curved shape of the p21-CycD1 distribution, it does not explain why two distinct subpopulations of cells exist in Dyrk1a knockdown cells (Figure 4B). Bimodal distributions typically result from positive or double negative feedback loops. Based on previous reports, a double negative feedback may exist in this system involving p21 suppression of CDK/cyclin activity and CDK/cyclin-mediated degradation of p21 (Bornstein et al., 2003; Hengst et al., 1998) (Figure 5A, left; activity could be either cyclin E/CDK2 or cyclin D/CDK4). When incorporating this double negative feedback in the co-stabilization model, analysis of the stability of steady states reveals a critical saddle point (SP) where cells either reduce or increase p21 levels (Figure 5A, right). Moreover, this model can explain the observed co-dependence and bimodality for the p21-CycD1 map observed in the Dyrk1a knockdown cells as well as the unimodal distributions in control and CycD1 knockdown cells (Figure 5B).
Figure 5. Dyrk1a generates a bimodal distribution in the p21-CycD1 map and forces a decision between cell cycle entry and two distinct cell cycle exit pathways.
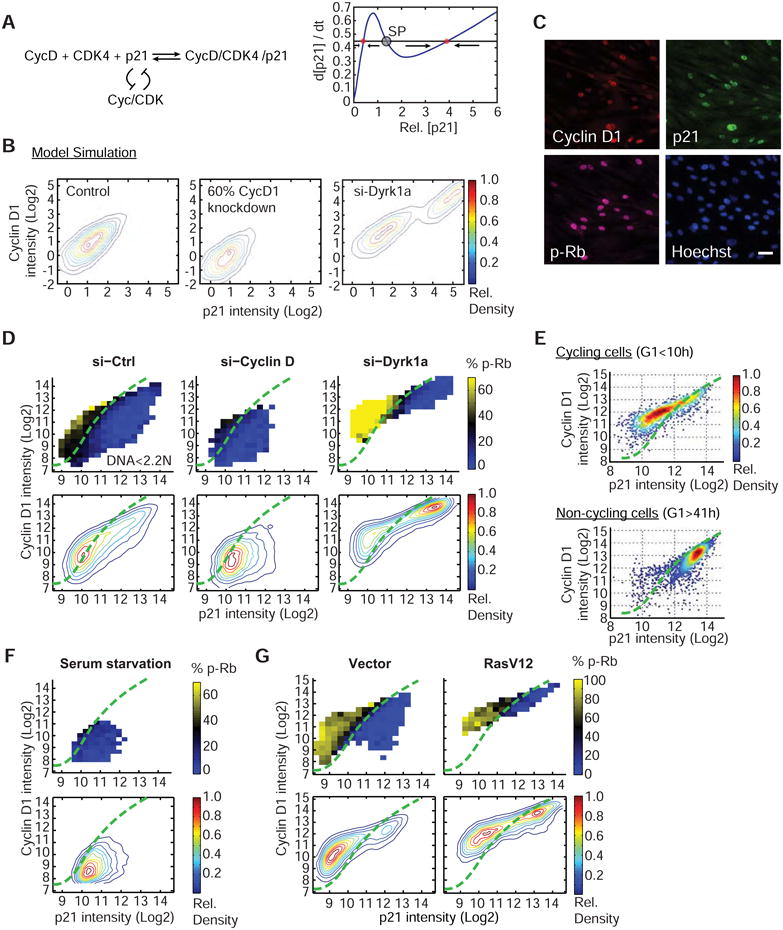
(A) Schematic showing that adding a p21-degradation based double negative feedback to the CycD1 and p21 co-stabilization scheme (left) creates a bifurcation in p21 levels (right). SP: saddle point. (B) Modeling recreates the bimodal distribution in the p21-CycD1 map in Dyrk1a-siRNA cells and the unimodal distribution in control and CycD1-siRNA cells. Of note, the equilibrium distribution in a bistable system depends on whether the starting concentration of CycD1 is high or low. In the case shown for the control and CycD1-siRNA condition, CycD1 started low, and in the case shown for Dyrk1a knockdown, CycD1 started high. (C) Automated image analysis monitors CycD1, p21 and phospho-Rb (S807/811) (p-Rb). Scale bar: 40μm. (D) Heat map analysis of p21-CycD1 intensity and phospho-Rb at G1 phase (DNA content less than 2.2 N) shows a clear boundary between cycling and non-cycling regions. Contour plots of cell density from all cell cycle phases are shown in the lower panels. The percent of p-Rb-positive cells (% phospho-Rb) was calculated for equally-spaced bins of the p21 and CycD1 intensity and is marked according to the color bar. Cells were treated with indicated siRNAs for 72h before analysis. The boundary (green line) was drawn across the black colored-bins on the siCtrl heat map and overlaid on top of the other plots (Supplemental Information). Each panel contains ∼20,000 cells. Note that due to day-to-day staining and imaging variations, the boundary position compares experiments done at the same time. (E) Persistent G1-arrested si-Dyrk1a cells are marked by high CycD1 and high p21 levels. Time-lapse imaging followed by immunostaining for CycD1 and p21 enabled the measurement of G1 duration and final p21 and CycD1 levels for each cell. Cycling cells: cells that entered G1 phase for less than 10h. Non-cycling cells: cells that stayed in G1 phase for the entire imaging time (42h). The plots only include cells that were in G1 phase at the end of imaging. (F & G) Heat map analysis of p21-CycD1 intensity and phospho-Rb at G1 phase in serum-arrested cells (F) or RasV12 expressing cells (G). See also Figure S5 & S6.
Dyrk1a forces a decision between cell cycle entry and two distinct cell cycle exit pathways
We then tested whether the bimodality of the CycD1-to-p21 distribution in Figure 4B and Figure 5B causes different cell fate outcomes. To measure the G1 CDK activity in single cells, we used phosphorylation of the tumor suppressor retinoblastoma (Rb) at Serine 807/811 as a marker for cell cycle entry (Ren and Rollins, 2004). Rb is a well-known dual cyclin D-CDK4/6 and cyclin E-CDK2 substrate that requires phosphorylation to be inactivated and thereby promotes cell cycle entry. Unphosphorylated (or hypophosphorylated) Rb is associated with reversible or permanent exit from the cell cycle (Sherr, 1996). Using immunofluorescence and automated image analysis, we quantified the levels of p21, CycD1, phospho-Rb, and the total DNA content in each cell (Figure 5C). We then created a 2D plot where we overlaid a color code for the percent of phospho-Rb-positive cells (% p-Rb) for different CycD1 versus p21 levels.
Strikingly, the bimodal distribution of CycD1 and p21 levels in Dyrk1a knockdown cells closely matched the decision to either enter or exit the cell cycle (Figure 5D). This argued that the co-stabilization between CycD1 and p21 leads to cell cycle arrest. In addition, the same representation in control cells shows a clear demarcation line separating arrested and cycling cells in which only cells that have relatively higher CycD1 compared to p21 levels are phospho-Rb positive (Figure 5D, green line). This boundary remained at a similar location when we examined control cells or cells treated with siRNAs against CycD1 or Dyrk1a (Figure 5D). This suggests the existence of two types of cell cycle arrest profiles, one with high CycD1 levels and high p21 (Figure 5D, top right of the maps) and the other with low CycD1 levels and low to intermediate levels of p21 (Figure 5D, bottom of the maps).
We hypothesized that cells with relatively low CycD1 levels undergo a more reversible cell cycle arrest whereas cells with high levels of p21 and CycD1 ultimately proceed towards a more persistent cell cycle exit. This notion was supported by measurement the duration of G1 followed by immunostaining of p21 and CycD1 in Dyrk1a-knocked down cells (Figure 5E). Indeed, cells that had spent long periods in G1 (>41h) were nearly exclusively located in the high p21-CycD1 region (Figure 5E). Furthermore, when we put cells into a reversible cell cycle arrest by serum starvation, we found that quiescent, phosho-Rb negative cells were characterized by low levels of p21 and CycD1 (Figure 5F). These cells can readily re-enter the cell cycle upon serum addition.
Together, our results show that Dyrk1a controls cycling and non-cycling cell fates by changing the expression level of CycD1, which in turn can regulate p21 levels. Even in the presence of growth factor, this leads to a three way decision process whereby a cell either (1) enters the cell cycle if CycD1 levels are higher than p21 levels, (2) transiently arrests if CycD1 levels remain low, or (3) undergoes a more persistent cell cycle exit if the levels of CycD1 and p21 co-stabilize each other at high levels.
The p21-CycD1 signaling map provides insight into the mechanism by which oncogenic Ras mediates cell cycle arrest
To further confirm the model that the high p21-CycD1 region in the 2D map reflects a more persistent exit state, we examined how cells alter their relative CycD1 and p21 levels when cells are forced to persistently arrest by aberrant oncogene activation (also known as oncogene-induced senescence) (Serrano et al., 1997). BJ-5ta cells were infected by lentiviruses carrying the oncogenic HRasG12V allele or empty vector and the levels of p21, CycD1, and phospho-Rb were measured. Markedly, oncogenic HRasG12V activation induced a clear bifurcation in cell fate in the p21-CycD1 signaling map (Figure 5G), analogous to the change induced by knockdown of Dyrk1a (the HRasG12V expression was confirmed by western blot in Figure S5A). Similar to Dyrk1a knockdown, cells arrested in response to oncogenic HRasG12V expression were almost exclusively located in the high p21-CycD1 region but not in the low CycD1 region (Figure 5G, and quantification shown in S5C). As a result, the already high CycD1 protein levels in the high p21-CycD1 region did not undergo further increase after Harmine addition (comparing Figure 5G & S5B, also see S5C). Nevertheless, the group of cells with low CycD1 still responded to Harmine, and increased CycD1 to increase phospho-Rb and consequent proliferation (monitored by percent in S-phase, Figure S5D). The proliferation increase upon Harmine treatment is consistent with the previously reported role of Dyrk1a in oncogenic Ras-induced growth arrest (Litovchick et al., 2011).
In addition, the Litovchick study suggested that Lin52 is a substrate of Dyrk1a with a role in regulating quiescence and senescence. Interestingly, knock down of Lin52 mediated an increase in both CycD1 and p21 (Figure S5E & F), suggesting a potential parallel regulatory pathway. However, in contrast to the increase in CycD1 and p21 mediated by Dyrk1a knockdown, the population shift was more biased towards p21 than toward CycD1 in the 2D signaling map (Figure S5G & H). As a consequence, Harmine treatment only resulted in a moderate proliferation increase in the Lin52 knockdown background (Figure S5I). In a corollary experiment where we stably expressed HA-tagged Lin52-WT or Lin52-S28A (Figure S6A), neither Lin52 WT nor Lin52 S28A was able to rescue the Dyrk1a-dependent increase in non-cycling cells (Figure S6B & C). To avoid potential compensation mechanisms that may occur in stably-expressed cells, we also transiently expressed GFP-tagged Dyrk1a together with Lin52 WT or Lin52 S28A. These experiments showed a partial rescue of the Dyrk1a-dependent decrease in S-phase entry in the Lin52 WT as well as S28A-expressing cells (Figure S6D). While this did not provide support for the hypothesis that Dyrk1a regulates the cell cycle by phosphorylating Lin52, it supports the previous result that Lin52 has a longer-term role in regulating quiescence and senescence.
Down syndrome patient-derived fibroblasts have an extended G1 duration that can be reversed by Dyrk1a inhibition or knockdown
Since DS adult patients have a much lower incidence of solid tumors (10% of a normal age-matched group) (Hasle et al., 2000; Yang et al., 2002), we hypothesized that the extra copy of Dyrk1a in DS patients may protect patients from uncontrolled proliferation by decreasing the relative CycD1 levels which then would increase the length of G1 phase and reduce proliferation. We first examined whether an extra-copy of the Dyrk1a gene in DS patients increases Dyrk1a protein levels using three age-matched pairs of normal and DS-derived fibroblasts. As shown in Figure 6A, all the DS cells (red) have an average increase of Dyrk1a by 1.6-fold compared to their control pair (blue) consistent with previous results (Park et al., 2009).
Figure 6. Extra-dosage of Dyrk1a in Down syndrome-derived fibroblasts contributes to G1 cell cycle changes.
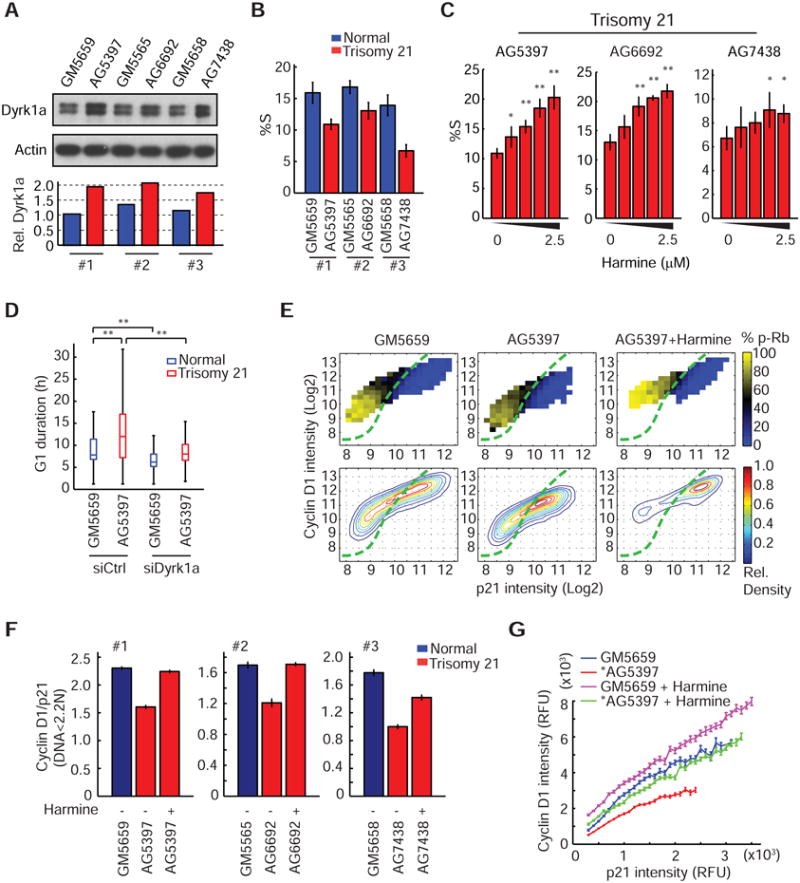
(A) An extra-copy of Dyrk1a gene in DS-derived fibroblasts increases Dyrk1 protein level by 1.6-fold. Representative western blot (top) and the quantification of band intensity (bottom) are shown. Three pairs of age-matched normal (blue) and DS cells (red) were used for the analysis. (B) Quantification showing reduced proliferation (%S) in DS cells (mean ± SD of 6 replicate wells). (C) Dose-dependent increase of proliferation in DS cells treated with Harmine (0 to 2.5μM, 2-fold dilution from the right; mean ± SD of 4 replicate wells; **: p<0.01; *: p<0.05). (D) Box plot showing an increase of G1 duration in DS cells compared to its age-matched control and that this increase could be reduced by knockdown of Dyrk1a (**: p<0.01). (E) Heat map analysis showing a shift of the DS cell (AG5397) distribution toward lower CycD1 levels (middle) compared to the normal control (GM5659) (left). Addition of Harmine rescues the shift and further pushes the population to the top-right quadrant (right). Assays were performed as described in Figure 5D. The boundary was drawn according to GM5659 cells. (F) Quantification showing a decrease of CycD1/p21 ratio in DS cells and that the decrease was restored by Harmine treatment (mean ± SD of 4 replicate wells). (G) The ratio decrease in DS cells (*) shown in (F) is due to a relative decrease of CycD1 when compared within the same p21 binning intensity. The decrease was rescued by Harmine treatment (mean ± SEM, n> 50 cells per bin). See also Figure S7.
We next compared the proliferation status of the DS and control cells using BrdU incorporation. DS fibroblasts had indeed a significantly reduced fraction of cells in S-phase compared to control cells (Figure 6B). Importantly, the reduced proliferation phenotypes in DS cells could be restored by Harmine in a dose-dependent manner, suggesting that S-phase entry has been stalled by the presence of Dyrk1a (Figure 6C).
A possible explanation for the differences in the fraction of cells in S-phase is the extension of G1 duration in DS cells. To examine this possibility, we first determined whether naturally cycling DS cells have a lengthened G1 duration by stably expressing H2B-mTurq and mChy-Geminin in the first pair of cell lines. Using long-term time-lapse imaging, we showed that the DS cells had a markedly elongated G1 duration as well as a much higher G1 variability (Figure 6D). Importantly, when we knocked down Dyrk1a, the extended G1 duration of DS cells could be restored close to that of wild-type cells, suggesting that Dyrk1a dosage is a main cause of the lengthened and variable G1 phase in DS compared to control cells (Figure 6D).
Dosage of Dyrk1a explains the shift in CycD1-to-p21 ratios in DS fibroblasts
Based on our working model in Figure 5, a major effect of Dyrk1a on the G1 cell cycle machinery is a change in relative CycD1 and p21 expression. We predicted that with increasing dosage of Dyrk1a, p21-CycD1 distribution would shift away from the cycling region because the relative CycD1/p21 expression would decrease. Indeed, all three DS cells behaved in the 2D-map as predicted (Figure 6E & S7). We quantified the CycD1/p21 ratio in all three pairs of DS and normal cells and found that DS cells have significantly reduced CycD1/p21 ratio and that the ratio could be restored to wild-type levels by inhibition of Dyrk1a (Figure 6F). We confirmed that this shift in DS cells was primarily due to the relative decrease of CycD1 by binning for p21 expression level, and showing that the shift could be rescued by Harmine treatment (Figure 6G). These results suggest that the slower and more variable proliferation phenotypes of DS cells can be explained by the increase in dosage of Dyrk1a, which in turn reduces CycD1 levels relative to p21 levels.
Discussion
Dyrk1a dosage causes a steep increase in the duration and variability of the G1-phase
The G1 phase of the cell cycle is believed to be the critical period where cells decide to proliferate, assume a reversible arrest, or begin a path towards terminal differentiation or senescence. Our study shows that the protein levels of Dyrk1a control the duration and variability of the G1 phase and sets the fraction of cells in a population directed towards cell cycle entry or exit.
How can subtle differences in Dyrk1a protein levels have a profound effect on G1 cell fates? First, Dyrk1a is synthesized as a constitutively active kinase due to its unique autocatalytic activation mechanism (Himpel et al., 2001). Thus, varying the Dyrkla protein level directly changes total Dyrk1a enzymatic activity. Second, we show that Dyrk1a directly controls the stability of CycD1, a critical mediator of G1 cell cycle progression. By phosphorylating CycD1 on Thr 286, Dyrk1a promotes proteasome-mediated degradation of CycD1, which in turn controls the G1 cell fate decision between cell cycle entry and exit. We further show that the Dyrk1a dosage effect is mediated by a switch-like control system that involves CycD1 and p21. Altogether, these findings provide a molecular mechanism of how the dosage of Dyrk1a controls the G1 cell fate decision.
A bifurcation in the p21-CycD1 signaling map reveals a mechanistic basis for the dosage effect of Dyrk1a-mediated cell cycle entry and exit decisions
A surprising finding of our single cell analysis was the strong correlation between the CycD1 and p21 protein levels. Our data argue that this co-dependence is a result of co-stabilization, whereby complexes of CycD1/CDK4/p21 are resistant to degradation. A second surprising finding was the bimodal distribution of cells in the p21-CycD1 signaling map when Dyrk1a levels were reduced. Our analysis showed that a previously described CDK/Cyclin-mediated degradation of p21 (Bornstein et al., 2003; Hengst et al., 1998), combined with the suppression of CDK/Cyclin activity by p21, is sufficient to recapitulate the observed bimodality in p21 and CycD1 levels.
By determining the levels of phospho-Rb in the 2D p21-CycD1 map, we found that each cell in the high CycD1 and p21 region had low phospho-Rb, arguing that these cells underwent cell cycle arrest. Furthermore, based on this analysis, cells in the lower left corner of the 2D map either entered or exited the cell cycle depending on whether CycD1 levels were relatively higher than p21 levels. Under serum starved condition, nearly all cells were below a critical line in the p21-CycD1 signaling map. This leads to a “boomerang” shape of the p21-CycD1 distribution that distinguishes three outcomes of cell fate that are separated by an invariant boundary in the signaling map (Figure 7A & B). Two cell cycle exit pathways can be distinguished in this map according to their CycD1/p21 levels at the two ends of the curved distribution. Increased Dyrk1a dosage reduces CycD1 and increases the proportion of cells in a reversible arrested state, thus resulting in a G1 phase of greater duration and variability (Figure 7C). On the other hand, loss of Dyrk1a creates a bimodal distribution with one subpopulation entering a rapidly cycling state, and the other exiting the cell cycle with high CycD1 and p21 levels. Thus, Dyrk1a acts as a master regulator that tunes the decision between proliferation and two types of cell cycle exit.
Figure 7. Dyrk1a-mediated shifts in the p21-CycD1 signaling map lead to cell cycle entry or one out of the two cell cycle exit decisions.
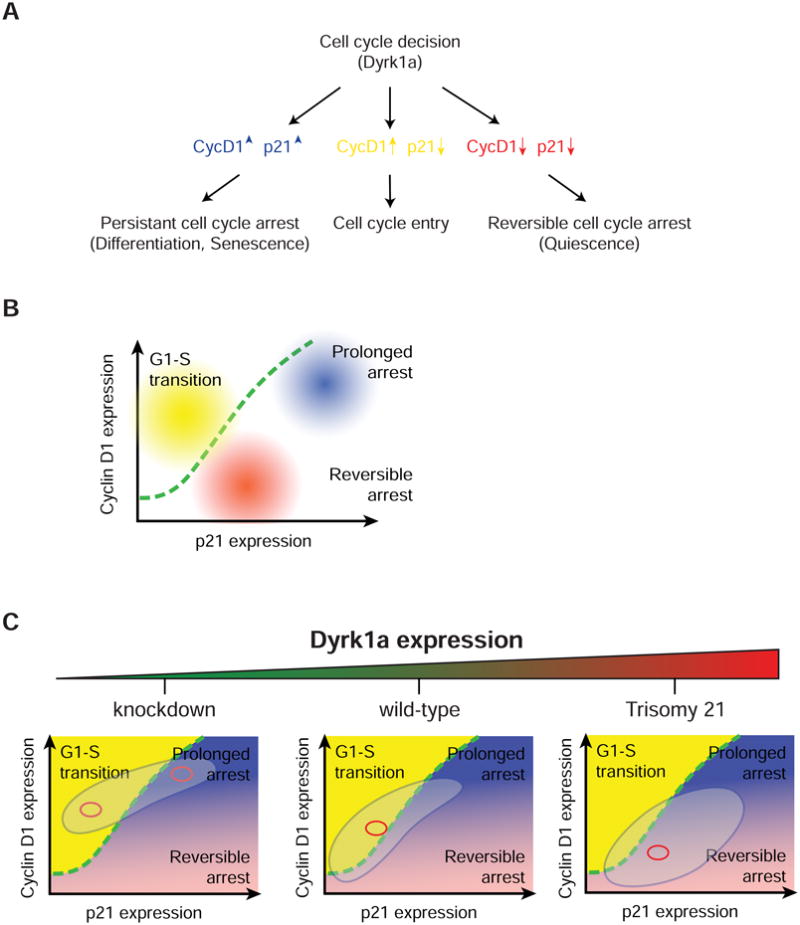
(A & B) Schematic and graph representation showing that three cell fates including the G1-S transition (cycling state), reversible G1 arrest (non-cycling state) and prolonged arrest (non-cycling state) can be distinguished by their respective 2D p21-CycD1 signaling map. (C) Dyrk1a dosage-induced p21-CycD1 response that spreads the population of cells across different cell fate regions. Red circle depicts the center of mass. The big circle depicts the population distribution.
What are the potential advantages for cells to have a dual cell cycle exit system? Our study demonstrates that in contrast to quiescence, the co-stabilization between CycD1 and p21 greatly slows down p21 degradation, providing a potential mechanism to support a more persistent cell cycle exit which is crucial for many cellular processes such as senescence and terminal differentiation. It is interesting to note that the high CycD1-mediated cell cycle arrest that we observed in our study shares a characteristic with oncogene-induced senescence (Figure 5G), both of which have increased levels of CycD1 and p21 (Coleman et al., 2003). Similarly, terminally differentiated cells induced by growth factors were also shown to exhibit a parallel increase in CycD1 and p21 levels (Burton et al., 2007; Demidenko and Blagosklonny, 2008; Ullmannova et al., 2003; Yan and Ziff, 1995). This suggests that senescence as well as terminal differentiation processes may also follow a high p21-CycD1 cell cycle exit pathway.
The relative contribution of CycD1 and Lin52 in mediating Dyrk1a-dependent cell cycle changes
Litovchick et al. (2011) had previously shown that Dyrk1a promotes quiescence and senescence through assembly of a DREAM complex and that Dyrk1a phosphorylation on Ser 28 of Lin52 is required for DREAM assembly (Litovchick et al., 2011). This raised the question of whether CycD1 or Lin52 mediates the observed Dyrk1a dosage effect on cell cycle. Through time-lapse imaging and single-cell analysis, our results suggest that Dyrk1a phosphorylation on CycD1 T286 is sufficient to explain the Dyrk1a-mediated cell cycle arrest and its dosage-dependent suppression on S-phase entry. On the other hand, Lin52 likely has an indirect role in the early stage of cell cycle exit by regulating CycD1 and p21 levels, but may then have additional roles later in regulating long-term quiescence and senescence. Knockdown and epistasis experiments further support the interpretation that CycD1 plays a more dominant role than Lin52 in mediating the Dyrk1a-induced early cell cycle regulation. Supporting such a hypothesis, Dyrk1a phosphorylation on CycD1 T286 has an immediate impact on cell cycle progression through promoting CycD1 degradation, thereby restraining cells from entering into S-phase. Moreover, the changes in CycD1 protein levels as well as cell cycle progression were immediate after Harmine addition while the study of Litovchick et al., the Lin52 effects on cell cycle arrest and senescence were observed more than one week after Lin52 expression or knockdown (Litovchick et al., 2011). This is consistent with the interpretation that Lin52 and its phosphorylation on Ser 28 is primarily involved in long-term cell fate regulation.
Extra-dosage of Dyrk1a and its relation to the pathogenesis of Down syndrome
Increased dosage of Dyrk1a is sufficient to induce learning defects in transgenic mice (Altafaj et al., 2001). Therefore, it has been suggested that Dyrk1a is likely a key gene causing the DS-associated neuronal abnormalities. In the present study, we show that an extra copy of Dyrk1a on chromosome 21 confers a proliferation disadvantage in DS-derived fibroblasts by extending G1 length and reducing the percent of cells in S-phase. The slow proliferative phenotype we observed in DS cells is consistent with previous expression profiling studies that showed reduced expression of cell cycle dependent genes in certain brain regions of DS patients and mouse models (Contestabile et al., 2007; Hewitt et al., 2010), as well as increased doubling times in DS derived cells (Kimura et al., 2005; Segal and McCoy, 1974). Interestingly, DS-associated neuronal deficits such as reduced brain size and decreased neuronal density in specific brain regions can be readily detected in fetuses and children with DS (Becker et al., 1991). This suggests that DS pathology may originate from defects in neurogenesis during development, a process in which the transition from proliferation to neuronal differentiation is tightly controlled. Therefore, our findings, together with previous studies, indicate that an increase in Dyrk1a dosage may contribute to some of the DS-associated neurogenesis defects through its regulation of the transition from a proliferative to a terminally differentiated state. The same argument of Dyrk1a promoting cell cycle exit may also explain how an extra copy of Dyrk1a can cause a lower incidence of solid tumors in DS.
In summary, our study introduces a dosage effect by which Dyrk1a controls the relative expression of CycD1, thereby regulating the decision to either enter or exit the cell cycle. This decision relies on an intricate regulatory system based on CycD1 and p21 co-stabilization which creates three possible paths for each cell: to enter the cell cycle, to pass through a reversible quiescent state or to enter a more persistent arrested state. Finally, the Dyrk1a-mediated regulation of proliferation may provide an explanation for some of the pleiotropic proliferation and neurogenesis associated symptoms observed in DS patients.
Experimental Procedures
Cell culture, transfection, antibodies and plasmids
BJ-5ta cells were obtained from ATCC and cultured in 4 parts DMEM (Invitrogen) and 1 part Medium 199 (Invitrogen) supplemented with 10% fetal bovine serum (FBS), penicillin-streptomycin-glutamine (PSG) (Invitrogen) and 0.01 mg/ml hygromycin B (Invitrogen) between passage number 6 and 15. Human trisomy 21 skin fibroblasts (AG5397, AG6692 and AG7438) and the age-matched normal skin fibroblasts (GM5659, GM5565 and GM5658) were obtained from the Coriell Institute for Medical Research and cultured in DMEM supplemented with 10% FBS, non-essential amino acids (Invitrogen), 55mM β-mercaptoethanol (Sigma) and PSG. Primary human fibroblasts were used for experiments up to passage 10 after receipt of the cells. Synthetic siRNAs used for this study were from Dharmacon and were used at 10-20 nM with Lipofectamine 2000 reagents (Invitrogen) according to the manufacturer's protocol. Harmine (EMD Biosciences) was used at 5μM for 6-8h unless otherwise noted. Nutlin-3 and MG132 were purchased from EMD Biosciences and were used at 10 and 50μM, respectively. Etoposide (Sigma) was used at 20μM. Sources for siRNAs, antibodies, reagents, and other constructs used in this study are provided in the Supplemental Methods.
Time-lapse microscopy
Cells were reversed transfected with indicated siRNAs for 48h prior to imaging in a 96-well dish (Costar) at a density of 4,000 cells per well. For Figure 1F, Harmine was applied immediately before imaging. Time-lapse imaging was performed in full growth media supplemented with 20mM Hepes (pH 7.4) and 1mM ascorbic acid. Images were taken in CFP and RFP channels every 12 min on an ImagExpress5000A microscope (Molecular Devices) with a 10× objective. Total light exposure time was kept under 380 msec for each time point. For tet-on experiments (Figure 2 & Figure S2), images were taken in YFP channel at the end of imaging to obtain mCit-Dyrk1a intensity which remains mostly constant throughout the cell cycle. CycD1 intensity shown in Figure 2F was obtained by subsequent immunostaining and imaged in Far-Red channel following time-lapse imaging. Cells were imaged in a sealed plate at 37°C chamber.
Image Analysis
Images for the 2D signaling map experiments were analyzed using custom made MATLAB image analysis programs (Salmeen et al., 2010). Briefly, nuclear centroids were identified in images of Hoechst staining. A nucleus mask was generated for each cell by expansion from the centroid to reach 30% of maximum intensity. After local background subtraction, the nuclear p21, CycD1 and phospho-Rb Serine 807/811 mean intensity were measured. The threshold level used to determine phospho-Rb positive cells was set using a k-means clustering algorithm on a well-to-well basis. Detailed analysis related to the 2D signaling map and imaging processing of the time-lapse microscopy is described in the Supplemental Methods.
Statistical analysis
Error bars represent the standard deviation, standard error of the mean or 95% bootstrap confidence interval as indicated in the legends. Statistical comparisons (p values) were obtained from two-sided t tests. The Pearson's correlation coefficients (R) were calculated as indicated.
Supplementary Material
Highlights.
Increased Dyrk1a dosage steeply increases the duration and variability of G1 phase.
A p21-cyclin D1 signaling map specifies cell cycle entry and exit decisions.
Dosage of Dyrk1a controls the relative cyclin D1 and p21 protein levels.
Extra-dosage of Dyrk1a explains the cell cycle changes in Down syndrome cells.
Acknowledgments
We would like to thank Dr. A. Salmeen for help with image analysis. We are also grateful for M. Chung, Dr. S. Cappell and Dr. S. Spencer for comments. This work was supported by a Stanford Graduate Fellowship to JYC and FCT, a Department of Defense (Breast Cancer Research Program) Predoctoral Fellowship (W81XWH-09-1-0026) to JRL, and NIH grant MH64801 to TM.
Footnotes
Publisher's Disclaimer: This is a PDF file of an unedited manuscript that has been accepted for publication. As a service to our customers we are providing this early version of the manuscript. The manuscript will undergo copyediting, typesetting, and review of the resulting proof before it is published in its final citable form. Please note that during the production process errors may be discovered which could affect the content, and all legal disclaimers that apply to the journal pertain.
References
- Altafaj X, Dierssen M, Baamonde C, Marti E, Visa J, Guimera J, Oset M, Gonzalez JR, Florez J, Fillat C, et al. Neurodevelopmental delay, motor abnormalities and cognitive deficits in transgenic mice overexpressing Dyrk1A (minibrain), a murine model of Down's syndrome. Hum Mol Genet. 2001;10:1915–1923. doi: 10.1093/hmg/10.18.1915. [DOI] [PubMed] [Google Scholar]
- Baek KH, Zaslavsky A, Lynch RC, Britt C, Okada Y, Siarey RJ, Lensch MW, Park IH, Yoon SS, Minami T, et al. Down's syndrome suppression of tumour growth and the role of the calcineurin inhibitor DSCR1. Nature. 2009;459:1126–1130. doi: 10.1038/nature08062. [DOI] [PMC free article] [PubMed] [Google Scholar]
- Becker L, Mito T, Takashima S, Onodera K. Growth and development of the brain in Down syndrome. Prog Clin Biol Res. 1991;373:133–152. [PubMed] [Google Scholar]
- Becker W. Emerging role of DYRK family protein kinases as regulators of protein stability in cell cycle control. Cell Cycle. 2012;11:3389–3394. doi: 10.4161/cc.21404. [DOI] [PMC free article] [PubMed] [Google Scholar]
- Bornstein G, Bloom J, Sitry-Shevah D, Nakayama K, Pagano M, Hershko A. Role of the SCFSkp2 ubiquitin ligase in the degradation of p21Cip1 in S phase. J Biol Chem. 2003;278:25752–25757. doi: 10.1074/jbc.M301774200. [DOI] [PubMed] [Google Scholar]
- Burton DG, Sheerin AN, Ostler EL, Smith K, Giles PJ, Lowe J, Rhys-Williams W, Kipling DG, Faragher RG. Cyclin D1 overexpression permits the reproducible detection of senescent human vascular smooth muscle cells. Ann N Y Acad Sci. 2007;1119:20–31. doi: 10.1196/annals.1404.026. [DOI] [PubMed] [Google Scholar]
- Chen JY, Lin JR, Cimprich KA, Meyer T. A two-dimensional ERK-AKT signaling code for an NGF-triggered cell-fate decision. Mol Cell. 2012;45:196–209. doi: 10.1016/j.molcel.2011.11.023. [DOI] [PMC free article] [PubMed] [Google Scholar]
- Coleman ML, Marshall CJ, Olson MF. Ras promotes p21(Waf1/Cip1) protein stability via a cyclin D1-imposed block in proteasome-mediated degradation. EMBO J. 2003;22:2036–2046. doi: 10.1093/emboj/cdg189. [DOI] [PMC free article] [PubMed] [Google Scholar]
- Contestabile A, Fila T, Ceccarelli C, Bonasoni P, Bonapace L, Santini D, Bartesaghi R, Ciani E. Cell cycle alteration and decreased cell proliferation in the hippocampal dentate gyrus and in the neocortical germinal matrix of fetuses with Down syndrome and in Ts65Dn mice. Hippocampus. 2007;17:665–678. doi: 10.1002/hipo.20308. [DOI] [PubMed] [Google Scholar]
- Coyle JT, Oster-Granite ML, Reeves RH, Gearhart JD. Down syndrome, Alzheimer's disease and the trisomy 16 mouse. Trends Neurosci. 1988;11:390–394. doi: 10.1016/0166-2236(88)90075-6. [DOI] [PubMed] [Google Scholar]
- Demidenko ZN, Blagosklonny MV. Growth stimulation leads to cellular senescence when the cell cycle is blocked. Cell Cycle. 2008;7:3355–3361. doi: 10.4161/cc.7.21.6919. [DOI] [PubMed] [Google Scholar]
- Diehl JA, Zindy F, Sherr CJ. Inhibition of cyclin D1 phosphorylation on threonine-286 prevents its rapid degradation via the ubiquitin-proteasome pathway. Genes Dev. 1997;11:957–972. doi: 10.1101/gad.11.8.957. [DOI] [PubMed] [Google Scholar]
- Fotaki V, Dierssen M, Alcantara S, Martinez S, Marti E, Casas C, Visa J, Soriano E, Estivill X, Arbones ML. Dyrk1A haploinsufficiency affects viability and causes developmental delay and abnormal brain morphology in mice. Mol Cell Biol. 2002;22:6636–6647. doi: 10.1128/MCB.22.18.6636-6647.2002. [DOI] [PMC free article] [PubMed] [Google Scholar]
- Hasle H, Clemmensen IH, Mikkelsen M. Risks of leukaemia and solid tumours in individuals with Down's syndrome. Lancet. 2000;355:165–169. doi: 10.1016/S0140-6736(99)05264-2. [DOI] [PubMed] [Google Scholar]
- Hengst L, Gopfert U, Lashuel HA, Reed SI. Complete inhibition of Cdk/cyclin by one molecule of p21(Cip1) Genes Dev. 1998;12:3882–3888. doi: 10.1101/gad.12.24.3882. [DOI] [PMC free article] [PubMed] [Google Scholar]
- Hewitt CA, Ling KH, Merson TD, Simpson KM, Ritchie ME, King SL, Pritchard MA, Smyth GK, Thomas T, Scott HS, et al. Gene network disruptions and neurogenesis defects in the adult Ts1Cje mouse model of Down syndrome. PLoS One. 2010;5:e11561. doi: 10.1371/journal.pone.0011561. [DOI] [PMC free article] [PubMed] [Google Scholar]
- Himpel S, Panzer P, Eirmbter K, Czajkowska H, Sayed M, Packman LC, Blundell T, Kentrup H, Grotzinger J, Joost HG, et al. Identification of the autophosphorylation sites and characterization of their effects in the protein kinase DYRK1A. Biochem J. 2001;359:497–505. doi: 10.1042/0264-6021:3590497. [DOI] [PMC free article] [PubMed] [Google Scholar]
- Jimenez-Sanchez G, Childs B, Valle D. Human disease genes. Nature. 2001;409:853–855. doi: 10.1038/35057050. [DOI] [PubMed] [Google Scholar]
- Kimura M, Cao X, Skurnick J, Cody M, Soteropoulos P, Aviv A. Proliferation dynamics in cultured skin fibroblasts from Down syndrome subjects. Free Radic Biol Med. 2005;39:374–380. doi: 10.1016/j.freeradbiomed.2005.03.023. [DOI] [PubMed] [Google Scholar]
- Litovchick L, Florens LA, Swanson SK, Washburn MP, DeCaprio JA. DYRK1A protein kinase promotes quiescence and senescence through DREAM complex assembly. Genes Dev. 2011;25:801–813. doi: 10.1101/gad.2034211. [DOI] [PMC free article] [PubMed] [Google Scholar]
- Massague J. G1 cell-cycle control and cancer. Nature. 2004;432:298–306. doi: 10.1038/nature03094. [DOI] [PubMed] [Google Scholar]
- Niepel M, Spencer SL, Sorger PK. Non-genetic cell-to-cell variability and the consequences for pharmacology. Curr Opin Chem Biol. 2009;13:556–561. doi: 10.1016/j.cbpa.2009.09.015. [DOI] [PMC free article] [PubMed] [Google Scholar]
- Park J, Song WJ, Chung KC. Function and regulation of Dyrk1A: towards understanding Down syndrome. Cell Mol Life Sci. 2009;66:3235–3240. doi: 10.1007/s00018-009-0123-2. [DOI] [PMC free article] [PubMed] [Google Scholar]
- Ren S, Rollins BJ. Cyclin C/cdk3 promotes Rb-dependent G0 exit. Cell. 2004;117:239–251. doi: 10.1016/s0092-8674(04)00300-9. [DOI] [PubMed] [Google Scholar]
- Sakaue-Sawano A, Kurokawa H, Morimura T, Hanyu A, Hama H, Osawa H, Kashiwagi S, Fukami K, Miyata T, Miyoshi H, et al. Visualizing spatiotemporal dynamics of multicellular cell-cycle progression. Cell. 2008;132:487–498. doi: 10.1016/j.cell.2007.12.033. [DOI] [PubMed] [Google Scholar]
- Salmeen A, Park BO, Meyer T. The NADPH oxidases NOX4 and DUOX2 regulate cell cycle entry via a p53-dependent pathway. Oncogene. 2010;29:4473–4484. doi: 10.1038/onc.2010.200. [DOI] [PMC free article] [PubMed] [Google Scholar]
- Segal DJ, McCoy EE. Studies on Down's syndrome in tissue culture. I. Growth rates and protein contents of fibroblast cultures. J Cell Physiol. 1974;83:85–90. doi: 10.1002/jcp.1040830112. [DOI] [PubMed] [Google Scholar]
- Serrano M, Lin AW, McCurrach ME, Beach D, Lowe SW. Oncogenic ras provokes premature cell senescence associated with accumulation of p53 and p16INK4a. Cell. 1997;88:593–602. doi: 10.1016/s0092-8674(00)81902-9. [DOI] [PubMed] [Google Scholar]
- Sherr CJ. Cancer cell cycles. Science. 1996;274:1672–1677. doi: 10.1126/science.274.5293.1672. [DOI] [PubMed] [Google Scholar]
- Sherr CJ, Roberts JM. CDK inhibitors: positive and negative regulators of G1-phase progression. Genes Dev. 1999;13:1501–1512. doi: 10.1101/gad.13.12.1501. [DOI] [PubMed] [Google Scholar]
- Takahashi-Yanaga F, Mori J, Matsuzaki E, Watanabe Y, Hirata M, Miwa Y, Morimoto S, Sasaguri T. Involvement of GSK-3beta and DYRK1B in differentiation-inducing factor-3-induced phosphorylation of cyclin D1 in HeLa cells. J Biol Chem. 2006;281:38489–38497. doi: 10.1074/jbc.M605205200. [DOI] [PubMed] [Google Scholar]
- Ullmannova V, Stockbauer P, Hradcova M, Soucek J, Haskovec C. Relationship between cyclin D1 and p21(Waf1/Cip1) during differentiation of human myeloid leukemia cell lines. Leuk Res. 2003;27:1115–1123. doi: 10.1016/s0145-2126(03)00103-6. [DOI] [PubMed] [Google Scholar]
- Yan GZ, Ziff EB. NGF regulates the PC12 cell cycle machinery through specific inhibition of the Cdk kinases and induction of cyclin D1. J Neurosci. 1995;15:6200–6212. doi: 10.1523/JNEUROSCI.15-09-06200.1995. [DOI] [PMC free article] [PubMed] [Google Scholar]
- Yang Q, Rasmussen SA, Friedman JM. Mortality associated with Down's syndrome in the USA from 1983 to 1997: a population-based study. Lancet. 2002;359:1019–1025. doi: 10.1016/s0140-6736(02)08092-3. [DOI] [PubMed] [Google Scholar]
Associated Data
This section collects any data citations, data availability statements, or supplementary materials included in this article.