

Abstract
Protein concentrations are often regulated by dynamic changes in translation rates. Nevertheless, it has been challenging to directly monitor changes in translation in living cells. We have developed a reporter system to measure real-time changes of translation rates in human or mouse individual cells by conjugating translation regulatory motifs to sequences encoding a nuclear targeted fluorescent protein and a controllable destabilization domain. Application of the method showed that individual cells undergo marked fluctuations in the translation rate of mRNAs whose 5′ terminal oligopyrimidine (5′ TOP) motif regulates the synthesis of ribosomal proteins. Furthermore, we show that small reductions in amino acid levels signal through different mTOR-dependent pathways to control TOP mRNA translation, whereas larger reductions in amino acid levels control translation through eIF2A. Our study demonstrates that dynamic measurements of single-cell activities of translation regulatory motifs can be used to identify and investigate fundamental principles of translation.
Cellular concentrations of proteins are regulated by signaling mechanisms that change mRNA levels, the rate of protein degradation or the rate of protein translation. In mammalian cells, the contribution of translation control to protein abundance became increasingly appreciated with the findings that specific proteins, groups of proteins with shared translation regulatory motifs and overall protein abundance can all be regulated by translation1. Current approaches to measure translation include quantification of ribosome-bound mRNA2–6 or ratiometric analysis of cap-dependent versus cap-independent translation using bicistronic luciferase reporters7–9. Although these methods offer advantages, they cannot report dynamic changes in translation rates in single living cells. Single-cell studies of signaling and transcriptional processes have revealed fundamental dynamic regulatory mechanisms that differ between cells in the same population10–13, suggesting that single-cell analysis of translation could provide similar new fundamental insights.
Our goal was to develop and apply a reporter system to selectively monitor real-time changes in translation rates in single mammalian cells. We achieved this by conjugating translation regulatory motifs to sequences encoding a fluorescent protein and a controllable destabilizing domain14. We applied this strategy to investigate molecular mechanisms controlling dynamic changes in translation rates of mRNAs with TOP, internal ribosome entry site (IRES) or unstructured 5′ UTR motifs in single cells. As a test of the assay, we focused on signaling through the mTOR pathway and how it regulates these motifs. mTOR regulates translation in response to various environmental cues such as nutrients, stresses and growth factors15.
RESULTS
Design of a real-time translation reporter system
We first focused on the regulation of a 5′ TOP motif from elongation factor alpha 1 (EEF1A1)16. The 5′ TOP motif is defined by 5–15 consecutive pyrimidine nucleotides at the 5′ end of mRNAs17. 5′ TOP sequences are present in approximately 20% of total human mRNAs18,19; these TOP mRNAs encode components of the translational machinery20,21. The EEF1A1 promoter with the 5′ TOP motif was placed upstream of sequences encoding YFP and histone H2B to target the combined translation reporter to the nucleus and to facilitate accurate single-cell quantification (Fig. 1a). We also added a sequence for Escherichia coli dihydrofolate reductase (ecDHFR) as a controllable destabilization domain because the engineered ecDHFR has a high induction ratio once it is stabilized by its ligand trimethoprim (TMP)14. The destabilizing domain promotes the degradation of the combined fusion protein and thereby prevents its accumulation in the absence of a protective small molecule. Addition of the protective ligand stabilizes the fusion protein and initiates its translation-mediated accumulation (Fig. 1b). As a control, we confirmed a near-constant level of mRNA during the measurement period using bulk quantitative reverse-transcription PCR as well as single-cell mRNA FISH (Supplementary Fig. 1).
Figure 1.

Design of a live-cell fluorescent reporter to measure changes in translation rates. (a) Design of the translation reporter. EMCV, encephalomyocarditis virus. (b) Experimental procedure for measuring the accumulation of reporter fluorescence using parallel time-lapse imaging in multiwell plates. The relative translational activity (RTA) is defined as the percent ratio of the slopes before and after a stimulus. (c) Strategy to generate accumulation curves of nuclear TOP-H2B-YFP-DD reporter fluorescence after TMP addition. H2B-CFP (top row) is coexpressed as a nuclear marker to track cells and define a mask so that the YFP signal buildup can be accurately quantified. Each cell and the corresponding YFP accumulation curve (right) are marked by the same color and number. Scale bar, 30 μm. RFU, relative fluorescence units.
We used human foreskin fibroblasts (BJ-5ta cells) stably expressing this TOP reporter as well as a nuclear H2B-CFP marker for accurate quantification of nuclear YFP fluorescence (Fig. 1c) and automated tracking of the moving individual cells22. At a saturating concentration of TMP, individual cells built up fluorescence with an approximately linear YFP fluorescence intensity increase, though with different relative slopes (Fig. 1c and Supplementary Fig. 2a). To make sure the signal increase was not appreciably affected by degradation of the reporter, we treated cells with cycloheximide to immediately stall ribosomes and stop translation; we found only minimal reporter degradation as long as we screened out cells with high reporter levels (Supplementary Fig. 2c,d). We minimized this degradation effect by sorting for cells with moderate expression of the reporter, and we used only these cell lines for all subsequent experiments. Thus, we conclude that measured slope changes of reporter activity over short time periods can be used as a proxy for the translation rate of different regulatory sequences. We therefore refer to a measured relative slope change as relative translational activity (RTA) (Fig. 1b). As an additional validation, we confirmed that the averaged induced change in the RTA parameter was consistent with the previous results from 35S incorporation assays23 (Supplementary Fig. 2e).
Measurement of rapid changes in translation
To test whether the translation reporter system can be used to measure fast changes in translation rates, we analyzed hundreds of cells individually to quantify relative translation rate changes and response times (Tres) for the TOP reporter construct (Fig. 2). There was a lag of 19 ± 0.2 min after cycloheximide addition before slopes decreased (Fig. 2b,c). Because cycloheximide acts immediately to shut down translation, this delay reflects an inherent fixed time period required for already-synthesized YFP to become fluorescent and for the construct to translocate to the nucleus. Next we induced endoplasmic reticulum (ER) stress by adding dithiothreitol (DTT) or thapsigargin and found a small increase in the delay to translation suppression for these two drugs (22 ± 0.2 min and 25 ± 0.7 min, respectively; Fig. 2b). By subtracting the fixed 19-min delay, we conclude that it takes approximately 3 and 6 min, respectively, for these two ER stresses to cause phosphorylation of the eukaryotic initiation factor 2A (eIF2A) and inactivation of translation. We also noted that DTT addition suppressed the translation rate much more than thapsigargin addition did (Fig. 2c).
Figure 2.

Measurement of dynamic changes in translation rates using a TOP 5′ UTR reporter. (a) Changes in single-cell YFP accumulation curves in response to different translational inhibitors in cells stably expressing the TOP-H2B-YFP-DD reporter. Inhibitors: cycloheximide (CHX), 50 μg/ml; dithiothreitol (DTT), 1.5 mM; thapsigargin (TG), 500 nM; Torin2, 67 nM. Each red line represents a single cell. The blue lines are the population mean of the single-cell signals. The dashed gray lines mark the time inhibitors were added. RFU, relative fluorescence units. (b) Histogram showing the distribution of translational response times (Tres) analyzed from a. Response time is calculated by measuring the time delay from the addition of inhibitor to the change in slope (Online Methods). Mean ± s.e.m. of the response time is displayed on each graph. (c) Histogram showing the distribution of RTA analyzed from a. Mean ± s.e.m. of the RTA is displayed on each graph.
In contrast, the response time after addition of Torin2 (ref. 24), which inhibits mTOR, was much slower (Tres = 49 ± 1.0 min; Fig. 2b), possibly as a result of slow phosphate turnover on mTOR substrates. These results demonstrate that our strategy provides a useful tool to measure kinetic changes in translation rates on a time scale of minutes to hours.
Simultaneous measurement of two regulatory motifs
We next tested whether the reporter system can be used to measure the translation rate of two different regulatory motifs in the same cell, each with a different fluorescent reporter. In addition to the TOP reporter, we designed a construct with a short unstructured 5′ UTR (UnReg) to monitor nonspecific translation rates as well as a construct with an encephalomyocarditis virus25 IRES. Constitutively active CAG promoters (a combination of cytomegalovirus early enhancer element and chicken β-actin promoter) were used to express the two mRNAs. These motifs were again placed in the 5′ UTR of a core H2B-XFP-DD reporter construct. As it was previously reported that mTOR regulates TOP mRNAs translation20,23,26, we tested the change in the translation rates after mTOR inhibition using the mTOR inhibitor Torin2 in cells expressing TOP-TOP, UnReg-TOP and IRES-TOP reporter pairs (with YFP and mCherry reporters, respectively, for each pair). Consistently with TOP motifs being selectively regulated by mTOR, Torin2 reduced TOP mRNA translation but had much smaller effects on the IRES and the UnReg reporter constructs (Fig. 3a).
Figure 3.
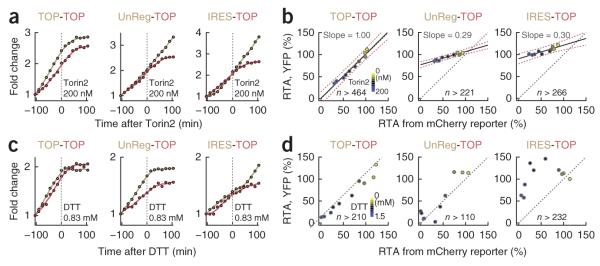
Comparison of relative activity changes of two translation motifs in the same cells. (a) Accumulation curves of two reporters before and after Torin2 addition. The color of each line closely matches the respective fluorescent protein. For instance, UnReg (beige)-TOP (red) means that UnReg-H2B-YFPDD and TOP-H2B-mCherry-DD were coexpressed in the same cells. Fluorescence intensity of each curve is normalized to its initial value. (b) Scatter plots showing mean values of RTAs averaged from large numbers of single cells (n > 221) as a function of Torin2 titration. Each filled circle marks the mean RTAs of the YFP (y axis) and the mCherry (x axis) reporters. Data from the same Torin2 concentration are displayed in the same color. Torin2 concentrations are mapped to the color bar from top to bottom, with the concentrations of 0, 6, 9, 13, 19, 30, 44, 67, 100 and 200 nM. Median values were fit by linear regression (solid black lines; slope values indicate the mean). Confidence intervals of the regression lines are marked as red dotted lines. Gray dotted lines mark a 1:1 diagonal. (c) Reporter pairs and analysis as in a but with DTT addition. (d) Scatter plots showing mean RTA values as a function of added DTT concentration. DTT concentrations in the color bar from top to bottom: 0, 0.3, 0.35, 0.45, 0.56, 0.66, 0.83, 1, 1.25 and 1.5 mM.
We then performed a sensitivity analysis of the mTOR signaling pathway by titrating Torin2 and comparing changes in translation rates between TOP and IRES or between TOP and UnReg (Supplementary Fig. 3a). Median values of the RTA from the cells at each Torin2 concentration were plotted (Fig. 3b), and regression analysis of these plots showed that the TOP-TOP pair had, as expected, a slope close to 1.00 ± 0.02 (mean ± s.e.m.), whereas the UnReg-TOP and IRES-TOP pairs had relative slopes of 0.29 ± 0.01 and 0.30 ± 0.01, respectively. This finding indicates that UnReg and IRES mRNAs are approximately 3.3 times less sensitive than TOP mRNAs to partial mTOR inhibition. These results show that our reporter system can quantitatively measure small differences in relative translation rates.
We then used ER stress induced by DTT to investigate translation rate changes of the same three regulatory motifs. Interestingly, the UnReg and the TOP mRNAs were inhibited to a similar extent by DTT addition (Fig. 3c,d and Supplementary Fig. 3b). In contrast, IRES translation showed a marked biphasic response wherein DTT treatment increased IRES translation at low concentrations but suppressed translation at high levels. The increase of IRES-mediated translation during mild stress is likely due to a combination of an increased availability of translational machinery components released from the inhibition of other mRNAs and stress-mediated induction of IRES trans-acting factors27. As demonstrated by our results, our strategy enables direct comparisons of relative changes in translation rates of two different mRNA translation regulatory motifs in the same cell.
Measuring translational fluctuations in single cells
The translation reporter system also allows for measurement of basal fluctuations in translation rates in single cells. Because cellular protein homeostasis must involve feedback mechanisms that adjust protein synthesis rates, and because 5′ TOP–mediated regulation is a primary mechanism for the control of the number of ribosomes28, it is plausible that 5′ TOP–mediated feedback regulates cell size analogously to a thermostat that turns a heater periodically on and off. If such a feedback mechanism were to exist, one might predict that translation rates of TOP-containing mRNAs fluctuate over time even under basal conditions. In contrast, unstructured regulatory motifs that are not specifically regulated would be predicted to have smaller fluctuations.
We quantified temporal variations in translation rates by measuring the relative change in translation in 2,486 and 1,456 individual cells for 5′ TOP and UnReg regulatory motifs, respectively. YFP accumulation slopes during the first hour and third hour of live-cell imaging were measured, and the ratio of these slopes (RTA) was used as a measure of the single-cell translation variation over a 2-h period. Strikingly, the translation of TOP mRNA showed a high degree of variation, which is consistent with the hypothesis that TOP mRNA translation fluctuates already during basal conditions within a given cell (Fig. 4a). As predicted by the hypothesis, the averaged translation rates of all cells remained the same during the same time interval, and the temporal variation of translation rates was much greater for the TOP reporter than for the UnReg reporter (Fig. 4a and Supplementary Fig. 4a). This was also confirmed by normalizing the coefficient of variation (CV) of YFP reporters to that of the coexpressed mCherry reporters (Fig. 4b). Therefore, our reporter system provides evidence for a translation-mediated homeostatic regulatory mechanism of TOP mRNAs.
Figure 4.

TOP mRNA translation rates fluctuate over time even in cells under basal conditions. (a) Fluctuation analysis in the basal state. Shown is a comparison of relative translation changes during a 2-h period of the UnReg- and TOP-YFP reporters in single cells. Values below and above 100% correspond to translation rates that have slowed or increased over the 2 h, respectively. (b) Bar graphs showing the coefficient of variation (CV) of the dual reporters. Left, CVs of the YFP reporters for the UnReg(YFP)-TOP(mCherry) and the TOP(YFP)-TOP(mCherry) pair; center, CVs of the mCherry reporters for the UnReg-TOP and the TOP-TOP pair; right, CVs of the YFP reporters normalized by the CVs of the mCherry reporters. Error bars, s.e.m. of ten biological replicates. (c) Immunofluorescence staining of phospho-RPS6 (purple) in single cells. Cells marked with a star (*) have lower phospho-RPS6 than the other cells. Blue, nuclear staining with Hoechst. Scale bar, 30 μm. (d) Images obtained during and after live-cell imaging. The top and center rows show the images of our live-cell reporter, whereas the bottom row is the immunofluorescence image of the same cells immediately fixed after the live-cell imaging protocol and stained for phospho (p)-RPS6 (purple). Scale bar, 30 μm. (e) Two groups of cells (left and right tails of the curve) for which p-RPS6 and p–4E-BP1 were compared. (f) Comparison of average values of p-RPS6 from the two tails of the RTA distribution of TOP reporter. Error bars, s.e.m. of ten biological replicates. RFU, relative fluorescence units. (g) The same p-RPS6 data but from the IRES reporter. (h) Comparison of the average values of p–4E-BP1 from the two tails of the RTA distribution of TOP reporter. Error bars, s.e.m. of ten biological replicates. (i) Scatter plot analysis showing the mean and the s.d. of the change in translation of an IRES reporter in response to DTT titrations. DTT concentrations in the color bar, top to bottom: 0, 0.3, 0.35, 0.45, 0.56, 0.66, 0.83, 1, 1.25 and 1.5 mM. The gray arrow represents the transition from low to high DTT concentrations. (j) Histogram of relative changes in IRES reporter activity in control-treated cells and cells treated with 0.83 mM DTT. The two samples are marked with white arrowheads in i.
Combining translation with signaling activities
To investigate the cause of the fluctuations in TOP mRNA translation, we compared the translation activity of the 5′ TOP motif to the phosphorylation state of RPS6 or 4E-BP1, two downstream targets of mTOR complex 1 (mTORC1) (ref. 29). Phosphorylation of 4E-BP1 can increase translation by derepressing the 4E-BP–mediated inhibition of eIF4E, a key translation initiation factor. Likewise, S6 kinases (S6Ks), once phosphorylated by mTORC1, are known to phosphorylate and modulate translation machinery–associated proteins, including RPS6. Interestingly, single-cell fluorescence of phospho-RPS6 was more variable across the population, whereas phospho–4E-BP1 had more similar levels across different cells (Fig. 4c and Supplementary Fig. 4b).
To test whether this RPS6 heterogeneity correlated with differential translation, we devised a protocol in which we first monitored TOP mRNA translation using live-cell imaging, immediately fixed cells and performed immunostaining for phospho-RPS6, and then matched fixed cells to the live-cell translation data (Fig. 4d and Supplementary Fig. 5). We found that there was a significantly higher level of phospho-RPS6 (P = 0.01; Fig. 4e,f) but not of phospho–4E-BP1 (P = 0.19; Fig. 4h) in cells with higher translation rates of the TOP mRNA compared with cells with low translation rate of this mRNA. This result is consistent with the interpretation that fluctuations in TOP mRNA translation correlate with fluctuations in mTOR activity. This was further supported by the observation of a smaller CV of TOP reporter in Eif4ebp1/2−/− double-knockout (DKO) murine embryonic fibroblasts (MEFs) compared to wild-type MEFs (Supplementary Fig. 4c). As a control, the IRES translation reporter was not correlated with phospho-RPS6 (Fig. 4g). These studies support a role for mTOR fluctuations in feedback regulation of TOP motifs and cell size and, more generally, show that translational rate measurements can be directly combined with signaling measurements in the same cell.
Heterogeneous responses in translation to ER stress
We also observed that the CV in the translation of the IRES reporter increased when DTT was used to induce an ER stress response (Fig. 4i). Markedly, some cells increased IRES translation rates after DTT treatment, whereas others decreased translation rates (Fig. 4i,j and Supplementary Figs. 4d and 6a). This shows that ER stress caused by the same concentration of DTT acts very differently in individual cells. The resulting variation in the response may contribute to the stochastic nature of cell survival and apoptosis27,30, processes that rely on regulatory proteins with IRES motifs in their respective mRNAs.
Using the reporter system to investigate mTOR pathways
Because it is incompletely understood how mTOR activation is linked to the upregulation of translation, we investigated how different known mTOR effectors participate in the regulation of mRNA translation29 (Fig. 5a). We used a protocol in which amino acid–starved cells were first maximally stimulated with amino acids to measure a reference translation activation, then starved again and finally stimulated again with amino acids combined with increasing concentrations of the mTOR inhibitor Torin2 (Fig. 5b). Markedly, the two mTORC1 effectors RPS6 and 4E-BP1 showed different sensitivities to increasing mTOR inhibition (Fig. 5c–e). An initial small but substantial reduction in TOP mRNA translation rates (~30%) was paralleled by a near-complete drop of phospho-RPS6 levels, whereas phospho–4E-BP1 levels remained unchanged (Fig. 5e). Higher doses of Torin2 further reduced TOP mRNA translation rates (~50–60%) and decreased phospho-4E-BP1 levels. A similar result was observed in human fibroblast Hs68 cells (Fig. 5f). This indicates that 4E-BP1 is phosphorylated at lower levels of mTORC1 signaling than RPS6 and suggests that the homeostatic ‘thermostat’ effect associated with the high variability in RPS6 phosphorylation (Fig. 4c) corresponds to small rather than large fluctuations in basal mTORC1 activity.
Figure 5.

Single-cell measurement of the relationship between the phosphorylation of translational machinery–associated proteins and TOP mRNA translation rates. (a) Schematic representation of mTORC1 translational signaling pathways. (b) Standardized protocol to normalize induced translation changes following Torin2 or amino acid stimulation. RTA is defined as a percent ratio of Δy to Δx. Torin2 or amino acids were added for the last 2 h of live-cell imaging (marked as Tx) before cells were fixed. –AA, amino acid starvation; AA, 0.5× (fold change relative to basal level) amino acid; Tx, treatment; RFU, relative fluorescence units. (c) Scatter plots showing Torin2-mediated suppression of TOP mRNA translation. Single-cell slope values Δy to Δx (from b; blue and red correspond to the respective Δy measurements in –AA and Tx conditions) are shown as a function of Torin2 titration. The data were fit by linear regression lines to determine an average slope of the scatter plots. This slope corresponds to a relative translational activity (RTA) as fraction of 1. Gray dotted lines mark a 1:1 diagonal. (d) Immunofluorescence images of phospho (p)-RPS6 and p–4E-BP1 in cells treated with different doses of Torin2. Green, antibody staining; blue, nucleus. Scale bar, 60 μm. (e,f) Correlation plots comparing TOP mRNA translation activity and phosphorylation of RPS6 and 4E-BP1 in BJ-5ta (e) and Hs68 cells (f). Each small dot marks the RTA (y axis) and phosphorylation (x axis) of RPS6 or 4E-BP1 from a single cell. Filled circles represent the median value for each concentration. Torin2 concentrations are mapped to the color bar: 0, 6, 9, 13, 19, 30, 44, 67 and 100 nM.
We directly tested for a role of S6 phosphorylation in regulating TOP mRNA translation by using wild-type and nonphosphorylatable RPS6 mutant knock-in MEFs31. Because rapamycin potently inhibited S6 phosphorylation but did not alter 4E-BP1 phosphorylation under our conditions (Supplementary Fig. 7), we used rapamycin to separate the two mTOR signaling regimens. Rapamycin reduced TOP mRNA translation equally well in both the mutant and wild-type cell lines (Supplementary Fig. 8a), a result that confirms previous findings showing that S6 phosphorylation does not contribute to the regulation of TOP mRNA translation21,31,32. To test whether the upstream S6Ks regulate translation through other substrates such as eIF4B and eEF2K, we expressed different levels of a constitutive S6K mutant in rapamycin-treated cells (Supplementary Fig. 8b–e). Whereas the constitutive S6K mutant recovered phospho-RPS6 levels in rapamycin-treated cells, the treatment failed to restore TOP mRNA translation, indicating that mTORC1 signaling to S6K does not play a major role in the short-term control of TOP mRNA translation. These results, combined with the correlation between phospho-RPS6 and the TOP reporter translation (Figs. 4f and 5e,f), suggest that another rapamycin-sensitive mTOR branch exists that has a Torin2 sensitivity similar to that of the S6K branch but is different from S6K. This elusive pathway mediates in these cells an initial 30% reduction in TOP mRNA translation for weak mTOR inhibition.
We also investigated the role of 4E-BP1 and 4E-BP2 in TOP mRNA translation by using a Eif4ebp1/2−/− DKO MEF cell line33. Cells lacking 4E-BPs with constitutive eIF4E activation reduced TOP translation by only ~20%, a result implying a substantial role for 4E-BPs in TOP mRNA regulation. However, this also suggests that another non–4E-BP and non-S6K mTOR pathway weakly regulates TOP mRNA translation for small mTORC1 activity changes (Fig. 6a). 4E-BPs also contributed a small effect on unstructured mRNA translation following strong mTOR inhibition (Fig. 6b).
Figure 6.

Distinct signaling pathways regulate the translation of mRNAs with TOP motifs. (a,b) Correlation plots between translation and phospho (p)-RPS6 on the wild type (WT) and the Eif4ebp1/2−/− double knockout (DKO) MEFs as a function of Torin2 titration with the TOP reporter (a) and UnReg reporter (b). Torin2 concentrations are coded by color: 0, 6, 9, 13, 19, 30, 44, 67 and 100 nM. The gray line marks the 100% RTA value. RFU, relative fluorescence units. (c,d) The same correlation plots for amino acid titrations with the TOP reporter (c) and UnReg reporter (d). Amino acid concentrations are coded by color (fold change relative to basal level): 0.5, 0.1, 0.02, 0.01, 0.005, 0.0025 and 0. The gray lines mark the 50% RTA value. (e) Fold changes of p-eIF2A immunofluorescence staining upon amino acid starvation (–AA) and thapsigargin (TG, 500 nM) treatment compared to vehicle (Veh) treated samples. Error bars, s.e.m. of biological triplicates. n.s., not significant. (f) Cells stably expressing heterogeneous amounts of RagA-GTP and RagC-GDP mutants were deprived of amino acids, and their translation rates and p-RPS6 levels were measured. Cells were tracked by Hoechst staining. Changes in translation rates after –AA were monitored using the TOP-H2B-YFP-DD reporter. Cells were then fixed and stained for p-RPS6. Levels of the RagA and the RagC mutants were estimated by the relative expression of H2B-CFP and H2B-mCherry driven by IRES on each mutant construct. (g,h) Heat map analysis of mTORC1 activity and TOP mRNA translation in the cells stably expressing constitutively active RagA and RagC mutants. Cells were binned according to their relative RagA and RagC expression levels (log2), and the mean of p-RPS6 (log2; p-S6) and RTA (%) was calculated for each bin.
Translational control during amino acid starvation
mTOR signaling is not only controlled by growth factor signaling but also directly regulated by the availability of amino acids. Titrating the dose of amino acids had a similar relative dependence on TOP mRNA translation and the phosphorylation of 4E-BP1 and RPS6 as titrating the dose of the mTOR inhibitor Torin2 (Supplementary Fig. 9). Nevertheless, we found that starving Eif4ebp1/2−/− DKO MEFs of amino acids still resulted in a suppression of TOP mRNA translation (Fig. 6c). As GCN2 is an alternative pathway that phosphorylates eIF2A when it senses uncharged tRNAs (generated when amino acid concentration is low), we compared phospho-eIF2A in wild type versus Eif4ebp1/2−/− DKO MEFs. Interestingly, the absence of 4E-BP resulted in a significant increase of phospho-eIF2A during amino acid starvation (P < 0.001; Fig. 6e) in only the DKO cells, suggesting that the loss of 4E-BP sensitizes cells to translational suppression through the mTOR-independent eIF2A pathway. This provides an explanation for the observed amino acid deprivation–induced strong inhibition of TOP mRNA translation as well as a relatively stronger inhibition of UnReg mRNA translation in the DKO cells compared to in wild-type cells (Fig. 6c,d).
Rag GTPase heterodimer cannot rescue translation
Amino acid signals are known to recruit and activate mTORC1 by activating a lysosomal Rag heterodimer. We therefore directly tested whether mTORC1 activation is sufficient to restore TOP mRNA translation in amino acid–starved cells by heterogeneously expressing constitutively active RagAGTP-RagCGDP, which renders mTORC1 insensitive to amino acid starvation (Fig. 6f). In amino acid–starved cells, sufficient RagCGDP and RagAGTP expression fully rescued mTORC1 activity (Fig. 6g), whereas translation rates monitored in these same cells only partially recovered (Fig. 6h). This provides an additional argument that amino acid signaling to regulate TOP translation requires both mTORC1 signaling and an inactive GCN2-eIF2A pathway. On a technical note, our analysis allowed us to simultaneously determine in the same cell the effect of different levels of expression of the two activators on the translation of a specific mRNA reporter.
DISCUSSION
Our translation reporter system adds a useful experimental tool set for uncovering dynamic and quantitative regulatory principles in translational control and for studying molecular translation regulatory mechanisms. The method we developed has three unique features. First, it enables sensitive measurements of translation rate changes of a particular translation regulatory motif in an individual cell. Second, we show that we can perform single-cell analysis of two different translation regulatory motifs in the same cell. Third, the method can be used for parallel, automated single-cell translation measurements in a multiwell format, with thousands of single cells analyzed over time in a single experiment.
Our dynamic single-cell translation analysis of the 5′ TOP motif showed for the first time, to our knowledge, fluctuations in single-cell translation rates even in unstimulated cells. The specific fluctuations in the translation of TOP mRNAs may reflect the need of cells to continuously adjust ribosome concentration to compensate for internal and external perturbations.
Our study also shows that the translation of TOP mRNAs is regulated by at least three distinct pathways, each of which has different sensitivity toward amino acid deprivation. In the first level of control, a small decrease of translation occurs selectively for weak inhibition of mTORC1, which is mediated neither by 4E-BPs nor by S6K. By exclusion, this may point to a role of eIF4G, another branch of the mTORC1 pathway that shows a matching dose-response curve (Supplementary Fig. 7a). Second, a much larger effect on TOP translation is mediated by stronger mTORC1 inhibition that suppresses 4E-BP phosphorylation, suggesting a role of 4E-BP. Last, we found an effect selectively in Eif4ebp1/2−/− DKOs: a further drop of amino acids caused a GCN2-mediated phosphorylation of eIF2A known to inhibit general translation34. To explain these results, we propose a sequential model of amino acid–mediated translational control (Supplementary Fig. 10). As the nutrient stress increases, cells sequentially engage a rapamycin-sensitive non–4E-BP mTOR pathway followed by the 4E-BP mTOR pathway to increasingly suppress TOP translation. They ultimately engage the GCN2-eIF2A pathway to suppress general translation.
Although our experiments focused on only three types of regulatory motifs—5′ TOP, IRES and UnReg—the integration of automated 96-well microscopy, automated tracking and translation rate analysis allows this reporter strategy to be expanded to analyze multiple motifs in parallel. Given the large number of translation regulatory elements being identified in genome-wide RNA-protein interaction studies35–37, our reporter system provides a complement to global methods for measuring translation control, particularly for dynamic processes such as cell signaling. Additionally, when combined with single-cell RNA FISH to count the number of mRNA in each cell, our reporter system can also be used to determine absolute translation strengths of different regulatory motifs (Supplementary Fig. 11).
ONLINE METHODS
Materials
Compounds and reagents were obtained from the following sources: rapamycin and Torin2 from Tocris Bioscience; cycloheximide and trimethoprim from Sigma; dithiothreitol and thapsigargin from Life Technologies; antibodies to phospho-Ser240,244 RPS6, phospho-Thr37,46 4E-BP1, phospho-Ser1108 eIF4G and phospho-Thr56 eEF2 from Cell Signaling Technology (cat. nos. 5364, 2855, 2441 and 2331); Alexa Fluor 594 and 647 goat anti-rabbit IgG from Life Technologies; DMEM, DPBS, penicillin-streptomycin-glutamine (100×) solution, MEM amino acid solution (50×), MEM non-essential amino acid solution (100×), heat-inactivated FBS and dialyzed FBS from Life Technologies; and Hs68 and BJ-5ta from ATCC. Eif4ebp1/2+/+; Trp53−/− MEFs and Eif4ebp1/2−/−; Trp53−/− MEFs were provided by N.S. Rps6p+/+; Trp53−/− MEFs, Rps6p−/−; Trp53−/− MEFs were provided by O.M.
Design of the reporters
YFP-DD was cloned from pBMN HAYFP-DHFR R12H N18T A19V G67S-IRES-HcRed-tandem vector provided by T. Wandless, using primers 5′-GCGGATCCAGTGAGCAAGGGCGAGGAGCTGTTC and 5′-ATGCGGCCGCTCATCGCCGCTCCAGAATCTCAAAGC (http://wandless.stanford.edu/pdfs/C-term%20DD.pdf). For the design of the [TOP]-H2B-YFPDD reporter, H2B-YFP-DD was inserted into CSII-EF-MCS vector, a lentiviral vector with EEF1A1 promoter. EEF1A1 promoter produced TOP mRNAs that start with the following sequence: 5′-CTTTTTCGCAACGGGTTTGCCGCCAGAACACAGGTGTCGTGA. To make the UnReg reporter, we cut out the CAG promoter from pCAGEN vector (Addgene: #11160), assembled with H2B-YFP-DD on pENTR1A vector (Addgene: #17398), and a Gateway LR reaction was performed to transfer CAG-H2B-YFPDD to pLenti X1 Puro DEST vector (Addgene: #17297). The CAG promoter produced mRNAs that start with the following unstructured 5′ UTR sequence: 5′-GGGAGTCGCTGCGTTGCCTTCGCCCCGTGCCCCGCTCCGCGCCGCCTCGCGCCGCCCGCCCCGGCTCTGACTGACCGCGTTACTCCCACAGCTCCTGGGCAACGTGCTGGTTATTGTGCTGTCTCATCATTTTGGCAAA. EMCV IRES was also cloned from the pBMN-YFP-DHFR vector using primers 5′-CCTCGAGGGTGACACTATAGAAGTCGACGGATCCC and 5′-GCCTCGAGACCATGTACCCATACGATGTTCCAGATTACGCT, inserted into the 5′ UTR of the UnReg reporter on pENTR1A and subsequently transferred to pLenti-X1-Puro DEST using a Gateway LR reaction. mCherry versions of the reporters were made by replacing YFP with mCherry.
Cell culture and establishment of stable cell lines
The BJ-5ta cells were cultured in a 4:1 mixture of DMEM and Medium-199 supplemented with 10% FBS, 2 mM glutamine, 100 U/ml penicillin and 100 μg/ml streptomycin. Hs68 and the MEFs cell were cultured in DMEM with the same supplements. To establish cell lines stably expressing the reporters, lentivirus with the reporter genes were produced from HEK 293T using the third-generation packaging system (Addgene: #12251, #12253 and #12259). Viral supernatants harvested 48 h post-transfection were filtered and then concentrated by 100-kDa-cutoff ultrafiltration. Target cells were incubated in their normal growth medium, supplemented with the concentrated virus and 8 μg/ml Polybrene for 12 h, and were cultured in fresh medium for another 48 h. Once the cells were expanded through several passages, they were treated overnight with 10 μM TMP to let the YFP-DD reporter accumulate. The next day, cells were removed from the plate with trypsin and were resuspended in L-15 medium supplemented with 10% FBS before sorting. Cells expressing the moderate expression level of reporter were subsequently collected by FACS at the Stanford Shared FACS Facility, expanded for another several passages and assayed as described.
Time-lapse live-cell imaging
5,000–10,000 cells were plated on each well of a 96-well flat clear-bottom plate (Corning: cat. # 3904) 2 d before imaging. 18 h later, cells were serum starved for 24 h to quiescent states to minimize cell-cycle effects on translational control. (This step can be omitted if cell cycle–related translational regulation is the area of research.) For the next 6 h, cells were incubated with imaging medium, whose composition was as follows: DBPS supplemented with 0.9 mM calcium, 0.49 mM magnesium, 1 g/L glucose, 0.33 mM pyruvate, 2 mM glutamine, 100 U/ml penicillin, 100 μg/ml streptomycin, 1× MEM amino acid solution, 1× MEM non-essential amino acid solution and 1% dialyzed FBS. The medium was adjusted to pH 7.3 with 1 M sodium hydroxide. Then the cells in the imaging medium were loaded on an inverted epifluorescence microscope (ImageXpress Micro, Molecular Devices), which was equipped with temperature and humidity control for time-lapse imaging. Fluorescence images were taken at multiple sites within each well at certain intervals (kinetics measurement in Fig. 2: every 2 min; the rest of the experiments: every 15 min or 20 min) over the total imaging time. In a typical experiment we monitored cells using a 10× objective and 2 × 2 binning. We added TMP and translational inhibitors during imaging by manually stopping image acquisition, adding the chemicals and restarting the acquisition protocol. For nutrient starvation experiments, cells were washed three times with imaging medium lacking the nutrients.
Chemical and nutrient titration
Dithiothreitol was titrated in distilled water, and cycloheximide and Torin2 were titrated in DMSO. These diluted chemicals were then added to cells being imaged on the microscope. 1× nutrient concentration in the experiments was defined as the concentration of the nutrient in the imaging medium described above. To titrate down nutrient concentrations, we serially diluted the imaging medium with imaging medium lacking the nutrient and added it to the cells that had been deprived of the nutrient for at least 2 h.
Immunofluorescence staining post–live-cell imaging
After live-cell imaging, cells were immediately fixed with 4% paraformaldehyde in PBS for 15 min at room temperature and washed three times with PBS. Cells were subsequently permeabilized with 0.2% Triton X-100 in PBS for 15 m at 4 °C and blocked with 3% bovine serum albumin (BSA) in PBS for 1 h at room temperature. Primary antibodies were diluted in 3% BSA in PBS (phospho-RPS6 antibody, 1:500 dilution; the rest of the antibodies were used at 1:250 dilution) and added to the cells for overnight incubation at 4 °C. The next day, cells were washed three times with PBS, and secondary antibodies diluted in 3% BSA in PBS (1:1,000 dilution) were added for another 2 h at room temperature. For an experiment where cells expressed only CFP and YFP, Alexa Fluor 594 anti-rabbit IgG was used as the secondary antibody, and the cells, after a triple wash with PBS, were subsequently imaged in the Texas red channel. For cells expressing CFP, YFP and mCherry, Alexa Fluor 647 anti-rabbit IgG was used as the secondary antibody, and the cells were imaged in the Cy5 channel. A schematic of the process is depicted in Supplementary Figure 5.
Single-cell tracking, quantification of reporter signal and generation of correlation plots
Cells were tracked using a custom Matlab script such that the cells were first marked by primary masks defined by nucleus markers and then were linked in consecutive time frames according to the minimum Euclidean distance between objects. The primary mask for the nucleus was defined using either H2B-CFP or Hoechst nuclear marker, depending on the availability of channels in each experiment. For quantifying reporter signals in nuclei, background signals were first subtracted using a local background-subtraction method, and reporter signals were calculated by integrating the fluorescence intensities within the primary masks. When the primary masks on each frame were linked by the tracking script, the intensity values of the reporter signals were also passed along the linkage to construct the accumulation curves. Intensities of immunofluorescence antibody staining performed post–live-cell imaging were measured in cytoplasmic regions. These values were connected to the RTA values in the same cells using the same tracking script we used to make the correlation plots.
Calculation of translational activities (RTA) and slope analysis
We calculated a slope value by fitting data points to a line using the robust regression function in Matlab (http://www.mathworks.com/help/stats/robustfit.html). Relative translational activity (RTA) for a certain stimulus was defined as a percent ratio of the slope after the treatment to the slope before the treatment. Cells with too low reporter expression (generally below ~300% background level in the last frame of movie) were removed from the analysis to minimize noise during the ratio calculation. If a slope was still changing at the time of treatment, RTA of a stimulus was renormalized to the RTA of a control treatment so that the RTA of the control became 100%. When cells were treated with titrated amounts of chemical inhibitors or nutrients for 2 h, RTAs were calculated from the slopes during the last 1 h of the treatments. Response times of translation to the chemical inhibitors were calculated from the time differences between treatments and onsets of slope changes. We estimated the onsets of the slope changes by fitting whole data points to two discrete lines. The onsets were then defined as the intersection of the two lines.
RNA FISH and quantification of mRNA amount per cell
RNA in situ hybridization was carried out using the Affymetrix Quantigene ViewRNA ISH cell assay. A probe was custom designed to target the engineered ecDHFR sequence in the reporters. Briefly, cells in a 96-well glass plate (Greiner) were fixed with 4% paraformaldehyde for 15 min and dehydrated overnight using 75% EtOH. After rehydration in PBS for 10 min, the cells were permeabilized with detergent solution for 5 min and then treated with Proteinase K for 15 min at RT. The probes were then diluted 1:25 with hybridization buffer and incubated at 40 °C for 3 h. Cells were then hybridized with the three different probes in succession: preamplification probe, amplification probe and label probe. Cells were washed three times with washing buffer between each hybridization step, and all hybridizations were performed by incubating cells with a probe for 30 min at 40 °C. Finally, cells were incubated with Hoechst (1:10,000 in PBS) for 5 min, washed three times with PBS and left in PBS for imaging. Image analysis was carried out using a custom-written Matlab script. Briefly, images were subjected to background subtraction followed by a log (Laplacian of Gaussian) filter designed to identify single foci. The images were subsequently passed through a predetermined threshold to identify all foci originating from RNA molecules. Next, each focus was associated with the closest nucleus (as identified by Hoechst staining) to measure the total mRNA levels of individual cells. RNA molecules that were too far away from any cell less than ~60 μm) were disqualified from further analysis. Finally, as the mRNAs produced by the constitutive promoter were highly abundant, we quantified the total amount of mRNA by summing the intensities of all identified puncta to account for foci that were created from two (or more) proximate molecules.
Estimating the response time of translation
The response time of translation to a certain stimulus was defined as the time difference between addition of the stimulus and the onset of slope change. YFP accumulation data were fit to two linear regression lines using the regress2lines Matlab function obtained from the online resource http://staff.washington.edu/aganse/mpregression/mpregression.html. The onset of slope changes was defined by the intersection of these two lines.
Measuring correlations between the phosphorylations of translation factors and RTA at the single-cell level
To generate the correlation plots between RTA (relative translational activity) and the phosphorylation levels of translation factors, we first measured the RTA of single cells with the reporter in a live-cell imaging protocol. Cells were immediately fixed, permeabilized and immunostained with a phospho-antibody of interest, typically followed by an Alexa Fluor 594 secondary antibody (1:1,000 dilution). Before the cells were reimaged, x and y coordinates for the plate were manually adjusted to match the positions of the individual cells from the last frame of the live-cell imaging protocol. After the immunofluorescence images were acquired, the intensities of antibody staining were quantified in the cytoplasmic regions of cells defined by rings around the nucleus markers (width of the ring: ~3.5 μm). Using the tracking algorithm based on minimum Euclidean distance, we linked the immunofluorescence intensities of the individual cells to the RTA quantified previously from the live-cell imaging. In this way, RTA of cells can be connected to other sources of cellular information: for example, immunofluorescence measurements.
Measuring intrinsic efficiency of mRNA regulatory motifs
To measure the intrinsic efficiency of mRNA regulatory motifs, we generated correlation plots between the slopes of YFP accumulation and the measured copy number of mRNA in the same cells. The YFP slope of single cells (RFU/h) was first measured using the reporter in a live-cell imaging protocol. Cells were immediately fixed, and RNA FISH was performed on the same cells using the method described previously to measure single-cell mRNA levels (RFU). Scatter plots comparing the slope of YFP to the level of mRNA in each cell were generated, and linear regression on these scatter plots provides numeric values: estimates for the relative efficiency of the regulatory motifs. To make the hairpin construct, we added the following sequence (estimated free energy from RNAfold Web server: −46.45 kcal/mol) within the 5′ UTR of the reporter: 5′-GGCGACGTCCACCACGGCCGATATCACGGCCGTGGTGGACGTCGCC-3′.
Analysis of translational control in heterogeneous populations
To dissect the roles of signaling pathways in translational control, we expressed the constitutive (CA) S6K mutant or the RagAGTP-RagCGDP mutant pair in cells. The RTA of these cells was subsequently measured in heterogeneous populations to characterize the effect of the mutants on translation rates. In the case of the CA S6K experiment (Supplementary Fig. 8), we synthesized a lentiviral construct that contains the CA S6K followed by IRES-H2B-mCherry so that we were able to measure the amount of CA S6K from the cellular H2B-mCherry intensity level. We virally transduced this construct into cells expressing the translation reporter. Once RTAs were measured in the cells, they were immediately fixed and stained with a phospho-RPS6 antibody. Alexa Fluor 647 secondary antibody was used for the immunofluorescence staining. The cells were imaged using mCherry and far-red band-pass fluorescence channels, and the levels of CA S6K and phospho-RPS6 were quantified by measuring the respective intensities per cell. To test the effect of CA S6K on both phospho-RPS6 and translation, we binned cells by their mCherry intensities and the means of their RTAs, and phospho-RPS6 levels were calculated in each bin. For the RagAGTP-RagCGDP experiment (Fig. 6f–h), two lentiviral constructs were made: RagAGTP-IRES-H2B-CFP and RagCGDP-H2B-mCherry. These two constructs were transduced into cells expressing the YFP translation reporter. Hoechst staining was used as a nuclear marker in this experiment. RTAs were measured in these cells, and cells were fixed and stained with phospho-RPS6 antibody and an Alexa Fluor 647 secondary antibody. The cells were binned in the CFP (RagAGTP, y axis) and mCherry (RagCGDP, x axis) channels to generate a two-dimensional plot. At the same time, the mean of the RTA and of phospho-RPS6 were calculated on each grid point of the array, and the values were visualized using a heat map in order to analyze the combinatorial effect of RagAGTP-RagCGDP expression either on RTA or on phospho-RPS6.
Statistical analysis
The statistical significance (P value) used to compare the averages of two different samples was determined using unpaired, two-tailed Student’s t-test implemented in Microsoft Excel.
Supplementary Material
ACKNOWLEDGMENTS
We thank F.-C. Tsai, a former graduate student of the Meyer lab, for the original Matlab code that was modified and used here to track single cells in the movies. The tunable ecDHFR plasmid was provided by T. Wandless (Stanford University). K.H. was supported by Stanford Graduate Fellowship. The work was supported by US National Institutes of Health grant GM030179.
Footnotes
Note: Any Supplementary Information and Source Data files are available in the online version of the paper.
AUTHOR CONTRIBUTIONS K.H. designed the reporter and the experiments, performed the experiments and analyzed the data. A.J. performed RNA FISH and provided the Matlab script to analyze the RNA FISH data. G.D. contributed to the development of the reporter. N.S. and O.M. provided MEFs. K.H. and T.M. interpreted the results and wrote the manuscript. All authors discussed the results and the manuscript. T.M. supervised the study.
COMPETING FINANCIAL INTERESTS The authors declare no competing financial interests.
Reprints and permissions information is available online at http://www.nature.com/reprints/index.html.
References
- 1.Schwanhäusser B, et al. Global quantification of mammalian gene expression control. Nature. 2011;473:337–342. doi: 10.1038/nature10098. [DOI] [PubMed] [Google Scholar]
- 2.Zong Q, Schummer M, Hood L, Morris DR. Messenger RNA translation state: the second dimension of high-throughput expression screening. Proc. Natl. Acad. Sci. USA. 1999;96:10632–10636. doi: 10.1073/pnas.96.19.10632. [DOI] [PMC free article] [PubMed] [Google Scholar]
- 3.Johannes G, Carter MS, Eisen MB, Brown PO, Sarnow P. Identification of eukaryotic mRNAs that are translated at reduced cap binding complex eIF4F concentrations using a cDNA microarray. Proc. Natl. Acad. Sci. USA. 1999;96:13118–13123. doi: 10.1073/pnas.96.23.13118. [DOI] [PMC free article] [PubMed] [Google Scholar]
- 4.Kuhn KM, Derisi JL, Brown PO, Sarnow P. Global and specific translational regulation in the genomic response of Saccharomyces cerevisiae to a rapid transfer from a fermentable to a nonfermentable carbon source. Mol. Cell. Biol. 2001;21:916–927. doi: 10.1128/MCB.21.3.916-927.2001. [DOI] [PMC free article] [PubMed] [Google Scholar]
- 5.Arava Y, et al. Genome-wide analysis of mRNA translation profiles in Saccharomyces cerevisiae. Proc. Natl. Acad. Sci. USA. 2003;100:3889–3894. doi: 10.1073/pnas.0635171100. [DOI] [PMC free article] [PubMed] [Google Scholar]
- 6.Ingolia NT, Ghaemmaghami S, Newman JRS, Weissman JS. Genome-wide analysis in vivo of translation with nucleotide resolution using ribosome profiling. Science. 2009;324:218–223. doi: 10.1126/science.1168978. [DOI] [PMC free article] [PubMed] [Google Scholar]
- 7.Roux PP, et al. RAS/ERK signaling promotes site-specific ribosomal protein S6 phosphorylation via RSK and stimulates cap-dependent translation. J. Biol. Chem. 2007;282:14056–14064. doi: 10.1074/jbc.M700906200. [DOI] [PMC free article] [PubMed] [Google Scholar]
- 8.Choo AY, Yoon S-O, Kim SG, Roux PP, Blenis J. Rapamycin differentially inhibits S6Ks and 4E-BP1 to mediate cell-type-specific repression of mRNA translation. Proc. Natl. Acad. Sci. USA. 2008;105:17414–17419. doi: 10.1073/pnas.0809136105. [DOI] [PMC free article] [PubMed] [Google Scholar]
- 9.Braunstein S, et al. A hypoxia-controlled cap-dependent to cap-independent translation switch in breast cancer. Mol. Cell. 2007;28:501–512. doi: 10.1016/j.molcel.2007.10.019. [DOI] [PubMed] [Google Scholar]
- 10.Elowitz MB, Levine AJ, Siggia ED, Swain PS. Stochastic gene expression in a single cell. Science. 2002;297:1183–1186. doi: 10.1126/science.1070919. [DOI] [PubMed] [Google Scholar]
- 11.Mukherji S, et al. MicroRNAs can generate thresholds in target gene expression. Nat. Genet. 2011;43:854–859. doi: 10.1038/ng.905. [DOI] [PMC free article] [PubMed] [Google Scholar]
- 12.Nelson DE, et al. Oscillations in NF-κB signaling control the dynamics of gene expression. Science. 2004;306:704–708. doi: 10.1126/science.1099962. [DOI] [PubMed] [Google Scholar]
- 13.Tay S, et al. Single-cell NF-κB dynamics reveal digital activation and analogue information processing. Nature. 2010;466:267–271. doi: 10.1038/nature09145. [DOI] [PMC free article] [PubMed] [Google Scholar]
- 14.Iwamoto M, Björklund T, Lundberg C, Kirik D, Wandless TJ. A general chemical method to regulate protein stability in the mammalian central nervous system. Chem. Biol. 2010;17:981–988. doi: 10.1016/j.chembiol.2010.07.009. [DOI] [PMC free article] [PubMed] [Google Scholar]
- 15.Appenzeller-Herzog C, Hall MN. Bidirectional crosstalk between endoplasmic reticulum stress and mTOR signaling. Trends Cell Biol. 2012;22:274–282. doi: 10.1016/j.tcb.2012.02.006. [DOI] [PubMed] [Google Scholar]
- 16.Uetsuki T, Naito A, Nagata S, Kaziro Y. Isolation and characterization of the human chromosomal gene for polypeptide chain elongation factor- lα. J. Biol. Chem. 1989;264:5791–5798. [PubMed] [Google Scholar]
- 17.Levy S, Avni D, Hariharan N, Perry RP, Meyuhas O. Oligopyrimidine tract at the 5′ end of mammalian ribosomal protein mRNAs is required for their translational control. Proc. Natl. Acad. Sci. USA. 1991;88:3319–3323. doi: 10.1073/pnas.88.8.3319. [DOI] [PMC free article] [PubMed] [Google Scholar]
- 18.Geyer PK, Meyuhas O, Perry RP, Johnson LF. Regulation of ribosomal protein mRNA content and translation in growth-stimulated mouse fibroblasts. Mol. Cell. Biol. 1982;2:685–693. doi: 10.1128/mcb.2.6.685. [DOI] [PMC free article] [PubMed] [Google Scholar]
- 19.Caldarola S, Amaldi F, Proud CG, Loreni F. Translational regulation of terminal oligopyrimidine mRNAs induced by serum and amino acids involves distinct signaling events. J. Biol. Chem. 2004;279:13522–13531. doi: 10.1074/jbc.M310574200. [DOI] [PubMed] [Google Scholar]
- 20.Meyuhas O. Synthesis of the translational apparatus is regulated at the translational level. Eur. J. Biochem. 2000;267:6321–6330. doi: 10.1046/j.1432-1327.2000.01719.x. [DOI] [PubMed] [Google Scholar]
- 21.Tang H, et al. Amino acid-induced translation of TOP mRNAs is fully dependent on phosphatidylinositol 3-kinase-mediated signaling, is partially inhibited by rapamycin, and is independent of S6K1 and rpS6 phosphorylation. Mol. Cell. Biol. 2001;21:8671–8683. doi: 10.1128/MCB.21.24.8671-8683.2001. [DOI] [PMC free article] [PubMed] [Google Scholar]
- 22.Kurokawa H, et al. Software for precise tracking of cell proliferation. Biochem. Biophys. Res. Commun. 2012;417:1080–1085. doi: 10.1016/j.bbrc.2011.12.100. [DOI] [PubMed] [Google Scholar]
- 23.Thoreen CC, et al. A unifying model for mTORC1-mediated regulation of mRNA translation. Nature. 2012;485:109–113. doi: 10.1038/nature11083. [DOI] [PMC free article] [PubMed] [Google Scholar]
- 24.Liu Q, et al. Discovery of 9-(6-aminopyridin-3-yl)-1-(3-(trifluoromethyl)ph enyl)benzo[h][1,6]naphthyridin-2(1H)-one (Torin2) as a potent, selective, and orally available mammalian target of rapamycin (mTOR) inhibitor for treatment of cancer. J. Med. Chem. 2011;54:1473–1480. doi: 10.1021/jm101520v. [DOI] [PMC free article] [PubMed] [Google Scholar]
- 25.Jang SK, Wimmer E. Cap-independent translation of encephalomyocarditis virus RNA: structural elements of the internal ribosomal entry site and involvement of a cellular 57-kD RNA-binding protein. Genes Dev. 1990;4:1560–1572. doi: 10.1101/gad.4.9.1560. [DOI] [PubMed] [Google Scholar]
- 26.Hsieh AC, et al. The translational landscape of mTOR signalling steers cancer initiation and metastasis. Nature. 2012;485:55–61. doi: 10.1038/nature10912. [DOI] [PMC free article] [PubMed] [Google Scholar]
- 27.Holcik M, Sonenberg N. Translational control in stress and apoptosis. Nat. Rev. Mol. Cell Biol. 2005;6:318–327. doi: 10.1038/nrm1618. [DOI] [PubMed] [Google Scholar]
- 28.Ruvinsky I, Meyuhas O. Ribosomal protein S6 phosphorylation: from protein synthesis to cell size. Trends Biochem. Sci. 2006;31:342–348. doi: 10.1016/j.tibs.2006.04.003. [DOI] [PubMed] [Google Scholar]
- 29.Ma XM, Blenis J. Molecular mechanisms of mTOR-mediated translational control. Nat. Rev. Mol. Cell Biol. 2009;10:307–318. doi: 10.1038/nrm2672. [DOI] [PubMed] [Google Scholar]
- 30.Holcik M, Sonenberg N, Korneluk RG. Internal ribosome initiation of translation and the control of cell death. Trends Genet. 2000;16:469–473. doi: 10.1016/s0168-9525(00)02106-5. [DOI] [PubMed] [Google Scholar]
- 31.Ruvinsky I, et al. Ribosomal protein S6 phosphorylation is a determinant of cell size and glucose homeostasis. Genes Dev. 2005;19:2199–2211. doi: 10.1101/gad.351605. [DOI] [PMC free article] [PubMed] [Google Scholar]
- 32.Meyuhas O, Dreazen A. Ribosomal protein S6 kinase from TOP mRNAs to cell size. Prog. Mol. Biol. Transl. Sci. 2009;90:109–153. doi: 10.1016/S1877-1173(09)90003-5. [DOI] [PubMed] [Google Scholar]
- 33.Le Bacquer O, et al. Elevated sensitivity to diet-induced obesity and insulin resistance in mice lacking 4E-BP1 and 4E-BP2. J. Clin. Invest. 2007;117:387–396. doi: 10.1172/JCI29528. [DOI] [PMC free article] [PubMed] [Google Scholar]
- 34.Damgaard CK, Lykke-Andersen J. Translational coregulation of 5′TOP mRNAs by TIA-1 and TIAR. Genes Dev. 2011;25:2057–2068. doi: 10.1101/gad.17355911. [DOI] [PMC free article] [PubMed] [Google Scholar]
- 35.Hafner M, et al. Transcriptome-wide identification of RNA-binding protein and microRNA target sites by PAR-CLIP. Cell. 2010;141:129–141. doi: 10.1016/j.cell.2010.03.009. [DOI] [PMC free article] [PubMed] [Google Scholar]
- 36.Ule J, et al. CLIP identifies Nova-regulated RNA networks in the brain. Science. 2003;302:1212–1215. doi: 10.1126/science.1090095. [DOI] [PubMed] [Google Scholar]
- 37.Kishore S, et al. A quantitative analysis of CLIP methods for identifying binding sites of RNA-binding proteins. Nat. Methods. 2011;8:559–564. doi: 10.1038/nmeth.1608. [DOI] [PubMed] [Google Scholar]
Associated Data
This section collects any data citations, data availability statements, or supplementary materials included in this article.