

Abstract
SEM1(86–107) is a 22-residue peptide corresponding to residues 86–107 in the semenogelin I protein. SEM1(86–107) is an abundant component of freshly liquefied semen and forms amyloid fibrils capable of enhancing HIV infection. To probe the factors affecting fibril formation and gain a better understanding of how differences in pH between semen and vaginal fluid affect fibril stability, this study determined the effect of pH on SEM1(86–107) fibril formation and dissociation. The SEM1(86–107) fibril structure (i.e., residues that comprise the fibrillar core) was also probed using hydrogen–deuterium exchange mass spectrometry (HDXMS) and hydroxyl radical-mediated protein modification. The average percent exposure to hydroxyl radical-mediated modification in the SEM1(86–107) fibrils was determined without requiring tandem mass spectrometry spectral acquisition or complete separation of modified peptides. It was found that the residue exposures calculated from HDXMS and hydroxyl radical-mediated modification were similar. These techniques demonstrated that three regions of SEM1(86–107) comprise the amyloid fibril core and that positively charged residues are exposed, suggesting that electrostatic interactions between SEM1(86–107) and HIV or the cell surface may be responsible for mediating HIV infection enhancement by the SEM1(86–107) fibrils.
It has been shown that semen gelation and liquefaction following ejaculation are important processes in mammalian reproduction.1−3 Immediately following ejaculation, semen becomes highly viscous and forms a semisolid gelatinous mass called the semen coagulum.2,3 The dense network of fibrous proteins that comprise the coagulum temporarily entraps and immobilizes spermatozoa allowing various chemical processes to occur, and providing the female reproductive tract sufficient time to prepare for fertilization.2−4 The semenogelin proteins (SEM1 and SEM2), originating from the seminal vesicles, are the primary components of the semen coagulum and play a role in reducing spermatozoon motility.1−4 Subsequent semen liquefaction is dependent on prostate specific antigen (PSA), a protease that degrades the fibrous coagulum structure.2,5 Liquefaction occurs approximately 20 min following ejaculation and results in increased spermatozoon motility.2,6
Interestingly, recent work indicates that PSA-generated peptide fragments of the semenogelin proteins form amyloid fibrils in semen.7,8 Amyloid fibrils are protein aggregates that have fibrillar morphology and extensive β-sheet structure and are generally formed by hydrophobic residues found in the fibrillar core.9,10 Although amyloid fibrils are typically involved in neurodegenerative diseases,9,10 SEM fibrils have been shown to enhance infection by both HIV (human immunodeficiency virus) and CMV (cytomegalovirus).7,8,11 This property of the SEM fibrils makes them similar to the previously identified, cationic SEVI (semen-derived enhancer of viral infectivity) amyloid fibrils, which promote HIV infection by facilitating the attachment of HIV-1 virions to cellular targets.12−14 Because sexual transmission accounts for approximately 80% of new HIV infections15,16 and semen markedly enhances HIV infection rates in vitro,7,12−14,17−19 semen-derived amyloid fibrils that increase HIV infectivity may be targets for therapeutic development.
Of the many peptide fragments of SEM1 and SEM2 generated during PSA cleavage, the peptide fragment of SEM1 corresponding to residues 86–107 [SEM1(86–107)] is a highly prevalent peptide fragment found in fresh semen.8 SEM1(86–107), a cationic peptide with a pI of ∼10, forms amyloid fibrils that enhance HIV infection.8 Endogenous amyloids in semen are composed of this peptide,8 suggesting that fibrillar SEM1(86–107) is present in regular, unmanipulated semen. The levels of SEM1(86–107) in semen directly correlate with donor-dependent variations in HIV-enhancing activity, and semen lacking SEM fibrils does not enhance HIV-1 infection.7,8 As such, strategies aimed at disrupting the structure of SEM1(86–107) may limit semen-mediated transmission of HIV. To date, no studies have examined the detailed structural properties of SEM1(86–107) or SEM fibrils or the molecular forces stabilizing these structures. This work focuses on understanding the conditions that drive SEM1(86–107) fibril formation and dissociation and dissects how the residues of SEM1(86–107) are arranged in the context of SEM1(86–107) fibrils. In particular, the SEM1(86–107) fibril structure was determined via hydrogen–deuterium exchange mass spectrometry (HDXMS) and hydroxyl radical-mediated protein modification and used to understand what interactions drive the formation and maintain the stability of these HIV infectivity-enhancing amyloid fibrils. Knowing which residues are exposed in the SEM1(86–107) fibril structure (i.e., residues with exposed side chains not involved in backbone hydrogen bonding) will reveal which residues likely interact with HIV or the cell surface, a prerequisite for fibril-mediated enhancement of HIV infectivity. Conversely, knowing which residues comprise the SEM1(86–107) fibril core will allow for the design of specific inhibitors of SEM1(86–107) fibril formation or compounds that cause fibril disaggregation.
Experimental Procedures
Buffers
All buffers were prepared using Milli-Q water (Millipore, Billerica, MA) and filtered through a 0.45 μm pore nitrocellulose membrane prior to use. PBS (phosphate-buffered saline) pH 7.7, PBS pH 5.5, ABS (acetate-buffered saline) pH 5.5, PBS pH 2.5, and 20 mM NaPB (sodium phosphate buffer) pH 7.7 were prepared as described previously.20
Peptide Synthesis and Concentration Measurement
SEM1(86–107) is a 22-residue peptide corresponding to residues 86–107 of the human semenogelin 1 protein (Figure 1A). SEM1(86–107) was purchased from Celtek Peptides (Franklin, TN) at 98% purity. To remove residual acid present in the lyophilized sample after purification, the peptide was subjected to three rounds of lyophilization and resuspension in Milli-Q water. The molecular mass of SEM1(86–107), as determined by ExPASy’s proteomics server,21 is 2445.3 Da.
Figure 1.

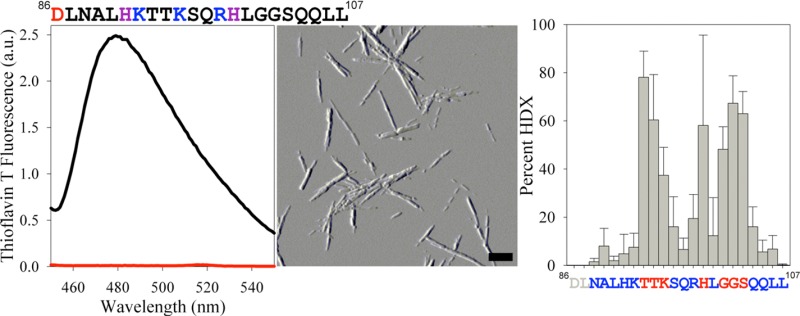
SEM1(86–107) sequence and pH dependence of fibril formation. (A) SEM1(86–107) peptide sequence. Acidic residues are colored red, basic residues blue, and His residues purple. (B) SEM1(86–107) fibril formation was assessed by ThT fluorescence following incubation for 24 h in PBS pH 7.7 (black line) or PBS 2.5 (red line). (C) Far-UV CD spectra were measured prior to (blue line) and following (black and red lines) SEM1(86–107) fibril formation at pH 7.7 (blue and black lines) and 2.5 (red line). (D and E) SEM1(86–107) fibril formation was also assessed by AFM imaging after incubation for 24 h in PBS pH 7.7 (D) or PBS 2.5 (E). Scale bars in panels D and E correspond to 500 nm.
Because SEM1(86–107) does not contain any aromatic residues, the concentration was determined using the absorbance at 205 nm.22 Concentration measurements were performed in 0.1 M K2SO4 and 5 mM KH2PO4 adjusted to pH 7.0 with potassium hydroxide. SEM1(86–107) was diluted into the measurement buffer such that the absorbance at 205 nm was between 0.3 and 0.8 (∼1000-fold dilution for 12 mg/mL peptide). An extinction coefficient (ε205) of 27.0 mL mg–1 cm–1 was calculated according to the method reported by Scopes.22
Fibril Preparation
SEM1(86–107) fibrils were prepared by the dissolving dry SEM1(86–107) peptide in 3.5 mM HCl pH 2.5 and adjusting the concentration to 7.5 mg/mL (3.066 mM). This stock solution was diluted 3-fold in a dilution buffer [one part 7.5 mg/mL SEM1(86–107) stock solution to two parts dilution buffer] to yield 2.5 mg/mL (1.022 mM) SEM1(86–107) in PBS pH 7.7 or 2.5 as reported previously.20 The samples were prepared on ice, and fibril formation was facilitated by agitating the samples at 37 °C for 24 h in a New Brunswick (Edison, NJ) gyratory water bath shaker (G76) at ∼180 rpm.
Thioflavin T Fluorescence Assays
Thioflavin T (ThT) fluorescence assays were used to confirm SEM1(86–107) fibrillation. Aliquots of SEM1(86–107) were withdrawn from incubation samples (2.5 mg/mL, 1.022 mM) and diluted to 0.11 mg/mL (46.5 μM) in PBS pH 7.7 containing a final concentration of 5.45 μM ThT [25 μL of 2.5 mg/mL SEM1(86–107) was mixed with 30 μL of 100 μM ThT in NaPB pH 7.7 and 495 μL of PBS pH 7.7]. Fluorescence measurements were performed on a Fluoromax-4 spectrofluorometer (Horiba Jobin Yvon, Kyoto, Japan). The samples were excited at 440 nm, and emission was collected at 482 nm for 90 s and averaged. Additionally, emission spectra were collected between 450 and 550 nm. The ThT fluorescence emission intensities were corrected for fluctuations in lamp intensity by dividing the fluorescence signal by the lamp intensity. The reported ThT fluorescence values and errors are the averages and standard deviations of at least three independent experiments.
Atomic Force Microscopy Imaging
Atomic force microscopy (AFM) imaging was used to probe the morphology of SEM1(86–107). A volume of 15–25 μL of a SEM1(86–107) peptide solution was incubated for 20 min on freshly cleaved mica. The mica was subsequently washed three or four times with 1 mL of Milli-Q water and allowed to dry overnight. The mica surface was imaged in air at room temperature and humidity in AC tapping mode on a MFP-3D atomic force microscope (Asylum Research, Santa Barbara, CA) using a silicon, Al reflex coated cantilever with a tip radius of 9 nm, a resonant frequency of 70 kHz, and a spring constant of 2 N/m (AC240TS, Olympus America Inc., Center Valley, PA). Images were analyzed using Igor Pro MFP3D (Wavemetrics Inc., Portland, OR), and AFM amplitude images are reported.
Far-UV Circular Dichroism (CD) Spectroscopy
SEM1(86–107) secondary structure was assessed at pH 7.7 before and after fibril formation using far-UV circular dichroism (CD). For the SEM1(86–107) monomer samples, lyophilized SEM1(86–107) was dissolved in 20 mM NaPB pH 7.7 or NaPB pH 2.5 at 0.25 mg/mL. For the SEM1(86–07) fibril samples, the 2.5 mg/mL peptide was incubated in PBS pH 7.7 for 24 h at 37 °C with agitation to induce fibril formation. The SEM1(86–107) fibrils in PBS pH 7.7 (12 μL) were separated from the supernatant via centrifugation at 14000 rpm (20200g) and room temperature. The supernatant was removed, and the aggregated species were resuspended in 300 μL of 20 mM NaPB pH 7.7, a buffer in which the SEM1(86–107) fibrils are stable (Figure 2). Far-UV CD spectra were recorded on a Jasco-715 spectropolarimeter at room temperature in a 1 mm quartz cuvette. The ellipticity of the peptide solution (θ) was corrected by subtracting the buffer baseline and converted to molar ellipticity [Θ] using the following equation:
| 1 |
where M is the peptide molecular mass, l is the light path length in centimeters, and c is the peptide concentration in milligrams per milliliter.
Figure 2.

pH dependence of SEM1(86–107) fibril dissociation. Preformed SEM1(86–107) fibrils were resuspended in the indicated buffers. After 24 h, the presence of fibrils was assessed by relative ThT emission at 482 nm (A) and AFM imaging (B–F). Scale bars in panels B–F correspond to 500 nm.
SEM1(86–107) Fibril Dissociation Assay
SEM1(86–107) fibrils (2.5 mg/mL) were centrifuged at 14000 rpm (20200g) at room temperature, and the supernatant was removed. The fibril pellet was resuspended in PBS pH 7.7, 20 mM NaPB pH 7.7, PBS pH 5.5, ABS pH 5.5, or PBS pH 2.5 for 24 h at room temperature. After resuspension for 24 h, AFM images were taken and ThT fluorescence emission intensity was measured.
Hydrogen–Deuterium Exchange Mass Spectrometry Sample Preparation
Hydrogen–deuterium exchange (HDX) was assayed in the exchanged monomer, exchanged fibril, in-exchange monomer, and unexchanged monomer samples to determine which residues constitute the SEM1(86–107) fibrillar core. The exchanged monomer sample reflects the maximal amount of deuterium incorporation and controls for back-exchange (deuterium loss after quenching). The exchanged fibril sample is used to probe the protection of amide hydrogens in the fibril, and the in-exchange monomer is used to measure the amount of deuterium incorporation that occurs after quenching. SEM1(86–107) fibrils (2.5 mg/mL) prepared in PBS pH 7.7 were pelleted by centrifugation at 14000 rpm (20200g) for 20 min at 4 °C. The supernatant was removed, and the pellet containing the fibrils was resuspended in 20 mM NaPB pH 7.7, 98% D2O, and 2% H2O. In parallel, the exchanged monomer sample was prepared by dissolving the lyophilized peptide monomer in the same buffer to a final concentration of 2.5 mg/mL. Both the fibril and monomer samples were allowed to exchange for 1 h at 25 °C. These HDX conditions were chosen because monomers do not form fibrils within this incubation period and the fibrils are stable under these conditions (Figure 2). In addition, D2O exposure for 1 h is sufficient to fully exchange the monomer because longer exchange times do not lead to more deuterium incorporation and direct injection of this sample into the mass spectrometer confirmed that this sample had nearly 100% deuterium incorporation prior to proteolytic cleavage and chromatography separation. This result suggests that the freshly dissolved peptide is monomeric because, to observe 100% HDX, all amide hydrogens must be accessible, which would not be the case if oligomerization occurred. Following exchange, the samples were quenched and the fibrils were dissociated by placing the samples on ice and diluting them 10-fold in 20 mM NaPB pH 2.3 (100% H2O). This dilution generates a 0.25 mg/mL peptide solution in 20 mM NaPB pH 2.5 (9.8% D2O). These quenching conditions were chosen because HDX is reduced at low temperatures,23,24 and a pH of 2.5 minimizes the hydrogen–deuterium exchange rate23,25 and leads to dissociation of SEM1(86–107) fibrils (Figure 2). Similarly, the in-exchange monomer samples were prepared by dissolving the dry SEM1(86–107) peptide at 0.25 mg/mL in ice-cold 20 mM NaPB pH 2.5 and 9.8% D2O (the quenching conditions). In addition, 0.25 mg/mL SEM1(86–107) monomer was dissolved in H2O-based 20 mM NaPB pH 2.5 to produce unexchanged monomer samples. Following quenching, a nonspecific fungal protease type XIII from Aspergillus saitoi was added, and the samples were analyzed by electrospray ionization liquid chromatography–mass spectrometry (ESI-LC–MS) on the Thermo Scientific LTQ Orbitrap XL (Thermo Fisher Scientific Inc., Waltham, MA). For further details regarding proteolytic cleavage and liquid chromatography–mass spectrometry (LC–MS) analysis, see the Supporting Information.
Hydrogen–Deuterium Exchange Mass Spectrometry Data Analysis
Following elution and detection, peptide fragments in the unexchanged monomer control samples were identified by SEQUEST in the Proteome Discoverer software (Thermo Fisher Scientific Inc.) or manually with ExPASy’s FindPept tool21 and used as input for ExMS.26 Mass peak centroids for the exchanged monomer and fibril, and in-exchange control samples, were identified by ExMS or calculated from peaks identified during manual inspection of the data.
The mass peaks identified by ExMS were used as input for HDsite,27,28 a program that attains close to amino acid resolution by deconvoluting the shape of each isotopic peak to extract the percent HDX for each residue. The percent exchange was calculated for each individual sample (exchanged monomer, exchanged fibril, and in-exchange monomer), using no back-exchange correction. This analysis demonstrated that the percent HDX of the exchanged monomer is larger than the percent HDX of the exchanged fibril and that the percent HDX of the in-exchange monomer is negligible. Because the percent HDX in the in-exchange monomer was negligible and HDSite does not correct for in-exchange, no in-exchange correction was used in this analysis. However, the exchanged monomer samples were used to correct for back-exchange during calculation of the fibril HDX in the HDSite program because HDSite can correct for back-exchange. HDsite does not calculate the HDX for the first two residues in the sequence because it assumes that these residues completely back-exchange during the liquid chromatography separation step.27 Peptide sequences used in the HDsite calculations are shown in Figure S1A of the Supporting Information. All reported results are the average of five independent experiments with the error calculated as the standard deviation of the mean.
Hydroxyl Radical-Mediated Modification Mass Spectrometry Sample Preparation
Hydroxyl radical-mediated modification of the SEM1(86–107) peptide was monitored using ESI-LC–MS to determine which residues constitute the SEM1(86–107) fibrillar core. A volume of 10 μL of SEM1(86–107) fibrils (2.5 mg/mL) in PBS pH 7.7 was centrifuged at 14000 rpm (20200g) for 20 min at 20 °C, and the supernatant was removed. The pelleted fibrils or 0.025 mg of dry SEM1(86–107) monomer was dissolved in 100 μL of 20 mM NaPB pH 7.7 containing either 0, 0.0005, 0.005, 0.05, or 0.1% hydrogen peroxide (final peptide concentration of 0.25 mg/mL). These modification conditions were chosen because SEM1(86–107) fibrils are stable under these buffer conditions (Figure 2) and the SEM1(86–107) monomer does not form fibrils over the duration of the experiment. Furthermore, phosphate buffer does not interfere with hydroxyl radical-mediated protein modification, making it suitable for this analysis.29 The samples were placed in a 1 mm quartz cuvette and exposed for 2 s to a 3 mJ, 266 nm, Nd:YAG (neodymium-doped yttrium aluminum garnet) laser, courteously set up by V. Ermolenkov in I. Lednev’s laboratory at the University at Albany, The State University of New York (Albany, NY). Exposure of hydrogen peroxide to ultraviolet light produces hydroxyl radical species that react with the peptide’s amino acid residue side chains.29−31 Although hydroxyl radicals can also cleave the peptide backbone or lead to peptide cross-linking, modification of the residue side chains is more favorable and little to no backbone cleavage or cross-linking occurs under these conditions because of the limited production of free radicals.30 The peptide concentrations in the unfibrillated and fibrillated samples were the same, ensuring that the ratio of hydroxyl radical to peptide remains constant at a given hydrogen peroxide concentration. In addition, the fibrils remained evenly suspended in the cuvette during UV exposure.
Following UV irradiation, the samples were immediately quenched with 25 μL of 100 mM methionine in 3% formic acid (final concentrations of 20 mM methionine and 0.6% formic acid), flash-frozen with liquid nitrogen, and lyophilized to remove residual hydrogen peroxide.32,33 Methionine was used to quench the reaction because it is more reactive to hydroxyl radicals than other amino acids.29−31,34−37 Formic acid was added to the sample to lower the pH and dissociate any aggregated species. To confirm that the quenching conditions were sufficient, 0.025 mg of dry SEM1(86–107) monomer was dissolved in 100 μL of 0.005 or 0.1% hydrogen peroxide in 20 mM NaPB pH 7.7 mixed with 25 μL of 100 mM methionine in 3% formic acid. These prequenched samples (hydroxyl radical-mediated modification was quenched prior to UV exposure) were then exposed to UV radiation. Following lyophilization, the samples were analyzed by ESI-LC–MS before and after proteolytic cleavage. For further details regarding the proteolytic cleavage and LC–MS analysis, see the Supporting Information.
Hydroxyl Radical-Mediated Modification Mass Spectrometry Data Analysis
Mass spectra were collected by the LTQ Orbitrap XL Xcalibur program and deconvoluted to a single charge state using Xcalibur Xtract version 2.0.7 (Thermo Fisher Scientific Inc.). For the uncleaved peptide samples, the elution peak areas of the unmodified (2445.33 Da) and modified peptides were calculated. The following mass shifts were considered according to the modifications identified by Wang and Chance:31 oxidation (+15.99 Da mass shift; peptide masses of 2461.32, 2477.31, 2493.30, 2509.29, and 2525.28 Da), carbonyl addition (+13.98 Da mass shift; peptide mass of 2459.31 Da), histidine ring opening (−23.02, −22.03, and −10.03 Da mass shifts; peptide masses of 2422.31, 2423.30, and 2435.30 Da), degaunidation (−43.05 Da mass shift; peptide mass of 2402.28 Da), and decarboxylation (−30.01 Da mass shift; peptide mass of 2415.32 Da). The elution peak areas were used in the following equation to determine the percent modification of each sample:
| 2 |
where %HR is the percentage of hydroxyl radical-modified peptide, Amod is the elution peak area of each modified peptide, and Aunmod is the elution peak area of the unmodified peptide.
Using these data, the percentage of hydroxyl radical-mediated peptide modification was determined as a function of hydrogen peroxide concentration (Figure S2 of the Supporting Information). Importantly, the percent modification in the unmodified (0% H2O2) or prequenched samples (quenched prior to UV irradiation) is lower than in the fibril sample, indicating that little modification of the peptide occurred prior to H2O2 exposure or after quenching. Therefore, the 0% H2O2 samples were chosen for further analysis as controls because the values of percent modification in both the 0% H2O2 samples and prequenched controls were close to zero. In addition, the 0.05% H2O2 samples were chosen for further analysis because the percent modification as a function of H2O2 concentration is linear from 0 to 0.05% H2O2, indicating that the modifications do not change the reactivity of the peptide toward hydroxyl radicals.38 Furthermore, there is noticeable protection of the fibril relative to the monomer at 0.05% H2O2 (Figure S2 of the Supporting Information). Single and double oxidations were the most common modifications, while the contribution of other modifications to the total peptide concentration was relatively small. Therefore, in the subsequent analysis of proteolytically cleaved samples, only singly and doubly oxidized peptides were considered.
In the cleaved peptide samples, unmodified peptide fragments were identified manually with ExPASy’s FindPept tool21 and the masses of singly or doubly oxidized peptide fragments were calculated by adding 15.99 or 31.98 Da to the monoisotopic masses of the unmodified peptides.31 Peptide proteolytic fragment peaks were identified in Xcalibur version 2.0.7, and the elution peak area for each peptide was calculated. For each peptide fragment, the elution peak areas were used to calculate the percent modification of each modifiable residue, assuming that modification is evenly distributed between modifiable residues in the peptide sequence, according to the following equation:
| 3 |
where R is the percent modification of each modifiable residue within a given peptide fragment, A1ox is the elution peak area of the peptide containing one oxidized residue, A2ox is the elution peak area of the peptide containing two oxidized residues, Aumod is the elution peak area of the unmodified peptide, and m is the number of modifiable residues in the peptide fragment. Arg, Cys, His, Ile, Leu, Lys, Met, Phe, Pro, Trp, Tyr, and Val residues were considered to be modifiable. Ala, Asn, Asp, Gln, Glu, Gly, Ser, and Thr residues were not considered to be modifiable because the rate of reaction of these residues with hydroxyl radicals is much lower than the rates of other residues or their primary modification is not oxidation.30,38
Using these values, the percent exposure of residues in the fibril relative to the monomer was calculated for each peptide fragment via the following equation:
| 4 |
where E is the percent exposure of a given peptide fragment, F is the percent modification of the modified fibril sample, M is the percent modification of the modified monomer sample, F0 is the percent modification in the 0% H2O2 fibril, and M0 is the percent modification in the 0% H2O2 monomer.
The percent exposure calculated for each peptide fragment was used in an averaging algorithm to determine the average percent exposure for each residue. Peptide fragments in the 0.05% hydrogen peroxide monomer containing no modifications were excluded from analysis because they contain no information about the percent exposure of residues in the fibril. Furthermore, peptide fragments containing Leu107 were excluded from analysis because the percent exposures of peptide fragments ending with Leu107 were extremely variable compared to corresponding peptide fragments ending with Leu106. Thus, the average percent exposure for Leu107 is reported as zero with a large error bar because an accurate modification percentage cannot be assigned. The high variability in oxidation of Leu107 in the SEM1(86–107) fibrils may be due to its location at the C-terminus of the peptide. A similar effect is not observed at the N-terminus of the peptide because hydroxyl radicals react much slower with Asp than Leu.30,31 Using the peptide fragments shown in Figure S1B of the Supporting Information, the average percent exposure for each residue was calculated using the following equation:
| 5 |
where EOHi is the average percent exposure for residue i in the fibril relative to the monomer, ni is the number of peptide fragments containing residue i, Ej is the percent exposure for peptide fragment j containing residue i (calculated from eq 4), and mj is the number of modifiable residues in peptide fragment j. For details regarding the choice of this averaging algorithm, see the Supporting Information.
Equation 5 calculates the exposure of each residue in a weighted average using the exposure values of the peptide sequences containing a given residue. Although different residues in the same peptide can be modified to different extents, this averaging procedure assumes that modifiable residues within a given peptide are modified equally.
Modification profiles, calculated from three independent experiments, were normalized to the value reported for residue 95, which on average showed 100% exposure. Error bars reflect the standard deviation between three normalized, independent experiments.
Results
pH Dependence of SEM1(86–107) Fibril Formation and Dissociation
To probe the conditions required for SEM1(86–107) fibril formation and dissociation and determine acceptable buffer conditions for structural assays, the effect of pH on SEM1(86–107) fibril formation and dissociation was tested. The SEM1(86–107) peptide (2.5 mg/mL) was incubated in PBS pH 7.7 or PBS pH 2.5. Prior to incubation in pH 7.7 buffer, SEM1(86–107) had a far-UV circular dichroism (CD) spectrum typical of a random coil39 with a minimum at ∼200 nm (Figure 1). Following agitation in PBS pH 7.7 at 37 °C for 24 h to promote fibril formation,8,13 far-UV CD spectra, ThT fluorescence spectra, and AFM images were acquired to assess fibril formation. Consistent with prior reports,8 SEM1(86–107) formed typical fibril structures following incubation in PBS pH 7.7. The far-UV CD spectrum of SEM1(86–107) after agitation in PBS pH 7.7 exhibits a minimum at ∼220 nm and a maximum at ∼195 nm (Figure 1), which indicate β-sheet secondary structure39 and are consistent with amyloid fibril formation.9 Secondary structure content analysis of the spectra according to the method of Yang et al.40 indicates that the sample is composed primarily of β-sheets. Although the minimum at ∼220 nm was broad, the far-UV CD spectrum is similar to far-UV CD spectra obtained for other amyloid fibrils.41−44 Upon excitation at 440 nm, the ThT emission spectrum in the presence of the SEM1(86–107) peptide in PBS pH 7.7 exhibited a maximum at ∼482 nm (Figure 1), indicative of amyloid fibrils.45 AFM images confirmed that these samples formed fibrillar aggregates with a diameter of ∼6 ± 2 nm (Figure 1). The lag time for fibril formation in PBS pH 7.7 was between 12 and 24 h. Conversely, when SEM1(86–107) was incubated in PBS pH 2.5, the far-UV CD spectrum was typical of random coil, there was little to no ThT fluorescence, and fibrils were not observed in AFM images (Figure 1), suggesting that SEM1(86–107) does not form fibrils within 24 h at this pH (Figure 1). Overall, these results suggest that SEM1(86–107) forms fibrils within 24 h in PBS pH 7.7 but not in PBS pH 2.5.
The pH dependence of SEM1(86–107) fibril dissociation was also tested. Fibril dissociation was compared at pH 7.7 and 2.5 to determine acceptable buffer conditions for structural assays. In addition, fibril dissociation was tested at pH 5.5 to mimic the pH conditions following mixing of semen (pH ∼7.746) with vaginal fluid, which under normal conditions has a pH of ∼5.2.47 Determining SEM1(86–107) fibril stability at pH 5.5 will provide an assessment of whether these fibrils would be stable and available for enhancing HIV infection upon deposition of semen in the vaginal tract. Fibril dissociation was tested in two buffers, PBS and ABS, both at pH 5.5. As expected, preformed SEM1(86–107) fibrils resuspended for 24 h in pH 7.7 buffer (in the presence and absence of physiological salt concentrations) exhibited strong ThT fluorescence signals, and fibrils were readily detected in AFM images (Figure 2). In contrast, preformed SEM1(86–107) fibrils resuspended in PBS pH 2.5 exhibited almost no ThT fluorescence, and fibrils were not observed in AFM images, suggesting that fibril dissociation occurs at this pH (Figure 2). The fact that a pH value of 2.5 completely dissociates SEM1(86–107) fibrils facilitates structural analyses of these fibrils by HDXMS and hydroxyl radical-mediated modification. Interestingly, fibrils resuspended in pH 5.5 buffer appear to undergo only partial dissociation after 24 h because there was a partial decrease in ThT fluorescence and fibrils were detected in AFM images (Figure 2). These observations suggest that after treatment for 24 h at pH 5.5, there is a low level of SEM1(86–107) fibril dissociation, but the majority of the fibrils are still intact. Notably, the pH dependence of fibril formation and dissociation for SEM1(86–107) is similar to that of PAPf39 (also called SEVI when in the amyloid form), another semen-derived, amyloid fibril-forming peptide fragment that increases HIV infectivity.20 These results indicate that HIV-enhancing semen fibrils are more stable at neutral pH than acidic pH, but slightly acidic pH conditions, reflecting the mixing of vaginal fluid with semen, permit preformed SEM1(86–107) fibrils to maintain a fibrillar conformation.
The SEM1(86–107) fibril structure is of interest because SEM1(86–107) and peptide fragments containing the SEM1(86–107) sequence form fibrils that enhance HIV infectivity, and the endogenous levels of these fragments in semen correlate with semen’s HIV-enhancing activity.7,8 Knowledge of the structural characteristics of the SEM1(86–107) fibrils will improve our understanding of the molecular interactions that stabilize the SEM1(86–107) fibrils and render them able to enhance HIV infection. The subsequent experiments are aimed at identifying the residues that comprise the fibrillar core (i.e., residues involved in forming the cross-β structure) using two different approaches: hydrogen–deuterium mass spectrometry (HDXMS)20,27,28,48−52 and hydroxyl radical-mediated labeling.31,32,37,38,53−55
Identification of the SEM1(86–107) Fibril Core Sequence by HDXMS
HDXMS was used to determine the residues that comprise the SEM1(86–107) fibrillar core. These assays make use of the fact that exposed amide hydrogens exchange with deuterium more readily than amide hydrogens involved in hydrogen bonds within the fibril core.23,25,48−51 Using this methodology, the fibril core sequence was determined by measuring the HDX in three samples: the exchanged monomer, exchanged fibrils, and in-exchange monomer as an additional negative control (see Experimental Procedures for details). As expected, the masses of peptides in the exchanged monomer sample were greater than the masses of the same peptides in the exchanged fibril sample, indicating that sequences within the fibril are protected from HDX, relative to the monomer (Figure S3 of the Supporting Information). Importantly, there is negligible deuterium incorporation in the in-exchange peptide fragments, indicating that there is limited deuterium incorporation after quenching (Figure S3 of the Supporting Information).
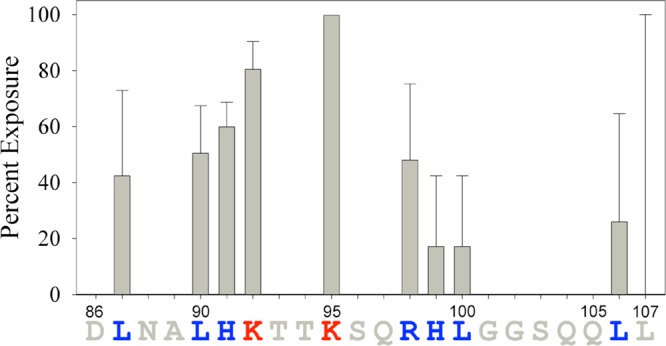
The extent of HDX in each sample was used to calculate the HDX profile for the fibrils.27,28 The results of this analysis indicate that residues 86–92, 96–98, 100, and 104–107 of the SEM1(86–107) peptide are protected from HDX (approximately <20% HDX) and suggest that these residues are part of the SEM1(86–107) fibrillar core (Figure 3). Residues 93–95, 99, and 101–103 are less protected from HDX (approximately >40% HDX) and are therefore most likely not involved in the β-sheet SEM1(86–107) fibril core structure (Figure 3). It should be noted, however, that the HDX of His99 is quite variable (large error bar), and as such, this residue may be protected, in which case residues 96–100 would all be part of the fibrillar core.
Figure 3.

SEM1(86–107) fibril core sequence calculated from HDXMS experiments. Vertical bars represent the percent HDX for the SEM1(86–107) fibrils calculated using HDSite.27 Residues colored red are exposed, while residues colored blue are protected and predicted to be part of the fibril core. The percent HDX values of residues colored gray were not determined by this method. Error bars are the standard deviations of five independent experiments.
Identification of the SEM1(86–107) Fibril Core Sequence by Hydroxyl Radical-Mediated Modification
Similar to HDX, hydroxyl radical-mediated modification assays can probe which residues are exposed in the amyloid fibrils and be used to determine which residues comprise the fibrillar core. Unlike the HDX assays, however, hydroxyl radical-mediated modification probes exposure of amino acid side chains rather than backbone amide hydrogens. In these assays, the SEM1(86–107) monomers and fibrils were exposed to a 266 nm laser in the presence of hydrogen peroxide to induce hydroxyl radical-mediated modification. Analysis of the peptide samples revealed that the fibrils were protected from hydroxyl radical-mediated modification (∼0.6% modification at 0.05% H2O2) relative to the monomer (∼5% modification at 0.05% H2O2). These findings, together with the observation that minimal hydroxyl radical-mediated modification occurred following quenching (Figure S2 of the Supporting Information), suggest that hydroxyl radical-mediated modification can be used to map the core residues of the SEM1(86–107) fibrils.
The percent modification of each residue following hydroxyl radical-mediated modification was determined by proteolytic cleavage of the peptide and LC–MS analysis. The results of the analysis revealing exposed residues in the fibril relative to the monomer are shown in Figure 4. The percent exposure of some residues was not determined (gray residues with no bar in Figure 4) because these residues are not readily modified by hydroxyl radicals (see Experimental Procedures for more details). As seen in the HDX assays, residues Leu87, Leu90, His91, Arg98, Leu100, and Leu106 are protected from hydroxyl radical-mediated modification in the fibril (<60% modification), suggesting that they are part of the fibrillar core. Also consistent with the HDX results was the observation that Lys95 (∼100% modification) is exposed in the fibril, suggesting it is not part of the fibrillar core. Conversely, Lys92 is exposed as assessed by hydroxyl radical-mediated modification (∼80% modification) but protected as assessed by HDX. In addition, His99 is protected as assessed by hydroxyl radical-mediated modification (∼20% modification) yet not involved in the β-sheet fibril core structure as assessed by HDX. The discrepancy in the exposure of Lys92 and His99 may occur because HDX and hydroxyl radical-mediated modification probe the exposure of residues differently: HDX probes backbone amide hydrogen protection, while hydroxyl radical-mediated modification probes amino acid residue side chain exposure. In addition, Lys92 and His99 are on the edges of the fibrillar core as defined by HDXMS (and confirmed by hydroxyl radical-mediated modification), making disagreement between the two methods more likely for these residues. The discrepancy between the results for His99 may also be explained by the fact that the standard deviation was quite large in the HDX assay, which suggests that this residue is most likely protected.
Figure 4.
SEM1(86–107) fibril core sequence determined by hydroxyl radical-mediated modification. Vertical bars represent the percent exposure of residues in the SEM1(86–107) fibrils as calculated by eq 5. Residues colored red are exposed, while residues colored blue are protected and predicted to be part of the fibril core. The percent exposure values of residues colored gray were not determined by this method. Error bars reflect the standard deviations of three independent experiments.
Importantly, there is overall agreement between the HDX and hydroxyl radical-mediated modification results (Figure 5). To compare the percent HDX and hydroxyl radical-mediated modification of the SEM1(86–107) fibrils, the profiles were rescaled (normalized) between zero and one according to the smallest and largest percent exposure values. As shown in Figure 5, there is a qualitative linear correlation between the percent HDX and hydroxyl radical-mediated modification for residues 90–92. Similarly, the exposures of residues 95–106 also have a qualitative linear correlation between the two measurement methods. Qualitative rather than quantitative agreement between HDX and hydroxyl radical-mediated modification is expected because of the limited number of residues that can be analyzed by hydroxyl radical-mediated modification and the fact that the two assays probe completely different parameters (backbone amide hydrogen vs amino acid side chain exposure). Therefore, the presence of such a trend strongly suggests that the identified core sequences are valid. In particular, both methods show that residues 86–91, 96–100, and 104–107 of the SEM1(86–107) peptide are protected, suggesting that these sequences are part of the fibrillar core. In agreement with experimental assays, sequence-based computational prediction56−61 of amyloidogenic residues in SEM1(86–107) suggests a similar pattern in which residues 86–91 and 102–107 are predicted to be amyloidogenic (Figure S4 of the Supporting Information).
Figure 5.
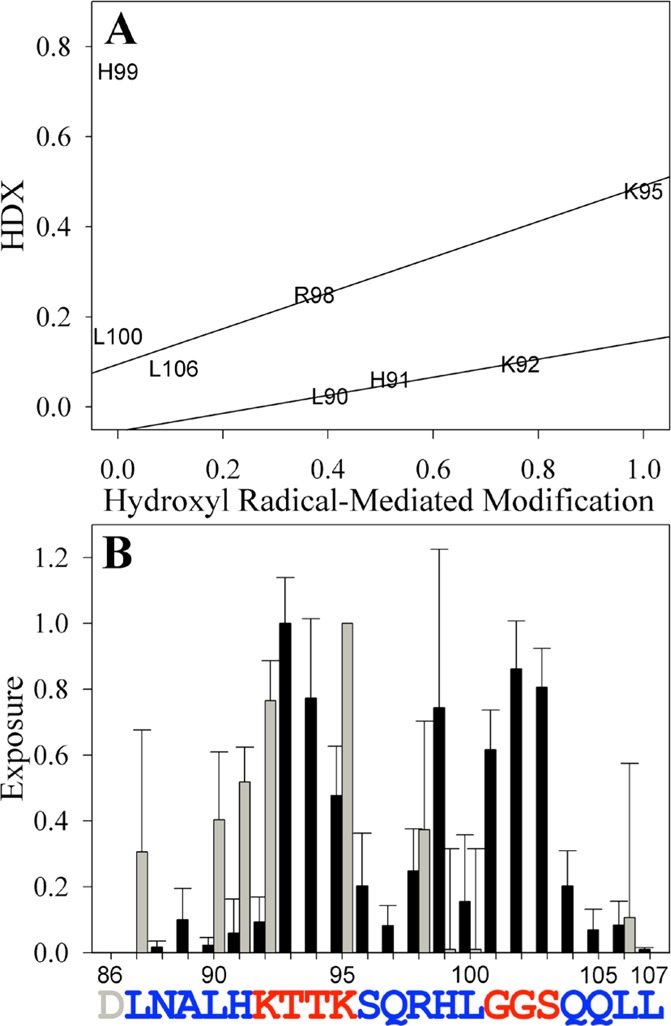
Correlation between HDX and hydroxyl radical-mediated modification data assessing the SEM1(86–107) fibril core sequence. The percent HDX (Figure 3) and percent hydroxyl radical-mediated modification (Figure 4) were rescaled between zero and one and compared in a correlation plot (A) or directly (B). Lines in panel A are shown to guide the eye. Black bars in panel B are the values calculated from HDXMS experiments, and gray bars are the values calculated from the hydroxyl radical-mediated modification assays. Residues colored red are exposed, while residues colored blue are protected and predicted to be part of the fibril core. The exposure of residues lacking bars was indeterminate. Error bars are the standard deviations of at least three independent experiments.
Discussion
SEM fibrils, in particular SEM1(86–107), have recently been identified as amyloid fibrils in semen that markedly enhance HIV-1 infection.7,8 These amyloids join SEVI13 as naturally occurring factors that may play major roles in propagating the sexual spread of the virus. Consistent with the notion that semen amyloids play a significant role in the ability of semen to enhance HIV infection is the fact that the levels of these amyloidogenic peptides correlate with HIV-enhancing activity, and that semen deficient in these fibrils lacks the ability to enhance infection.7,8,17 This work provides the first detailed structural characterization of the SEM1(86–107) fibrils, via examination of the pH dependence of SEM1(86–107) fibril formation and dissociation and identification of its amyloid core region.
Examination of the pH dependence of SEM1(86–107) fibril formation and dissociation revealed that, similar to PAPf39 (SEVI),20,62 the SEM1(86–107) peptide forms fibrils at neutral pH but not at pH 2.5. Furthermore, the fibrils of both peptides are stable at pH 7.7, partially dissociate at pH 5.5, and fully dissociate at pH 2.5.20 Thus, it appears that the pH dependence of fibril formation and dissociation is a common property between semen-derived amyloids and may play a role in the biological function of semen-derived amyloid fibrils. It is worth noting that the pH of semen is ∼7.746 whereas the pH of vaginal fluid is ∼5.2.47 Because semen is buffered, a mixture of semen with vaginal fluids generates a solution with a pH of 5–6,63,64 a pH at which SEM1(86–107) fibrils undergo only partial dissociation (Figure 2) and, therefore, should be capable of enhancing HIV infection. Bacterial vaginosis (BV), a common disorder in which changes in vaginal flora render vaginal fluid less acidic, is associated with a 60% increased risk of HIV-1 acquisition in women.65 It is tempting to speculate that mixing of BV vaginal fluid with semen would lead to more neutral conditions that favor SEM1(86–107) fibril stability (Figure 2), and that this could facilitate HIV transmission by promoting the activity of semen fibrils.
In addition to the demonstration of the pH dependence of SEM1(86–107) fibril stability, the core sequence of SEM1(86–107) was determined using both hydrogen–deuterium exchange mass spectrometry and hydroxyl radical-mediated protein modification. These assays showed that residues 86–91, 96–100, and 104–107 of SEM1(86–107) are protected from HDX and hydroxyl radical-mediated modification and are part of the fibrillar core. Conversely, residues 92–95 and 101–103 are less protected from modification and are therefore likely solvent-exposed. Importantly, these two methods, which apply very different chemistry, lead to similar conclusions with regard to exposed versus buried residues in the fibril structure. Using this structural information, the following SEM1(86–107) fibril structure is proposed: residues 86–91, 96–100, and 104–107 form β-strands, and residues 92–95 and 101–103 form turn or loop regions. Importantly, fibril structures that contain three or more β-strand segments have been documented.66−73 For instance, models based on experimental data predict that the HET-s prion forms triangular fibrils67,70 and α-synuclein, tau, Ure2p, amylin, and the B1 domain of IgG binding protein G form superpleated β-sheets.66,68,71−73 Thus, it is possible that SEM1(86–107) forms triangular fibrils or superpleated β-sheets. Furthermore, because short stretches of two to six residues can form β-arcs74 or tight turns,75 it is possible that exposed residues 92–95 and 101–103 form turn regions in the fibril structure.
The structural information obtained by the hydrogen–deuterium exchange and hydroxyl radical-mediated protein modification assays also provides potential insight into the pH dependence of SEM1(86–107) fibril formation and dissociation. Within the SEM1(86–107) sequence, there are three residues that undergo changes in their ionization states between pH 7.7 and 2.5: Asp86, His91, and His99. Interestingly, all of these residues are on the edges of the fibrillar core regions. Asp86 and His91 flank the 86–91 fibril core region, while His99 is on C-terminal edge of the 96–100 fibril core region. Having these ionizable residues at the edges of the fibril core sequence may help regulate the pH dependence of fibril formation and dissociation. At low pH, the His residues become positively charged while the Asp residue becomes neutral, causing an increase in the peptide net charge. Fibril formation may not occur at low pH because the positively charged His residues disfavor burial within the fibril core, while neutralization of the N-terminal Asp residue increases the net positive charge at the N-terminus. A similar mechanism can be used to explain the dissociation of preformed fibrils at low pH. If the residues are located at the edge of the aggregated regions, they can disrupt fibril structure at low pH. Therefore, the location of the ionizable residues relative to the aggregated regions of the SEM1(86–107) peptide may be essential for determining their effect on the pH dependence of fibril formation and dissociation.
Knowing the SEM1(86–107) fibril core sequence also provides information about fibril properties that are crucial for SEM1 fibril-mediated enhancement of HIV and CMV infection.7,11 The fact that residues 92–95 and 101–103 of the SEM1(86–107) sequence are solvent-exposed in the fibrils reveals interesting insights into the mechanisms of fibril action. The exposed regions of the peptide contain three positively charged residues (Lys92, Lys95, and Arg98), which may facilitate electrostatically mediated binding of virions to the fibrils. Exposure of positively charged residues is consistent with the notion that the cationic properties of semen fibrils are crucial for their ability to enhance viral infection.7,12,76 Interestingly, the N-terminal region of the PAPf39 peptide, which contains the majority of positively charged residues in the sequence, is exposed on the PAPf39 fibril (SEVI) surface.20 The PAPf39 and SEM1(86–107) peptides have no sequence similarity, suggesting that exposure of cationic residues in the two fibrils results from different fibril structures. Thus, exposure of cationic residues may be a general semen amyloid fibril property, and both PAPf39 and SEM1(86–107) fibrils may interact with HIV and the cell surface to enhance HIV infection. At the same time, the data identifying residues 86–91, 96–100, and 104–107 as the amyloid core of SEM1(86–107) suggest that peptides or small molecules targeting these regions may disrupt the SEM1(86–107) fibril structure. Disrupting the fibrillar state of SEM1(86–107) may potentially be used as a microbicide strategy to antagonize the activity of these fibrils because the monomeric states of amyloidogenic SEM peptides lack the ability to enhance HIV infection.7,12 Future studies will aim to target the amyloid core region of SEM1(86–107) through the design of sequence specific antagonists and test the effects of these antagonists on SEM1(86–107) structure and HIV-enhancing activity. Conversely, rather than disrupting the fibril structure, exposed residues can be targeted by compounds that inhibit interactions of fibrils with HIV or the cell surface.
Acknowledgments
We thank Drs. Dmitri Zagorevski (Rensselaer Polytechnic Institute), Igor K. Lednev (University at Albany, The State University of New York), and Vladimir Ermolenkov (University at Albany, The State University of New York) for their assistance in mass spectrometry and setting up and using the Nd:YAG laser. We also thank Dr. Michael Brenowitz (Albert Einstein College of Medicine, Bronx, NY) for helpful discussions and expert advice about hydroxyl radical labeling experiments.
Glossary
Abbreviations
- ABS
acetate-buffered saline
- AFM
atomic force microscopy
- CD
circular dichroism
- CMV
cytomegalovirus
- ESI-LC–MS
electrospray ionization liquid chromatography–mass spectrometry
- HDX
hydrogen–deuterium exchange
- HDXMS
hydrogen–deuterium exchange mass spectrometry
- HIV
human immunodeficiency virus
- LC–MS
liquid chromatography–mass spectrometry
- NaPB
sodium phosphate buffer
- PAPf39
prostatic acidic phosphatase fragment of 39 residues (also termed SEVI in the fibrillar form)
- PBS
phosphate-buffered saline
- SEM
semenogelin
- SEM1
semenogelin I
- SEM1(86–107)
semenogelin I peptide fragment of residues 86–107
- SEM2
semenogelin II
- SEVI
semen-derived enhancer of viral infectivity (also termed PAPf39)
- ThT
thioflavin T
- UV
ultraviolet.
Supporting Information Available
Additional experimental methods, peptide sequence coverage for HDXMS (Figure S1), hydroxyl radical-mediated modification as a function of hydrogen peroxide concentration (Figure S2), mass spectra of the hydrogen–deuterium exchanged SEM1(86–107) peptide (Figure S3), and predicted aggregation-prone regions of SEM1(86–107) (Figure S4). This material is available free of charge via the Internet at http://pubs.acs.org.
This material is based upon work supported by the National Science Foundation Graduate Research Fellowship Program under Grant DGE-1247271. This work was also supported by the National Institute of General Medical Sciences of the National Institutes of Health via Grant 1R21GM101134 (to G.I.M.), the National Institutes of Health via Grant 1K99AI104262-01A1 (to N.R.R.), and the University of California, San Francisco, CA, via the Hellman Award (to N.R.R.).
The authors declare no competing financial interest.
Funding Statement
National Institutes of Health, United States
Supplementary Material
References
- Robert M.; Gagnon C. (1999) Semenogelin I: A coagulum forming, multifunctional seminal vesicle protein. Cell. Mol. Life Sci. 55, 944–960. [DOI] [PMC free article] [PubMed] [Google Scholar]
- de Lamirande E. (2007) Semenogelin, the main protein of the human semen coagulum, regulates sperm function. Semin. Thromb. Hemostasis 33, 60–68. [DOI] [PubMed] [Google Scholar]
- Yoshida K.; Kawano N.; Yoshiike M.; Yoshida M.; Iwamoto T.; Morisawa M. (2008) Physiological roles of semenogelin I and zinc in sperm motility and semen coagulation on ejaculation in humans. Mol. Hum. Reprod. 14, 151–156. [DOI] [PubMed] [Google Scholar]
- Yoshida K.; Yamasaki T.; Yoshiike M.; Takano S.; Sato I.; Iwamoto T. (2003) Quantification of seminal plasma motility inhibitor/semenogelin in human seminal plasma. J. Androl. 24, 878–884. [DOI] [PubMed] [Google Scholar]
- Lilja H.; Oldbring J.; Rannevik G.; Laurell C. B. (1987) Seminal vesicle-secreted proteins and their reactions during gelation and liquefaction of human semen. J. Clin. Invest. 80, 281–285. [DOI] [PMC free article] [PubMed] [Google Scholar]
- Lilja H.; Abrahamsson P. A.; Lundwall A. (1989) Semenogelin, the predominant protein in human semen. Primary structure and identification of closely related proteins in the male accessory sex glands and on the spermatozoa. J. Biol. Chem. 264, 1894–1900. [PubMed] [Google Scholar]
- Roan N. R.; Müller J. A.; Liu H.; Chu S.; Arnold F.; Stürzel C. M.; Walther P.; Dong M.; Witkowska H. E.; Kirchhoff F.; Münch J.; Greene W. C. (2011) Peptides Released by Physiological Cleavage of Semen Coagulum Proteins Form Amyloids that Enhance HIV Infection. Cell Host Microbe 10, 541–550. [DOI] [PMC free article] [PubMed] [Google Scholar]
- Roan N. R.; Liu H.; Usmani S. M.; Neidleman J.; Müller J.; Alvila-Herrera A.; Gawanbacht A.; Zirafi O.; Chu S.; Dong M.; Kumar S. T.; Smith J. F.; Pollard K. S.; Fändrich M.; Kirchhoff F.; Münch J.; Witkowska H. E.; Greene W. C. (2014) Liquefaction of Semen Generates and Later Degrades a Conserved Semenogelin Peptide that Enhances HIV Infection. J. Virol. DOI: 10.1128/JVI.00269-14. [DOI] [PMC free article] [PubMed] [Google Scholar]
- Chiti F.; Dobson C. M. (2006) Protein Misfolding, Functional Amyloid, and Human Disease. Annu. Rev. Biochem. 75, 333–366. [DOI] [PubMed] [Google Scholar]
- Eisenberg D.; Jucker M. (2012) The Amyloid State of Proteins in Human Diseases. Cell 148, 1188–1203. [DOI] [PMC free article] [PubMed] [Google Scholar]
- Tang Q.; Roan N. R.; Yamamura Y. (2013) Seminal Plasma and Semen Amyloids Enhance Cytomegalovirus Infection in Cell Culture. J. Virol. 87, 12583–12591. [DOI] [PMC free article] [PubMed] [Google Scholar]
- Roan N. R.; Münch J.; Arhel N.; Mothes W.; Neidleman J.; Kobayashi A.; Smith-McCune K.; Kirchhoff F.; Greene W. C. (2009) The Cationic Properties of SEVI Underlie Its Ability To Enhance Human Immunodeficiency Virus Infection. J. Virol. 83, 73–80. [DOI] [PMC free article] [PubMed] [Google Scholar]
- Münch J.; Rücker E.; Ständker L.; Adermann K.; Goffinet C.; Schindler M.; Wildum S.; Chinnadurai R.; Rajan D.; Specht A.; Giménez-Gallego G.; Sánchez P. C.; Fowler D. M.; Koulov A.; Kelly J. W.; Mothes W.; Grivel J.-C.; Margolis L.; Keppler O. T.; Forssmann W.-G.; Kirchhoff F. (2007) Semen-derived amyloid fibrils drastically enhance HIV infection. Cell 131, 1059–1071. [DOI] [PubMed] [Google Scholar]
- Usmani S. M.; Zirafi O.; Müller J.; Sandi-Monroy N.; Yadav J. K.; Meier C.; Weil T.; Roan N. R.; Greene W. C.; Walther P.; Nilsson K. P. R.; Hammarström P.; Wetzel R.; Pilcher C. D.; Gagsteiger F.; Fändrich M.; Kirchhoff F.; Münch J. (2014) Direct Visualization of HIV-Enhancing Endrogenous Amyloid Fibrils in Human Semen. Nat. Commun. 5, 1–7. [DOI] [PMC free article] [PubMed] [Google Scholar]
- Diagnoses of HIV Infection and AIDS in the United States and Dependent Areas, 2010 (2012) Centers for Disease Control and Prevention, Atlanta.
- Royce R. A.; Seña A.; Cates W.; Cohen M. S. (1997) Sexual Transmission of HIV. N. Engl. J. Med. 336, 1072–1078. [DOI] [PubMed] [Google Scholar]
- Kim K.-A.; Yolamanova M.; Zirafi O.; Roan N.; Staendker L.; Forssmann W.-G.; Burgener A.; Dejucq-Rainsford N.; Hahn B.; Shaw G.; Greene W.; Kirchhoff F.; Münch J. (2010) Semen-mediated enhancement of HIV infection is donor-dependent and correlates with the levels of SEVI. Retrovirology 7, 55. [DOI] [PMC free article] [PubMed] [Google Scholar]
- Olsen J. S.; Brown C.; Capule C. C.; Rubinshtein M.; Doran T. M.; Srivastava R. K.; Feng C.; Nilsson B. L.; Yang J.; Dewhurst S. (2010) Amyloid-binding Small Molecules Efficiently Block SEVI (Semen-derived Enhancer of Virus Infection)- and Semen-mediated Enhancement of HIV-1 Infection. J. Biol. Chem. 285, 35488–35496. [DOI] [PMC free article] [PubMed] [Google Scholar]
- Hauber I.; Hohenberg H.; Holstermann B.; Hunstein W.; Hauber J. (2009) The main green tea polyphenol epigallocatechin-3-gallate counteracts semen-mediated enhancement of HIV infection. Proc. Natl. Acad. Sci. U.S.A. 106, 9033–9038. [DOI] [PMC free article] [PubMed] [Google Scholar]
- French K. C.; Makhatadze G. I. (2012) Core Sequence of PAPf39 Amyloid Fibrils and Mechanism of pH-Dependent Fibril Formation: The Role of Monomer Conformation. Biochemistry 51, 10127–10136. [DOI] [PMC free article] [PubMed] [Google Scholar]
- Gasteiger E., Hoogland C., Gattiker A., Duvaud S., Wilkins M. R., Appel R. D., Bairoch A., and Walker J. M. (2005) Protein Identification and Analysis Tools on the ExPASy Server. In The Proteomics Protocols Handbook (Walker J. M., Ed.) pp 571–607, Humana Press, Totowa, NJ. [Google Scholar]
- Scopes R. K. (1974) Measurement of Protein by Spectrophotometry at 205 nm. Anal. Biochem. 59, 277–282. [DOI] [PubMed] [Google Scholar]
- Englander S. W.; Kallenbach N. R. (1983) Hydrogen exchange and structural dynamics of proteins and nucleic acids. Q. Rev. Biophys. 16, 521–655. [DOI] [PubMed] [Google Scholar]
- Englander S. W.; Poulsen A. (1969) Hydrogen-Tritium Exchange of the Random Chain Polypeptide. Biopolymers 7, 379–393. [Google Scholar]
- Englander S. W.; Sosnick T. R.; Englander J. J.; Mayne L. (1996) Mechanisms and uses of hydrogen exchange. Curr. Opin. Struct. Biol. 6, 18–23. [DOI] [PMC free article] [PubMed] [Google Scholar]
- Kan Z.-Y.; Mayne L.; Chetty P. S.; Englander S. W. (2011) ExMS: Data Analysis for HX-MS Experiments. J. Am. Soc. Mass Spectrom. 22, 1906–1915. [DOI] [PMC free article] [PubMed] [Google Scholar]
- Kan Z.-Y.; Walters B. T.; Mayne L.; Englander S. W. (2013) Protein hydrogen exchange at residue resolution by proteolytic fragmentation mass spectrometry analysis. Proc. Natl. Acad. Sci. U.S.A. 110, 16438–16443. [DOI] [PMC free article] [PubMed] [Google Scholar]
- Hu W.; Walters B. T.; Kan Z.-Y.; Mayne L.; Rosen L. E.; Marqusee S.; Englander S. W. (2013) Stepwise protein folding at near amino acid resolution by hydrogen exchange and mass spectrometry. Proc. Natl. Acad. Sci. U.S.A. 110, 7684–7689. [DOI] [PMC free article] [PubMed] [Google Scholar]
- Xu M.; Shashilov V.; Lednev I. K. (2007) Probing the Cross-β Core Structure of Amyloid Fibrils by Hydrogen-Deuterium Exchange Deep Ultraviolet Resonance Raman Spectroscopy. J. Am. Chem. Soc. 129, 11002–11003. [DOI] [PubMed] [Google Scholar]
- Takamoto K.; Chance M. R. (2006) Radiolytic protein footprinting with mass spectrometry to probe the structure of macromolecular complexes. Annu. Rev. Biophys. Biomol. Struct. 35, 251–276. [DOI] [PubMed] [Google Scholar]
- Wang L.; Chance M. R. (2011) Structural Mass Spectrometry of Proteins Using Hydroxyl Radical Based Protein Footprinting. Anal. Chem. 83, 7234–7241. [DOI] [PMC free article] [PubMed] [Google Scholar]
- Aye T. T.; Low T. Y.; Sze S. K. (2005) Nanosecond laser-induced photochemical oxidation method for protein surface mapping with mass spectrometry. Anal. Chem. 77, 5814–5822. [DOI] [PubMed] [Google Scholar]
- Charvátová O.; Foley B. L.; Bern M. W.; Sharp J. S.; Orlando R.; Woods R. J. (2008) Quantifying protein interface footprinting by hydroxyl radical oxidation and molecular dynamics simulation: Application to galectin-1. J. Am. Soc. Mass Spectrom. 19, 1692–1705. [DOI] [PMC free article] [PubMed] [Google Scholar]
- Chen J. W.; Rempel D. L.; Gau B. C.; Gross M. L. (2012) Fast Photochemical Oxidation of Proteins and Mass Spectrometry Follow Submillisecond Protein Folding at the Amino-Acid Level. J. Am. Chem. Soc. 134, 18724–18731. [DOI] [PMC free article] [PubMed] [Google Scholar]
- Gau B. C.; Sharp J. S.; Rempel D. L.; Gross M. L. (2009) Fast Photochemical Oxidation of Protein Footprints Faster than Protein Unfolding. Anal. Chem. 81, 6563–6571. [DOI] [PMC free article] [PubMed] [Google Scholar]
- Saladino J.; Liu M.; Live D.; Sharp J. S. (2009) Aliphatic Peptidyl Hydroperoxides as a Source of Secondary Oxidation in Hydroxyl Radical Protein Footprinting. J. Am. Soc. Mass Spectrom. 20, 1123–1126. [DOI] [PMC free article] [PubMed] [Google Scholar]
- Watson C.; Sharp J. S. (2012) Conformational Analysis of Therapeutic Proteins by Hydroxyl Radical Protein Footprinting. AAPS J. 14, 206–217. [DOI] [PMC free article] [PubMed] [Google Scholar]
- Xu G.; Chance M. R. (2007) Hydroxyl radical-mediated modification of proteins as probes for structural proteomics. Chem. Rev. 107, 3514–3543. [DOI] [PubMed] [Google Scholar]
- Reed J.; Reed T. A. (1997) A Set of Constructed Type Spectra for the Practical Estimation of Peptide Secondary Structure from Circular Dichroism. Anal. Biochem. 254, 36–40. [DOI] [PubMed] [Google Scholar]
- Yang J. T.; Wu C. S.; Martinez H. M. (1986) Calculation of protein conformation from circular dichroism. Methods Enzymol. 130, 208–269. [DOI] [PubMed] [Google Scholar]
- Balguerie A.; Dos Reis S.; Coulary-Salin B.; Chaignepain S.; Sabourin M.; Schmitter J. M.; Saupe S. J. (2004) The sequences appended to the amyloid core region of the HET-s prion protein determine higher-order aggregate organization in vivo. J. Cell Sci. 117, 2599–2610. [DOI] [PubMed] [Google Scholar]
- Kenig M.; Berbic S.; Krijestorac A.; Kroon-Zitko L.; Tusek M.; Pompe-Novak M.; Zerovnik E. (2004) Differences in aggregation properties of three site-specific mutants of recombinant human stefin B. Protein Sci. 13, 63–70. [DOI] [PMC free article] [PubMed] [Google Scholar]
- Yamaguchi K.; Takahashi S.; Kawai T.; Naiki H.; Goto Y. (2005) Seeding-dependent propagation and maturation of amyloid fibril conformation. J. Mol. Biol. 352, 952–960. [DOI] [PubMed] [Google Scholar]
- Fei L.; Perrett S. (2009) Disulfide bond formation significantly accelerates the assembly of Ure2p fibrils because of the proximity of a potential amyloid stretch. J. Biol. Chem. 284, 11134–11141. [DOI] [PMC free article] [PubMed] [Google Scholar]
- Naiki H.; Higuchi K.; Hosokawa M.; Takeda T. (1989) Fluorometric Determination of Amyloid Fibrils in Vitro Using the Fluorescent Dye, Thioflavin T. Anal. Biochem. 177, 244–249. [DOI] [PubMed] [Google Scholar]
- Owen D. H.; Katz D. F. (2005) A Review of the Physical and Chemical Properties of Human Semen and the Formulation of a Semen Simulant. J. Androl. 26, 459–469. [DOI] [PubMed] [Google Scholar]
- Tevi-Bénissan C.; Bélec L.; Lévy M.; Schneider-Fauveau V.; Si Mohamed A.; Hallouin M. C.; Matta M.; Grésenguet G. (1997) In vivo semen-associated pH neutralization of cervicovaginal secretions. Clin. Diagn. Lab. Immunol. 4, 367–374. [DOI] [PMC free article] [PubMed] [Google Scholar]
- Damo S. M.; Phillips A. H.; Young A. L.; Li S.; Woods V. L.; Wemmer D. E. (2010) Probing the Conformation of a Prion Protein Fibril with Hydrogen Exchange. J. Biol. Chem. 285, 32303–32311. [DOI] [PMC free article] [PubMed] [Google Scholar]
- Del Mar C.; Greenbaum E. A.; Mayne L.; Englander S. W.; Woods V. L. (2005) Structure and properties of α-synuclein and other amyloids determined at the amino acid level. Proc. Natl. Acad. Sci. U.S.A. 102, 15477–15482. [DOI] [PMC free article] [PubMed] [Google Scholar]
- Kheterpal I.; Wetzel R. (2006) Hydrogen/Deuterium Exchange Mass Spectrometry Window into Amyloid Structure. Acc. Chem. Res. 39, 584–593. [DOI] [PubMed] [Google Scholar]
- Lu X.; Wintrode P. L.; Surewicz W. K. (2007) β-Sheet core of human prion protein amyloid fibrils as determined by hydrogen/deuterium exchange. Proc. Natl. Acad. Sci. U.S.A. 104, 1510–1515. [DOI] [PMC free article] [PubMed] [Google Scholar]
- Walters B. T.; Ricciuti A.; Mayne L.; Englander S. W. (2012) Minimizing Back Exchange in the Hydrogen Exchange-Mass Spectrometry Experiment. J. Am. Soc. Mass Spectrom. 23, 2132–2139. [DOI] [PMC free article] [PubMed] [Google Scholar]
- Skora L.; Fonseca-Ornelas L.; Hofele R. V.; Riedel D.; Giller K.; Watzlawik J.; Schulz-Schaeffer W. J.; Urlaub H.; Becker S.; Zweckstetter M. (2013) Burial of the Polymorphic Residue 129 in Amyloid Fibrils of Prion Stop Mutants. J. Biol. Chem. 288, 2994–3002. [DOI] [PMC free article] [PubMed] [Google Scholar]
- Sharp J. S.; Becker J. M.; Hettich R. L. (2004) Analysis of Protein Solvent Accessible Surfaces by Photochemical Oxidation and Mass Spectrometry. Anal. Chem. 76, 672–683. [DOI] [PubMed] [Google Scholar]
- Hambly D. M.; Gross M. L. (2005) Laser flash photolysis of hydrogen peroxide to oxidize protein solvent-accessible residues on the microsecond timescale. J. Am. Soc. Mass Spectrom. 16, 2057–2063. [DOI] [PubMed] [Google Scholar]
- Conchillo-Sole O.; de Groot N.; Aviles F.; Vendrell J.; Daura X.; Ventura S. (2007) AGGRESCAN: A server for the prediction and evaluation of “hot spots” of aggregation in polypeptides. BMC Bioinf. 8, 65. [DOI] [PMC free article] [PubMed] [Google Scholar]
- Trovato A.; Seno F.; Tosatto S. C. E. (2007) The PASTA server for protein aggregation prediction. Protein Eng., Des. Sel. 20, 521–523. [DOI] [PubMed] [Google Scholar]
- Maurer-Stroh S.; Debulpaep M.; Kuemmerer N.; de la Paz M. L.; Martins I. C.; Reumers J.; Morris K. L.; Copland A.; Serpell L.; Serrano L.; Schymkowitz J. W. H.; Rousseau F. (2010) Exploring the sequence determinants of amyloid structure using position-specific scoring matrices. Nat. Methods 7, 237–242. [DOI] [PubMed] [Google Scholar]
- Goldschmidt L.; Teng P. K.; Riek R.; Eisenberg D. (2010) Identifying the amylome, proteins capable of forming amyloid-like fibrils. Proc. Natl. Acad. Sci. U.S.A. 107, 3487–3492. [DOI] [PMC free article] [PubMed] [Google Scholar]
- O’Donnell C. W.; Waldispühl J.; Lis M.; Halfmann R.; Devadas S.; Lindquist S.; Berger B. (2011) A method for probing the mutational landscape of amyloid structure. Bioinformatics 27, i34–i42. [DOI] [PMC free article] [PubMed] [Google Scholar]
- Tian J.; Wu N.; Guo J.; Fan Y. (2009) Prediction of amyloid fibril-forming segments based on a support vector machine. BMC Bioinf. 10, S45. [DOI] [PMC free article] [PubMed] [Google Scholar]
- Ye Z.; French K. C.; Popova L. A.; Lednev I. K.; Lopez M. M.; Makhatadze G. I. (2009) Mechanism of Fibril Formation by a 39-Residue Peptide (PAPf39) from Human Prostatic Acidic Phosphatase. Biochemistry 48, 11582–11591. [DOI] [PubMed] [Google Scholar]
- Sabatté J.; Lenicov F. R.; Cabrini M.; Rodrigues C. R.; Ostrowski M.; Ceballos A.; Amigorena S.; Geffner J. (2011) The role of semen in sexual transmission of HIV: Beyond a carrier for virus particles. Microbes Infect. 13, 977–982. [DOI] [PubMed] [Google Scholar]
- Bouvet J.-P.; Grésenguet G.; Bélec L. (1997) Vaginal pH neutralization by semen as a cofactor of HIV transmission. Clin. Microbiol. Infect. 3, 19–23. [DOI] [PubMed] [Google Scholar]
- Atashili J.; Poole C.; Ndumbe P. M.; Adimora A. A.; Smith J. S. (2008) Bacterial vaginosis and HIV acquisition: A meta-analysis of published studies. AIDS 22, 1493–1501. [DOI] [PMC free article] [PubMed] [Google Scholar]
- Margittai M.; Langen R. (2004) Template-assisted filament growth by parallel stacking of tau. Proc. Natl. Acad. Sci. U.S.A. 101, 10278–10283. [DOI] [PMC free article] [PubMed] [Google Scholar]
- Wasmer C.; Lange A.; Van Melckebeke H.; Siemer A. B.; Riek R.; Meier B. H. (2008) Amyloid Fibrils of the HET-s(218–289) Prion Form a β Solenoid with a Triangular Hydrophobic Core. Science 319, 1523–1526. [DOI] [PubMed] [Google Scholar]
- Kajava A. V.; Baxa U.; Wickner R. B.; Steven A. C. (2004) A model for Ure2p prion filaments and other amyloids: The parallel superpleated β-structure. Proc. Natl. Acad. Sci. U.S.A. 101, 7885–7890. [DOI] [PMC free article] [PubMed] [Google Scholar]
- Kajava A. V.; Baxa U.; Steven A. C. (2010) β arcades: Recurring motifs in naturally occurring and disease-related amyloid fibrils. FASEB J. 24, 1311–1319. [DOI] [PMC free article] [PubMed] [Google Scholar]
- Mizuno N.; Baxa U.; Steven A. C. (2011) Structural dependence of HET-s amyloid fibril infectivity assessed by cryoelectron microscopy. Proc. Natl. Acad. Sci. U.S.A. 108, 3252–3257. [DOI] [PMC free article] [PubMed] [Google Scholar]
- Der-Sarkissian A.; Jao C. C.; Chen J.; Langen R. (2003) Structural Organization of α-Synuclein Fibrils Studied by Site-directed Spin Labeling. J. Biol. Chem. 278, 37530–37535. [DOI] [PubMed] [Google Scholar]
- Kajava A. V.; Aebi U.; Steven A. C. (2005) The Parallel Superpleated β-structure as a Model for Amyloid Fibrils of Human Amylin. J. Mol. Biol. 348, 247–252. [DOI] [PubMed] [Google Scholar]
- Wang J.; Gülich S.; Bradford C.; Ramirez-Alvarado M.; Regan L. (2005) A Twisted Four-Sheeted Model for an Amyloid Fibril. Structure 13, 1279–1288. [DOI] [PubMed] [Google Scholar]
- Hennetin J.; Jullian B.; Steven A. C.; Kajava A. V. (2006) Standard Conformations of β-Arches in β-Solenoid Proteins. J. Mol. Biol. 358, 1094–1105. [DOI] [PubMed] [Google Scholar]
- Chou K.-C. (2000) Prediction of Tight Turns and Their Types in Proteins. Anal. Biochem. 286, 1–16. [DOI] [PubMed] [Google Scholar]
- Arnold F.; Schnell J.; Zirafi O.; Stürzel C.; Meier C.; Weil T.; Ständker L.; Forssmann W.-G.; Roan N. R.; Greene W. C.; Kirchhoff F.; Münch J. (2012) Naturally Occurring Fragments from Two Distinct Regions of the Prostatic Acid Phosphatase Form Amyloidogenic Enhancers of HIV Infection. J. Virol. 86, 1244–1249. [DOI] [PMC free article] [PubMed] [Google Scholar]
Associated Data
This section collects any data citations, data availability statements, or supplementary materials included in this article.