

Abstract
Insulin governs systemic glucose metabolism, including glycolysis, gluconeogenesis and glycogenesis, through temporal change and absolute concentration. However, how insulin-signalling pathway selectively regulates glycolysis, gluconeogenesis and glycogenesis remains to be elucidated. To address this issue, we experimentally measured metabolites in glucose metabolism in response to insulin. Step stimulation of insulin induced transient response of glycolysis and glycogenesis, and sustained response of gluconeogenesis and extracellular glucose concentration (GLCex). Based on the experimental results, we constructed a simple computational model that characterises response of insulin-signalling-dependent glucose metabolism. The model revealed that the network motifs of glycolysis and glycogenesis pathways constitute a feedforward (FF) with substrate depletion and incoherent feedforward loop (iFFL), respectively, enabling glycolysis and glycogenesis responsive to temporal changes of insulin rather than its absolute concentration. In contrast, the network motifs of gluconeogenesis pathway constituted a FF inhibition, enabling gluconeogenesis responsive to absolute concentration of insulin regardless of its temporal patterns. GLCex was regulated by gluconeogenesis and glycolysis. These results demonstrate the selective control mechanism of glucose metabolism by temporal patterns of insulin.
Keywords: computational model, glucose metabolism, insulin, network motif, temporal coding
Introduction
Insulin is the only hormone that lowers the concentration of blood glucose (Yki-Jarvinen, 1993; Saltiel and Kahn, 2001) by regulating hepatic glucose metabolism, including the glycolysis, gluconeogenesis and glycogenesis pathways (Pessin and Saltiel, 2000; Whiteman et al, 2002). Glycolysis is the pathway by which glucose degrades into lactate (LAC), gluconeogenesis is the pathway by which glucose is generated from pyruvate and/or LAC, and glycogenesis is the pathway by which glycogen is synthesised from glucose (Nordlie et al, 1999). Glycolysis is regulated by a key bifunctional enzyme, 6-phosphofructo-2-kinase/fructose-2,6-bisphosphatase 1 (PFKFB1) (Pilkis et al, 1983; Okar et al, 2001). Insulin dephosphorylates phosphorylated-PFKFB1 (pPFKFB1) and activates its kinase activity, thereby promoting glycolysis (Probst and Unthan-Fechner, 1985). Although the mechanism by which insulin regulates PFKFB1 remains unclear, the insulin-dependent activation of an unidentified protein phosphatase presumably induces the dephosphorylation of pPFKFB1 (Pilkis et al, 1995; Okar et al, 2004). Gluconeogenesis is regulated by the protein abundance of two major rate-limiting enzymes that are involved in hepatic gluconeogenesis: phosphoenolpyruvate carboxykinase (PEPCK) and glucose-6-phosphatase (G6Pase) (Barthel and Schmoll, 2003; Yabaluri and Bashyam, 2010). Insulin reduces the protein abundance of PEPCK and G6Pase through the AKT-signalling pathway, which leads to the suppression of gluconeogenesis (Sutherland et al, 1996; Nakae et al, 1999; Saltiel and Kahn, 2001; Whiteman et al, 2002). Glycogenesis is regulated by a balance of the enzymatic activities of glycogen synthase (GS) and glycogen phosphorylase (GP) (Bollen et al, 1998; Roach et al, 2001). Insulin promotes glycogenesis by dephosphorylation and activation of GS and/or by dephosphorylation and inactivation of GP via the AKT-signalling pathway (Srivastava and Pandey, 1998; Whiteman et al, 2002; Aiston et al, 2006). The GS activity is also allosterically activated by glucose-6-phosphate (G6P) through dephosphorylation of GS (Villar-Palasi and Guinovart, 1997), and the GP activity is allosterically inhibited by intracellular glucose (GLCin) or G6P through dephosphorylation of GP (Johnson, 1992; Aiston et al, 2003). In addition, glucokinase (GK) is a rate-limiting enzyme for glucose utilisation in the liver (Ferre et al, 1996) through glucose phosphorylation. Insulin upregulates the expression of GK via the AKT-signalling pathway (Iynedjian et al, 2000; Ribaux and Iynedjian, 2003) and the activity of GK is also regulated by interaction with its regulatory protein (Van Schaftingen et al, 1994). Many studies have also been done to elucidate hepatic glucose metabolism by use of metabolomic approach (Soga et al, 2006; Scribner et al, 2010; Massimi et al, 2012; Watanabe et al, 2012). However, how the above signalling pathways regulate glucose metabolism at system level has thus far not been examined.
Blood insulin exhibits several temporal patterns, such as additional secretion (which is a transient increase of insulin in response to meals) and basal secretion (which is the sustained low secretion of insulin during fasting) (Polonsky et al, 1988b; Lindsay et al, 2003). Such temporal insulin patterns have been reported to have an important physiological role in the regulation of metabolism (Polonsky et al, 1988b, 1998). The relevance of insulin secretion abnormalities in the pathogenesis of type 2 diabetes mellitus has been recognised as important for the optimisation of the action of insulin on target tissues (Bruce et al, 1988; Polonsky et al, 1988a; Pratley and Weyer, 2001; Del Prato, 2003). These observations indicate that insulin selectively regulates metabolic processes depending on its temporal pattern. Among the target organs of insulin (liver, skeletal muscle and adipose tissue), the temporal patterns of insulin particularly affect metabolism in the liver because the temporal patterns of insulin are most evident in the portal vein, which delivers blood from the pancreas to the liver. We have previously found that additional and basal secretion-like temporal patterns of insulin selectively regulate glycogen synthase kinase-3β (GSK3β, which in turn regulates glycogenesis) and G6Pase (which regulates gluconeogenesis) in FAO rat hepatoma cells through multiplexing of the AKT-signalling pathway (Kubota et al, 2012; Purvis and Lahav, 2012). These findings demonstrate that the AKT-signalling pathway can code temporal insulin patterns for the selective regulation of downstream metabolic enzymes. However, the mechanisms by which these temporal insulin patterns selectively regulate glycolysis, gluconeogenesis and glycogenesis have not yet been examined.
In this study, we measured glucose metabolism in insulin-stimulated FAO rat hepatoma cells, which show a similar signalling response to insulin as that observed in primary hepatocytes (Kubota et al, 2012). To extract the essential mechanism by which insulin selectively controls glucose metabolism, we used a simple and abstract computational model rather than a detailed biochemical model. We found that glycolysis and glycogenesis respond to temporal insulin changes whereas gluconeogenesis responds to the absolute insulin concentration. In addition, these responses occur through different networks motifs. These results demonstrate the mechanism for the selective control of glucose metabolism by temporal insulin patterns.
Results
Control of insulin-dependent glucose metabolism through the AKT-signalling pathway
We stimulated FAO cells with an insulin step stimulation, and measured intracellular and extracellular metabolites and proteins that are involved in the glucose metabolism that is controlled through the AKT-signalling pathway in response to insulin (Figure 1). Nine intracellular metabolites and extracellular pyruvate (PYRex) were measured by capillary electrophoresis coupled to time-of-flight mass spectrometry (CE-TOF-MS). The extracellular glucose concentration (GLCex) and the intracellular glycogen content were also measured by the use of enzymatic assays (see Materials and methods). Insulin induced a gradual decrease of GLCex, which is the final output of glucose metabolism and regulated by a balance between glycolysis, gluconeogenesis and glycogenesis (Figure 1). In the glycolysis and gluconeogenesis pathways, insulin induced a transient response in fructose-1,6-bisphosphate (F16P), dihydroxyacetone phosphate (DHAP), 2,3-diphosphoglycerate (2,3-DPG), 3-phosphoglycerate (3-PG) and phosphoenolpyruvate (PEP), and induced a sustained increase in intracellular LAC. In contrast, in the glycogenesis pathway, insulin induced a transient response in glucose-1-phosphate (G1P), UDP-glucose (UDPG) and glycogen. We found that there were the two clusters of highly correlated neighbouring metabolites in the glycolysis pathway and glycogenesis pathways (Figure 1, dotted blue box).
Figure 1.
Insulin-dependent glucose metabolism. The changes in the indicated intracellular and extracellular metabolites, as well as pAKT, PEPCK, G6Pase, GK, pGS and pGP were measured in response to an insulin step stimulation. The black, green and red lines indicate the insulin concentrations used (0, 1 and 100 nM, respectively). The mean values and SEMs of four (pAKT, PEPCK, G6Pase, GK, pGS and pGP) and three (GLCex and glycogen) independent experiments are shown. The values at t=0 measured by CE-TOF-MS were obtained in triplicate, and the mean values and SEMs of these are indicated at t=0 using a blue dot and blue line, respectively. Highly correlated (Pearson’s correlation coefficient, r>0.63) neighbouring metabolites are surrounded by a dotted blue box. The metabolites inside and outside of the black box are the intracellular and extracellular metabolites, respectively. Note that G6P at some time points were under the detection limit of CE-TOF-MS and were not shown in Figure 1, and that only the time course data of glycogen in response to 0 and 1 nM of insulin are shown because that to 100 nM insulin showed a high variation between experiments (see Materials and Methods). PYRin, intracellular pyruvate. Source data for this figure is available on the online supplementary information page.

We also measured the phosphorylation of AKT and the glycogenic metabolic enzymes, including GS and GP, as well as the protein abundance of PEPCK and G6Pase (Figure 1). Insulin induced a transient and sustained phosphorylation of AKT, which is consistent with previous observations (Kubota et al, 2012). In the gluconeogenesis pathway, insulin induced a gradual and continuous suppression of PEPCK. In the glycogenesis pathway, the phosphorylation of GS was not altered by insulin (Figure 1). However, the amount of glycogen increased in response to insulin, which means that the increase of glycogen is not mediated by the phosphorylation of GS at Ser641, which is an important phosphorylation site for the regulation of glycogenesis by insulin via pAKT (Skurat and Roach, 1995), in our system; therefore, an additional mechanism is required to explain this increase in the glycogen. The phosphorylation of GP gradually and continuously increased in response to insulin. We measured G6Pase, which is another rate-limiting enzyme involved in gluconeogenesis, but were not able to determine whether G6Pase decreased in response to insulin because of the large variation obtained between experiments (Figure 1). In addition, the protein abundance of GK was not changed by insulin (Figure 1). Thus, an insulin step stimulation induced a variety of temporal patterns in the signalling molecules, enzymes and metabolites, thereby highlighting the complexity of the insulin-induced regulation of glucose metabolism.
Computational model of insulin-dependent glucose metabolism
We developed a computational model of insulin-dependent glucose metabolism (Supplementary Figure 1, see Materials and methods) and examined how insulin regulates glycolysis, gluconeogenesis and glycogenesis (Figure 2A). We tried to extract the essential and simple characteristics of insulin-dependent glucose metabolism rather than describing detailed metabolic reactions by developing abstract model by aggregating the two clusters of the highly correlated neighbouring metabolites. We aggregated G1P and UDPG into a single variable, ‘G1P’, which is a major entry point for glycogenesis (Figure 1, dotted blue box). We also aggregated F16P, DHAP, DPG, 3-PG and PEP into a single variable ‘F16P’, which has been reported to be directly regulated by insulin through PFKFB1 and is thought to be a key factor in the glycolysis regulation by insulin (Figure 1, dotted blue box). In addition, we aggregated the undetected neighbouring metabolites, GLCin and G6P, into a single abstract variable, G6P. For simplification, G6Pase, GS and GK were not incorporated into the model because they were not changed by insulin in FAO cells (Figure 1, see Discussion). Although insulin regulates glucose metabolism, the details of the signalling pathways involved remain unclear. As AKT has been shown to have a major role in insulin signalling (Whiteman et al, 2002), we assumed that insulin regulates glucose metabolism via AKT. We used our previous computational model for the activation of AKT by insulin (Kubota et al, 2012) and slightly modified the parameters to fit the experimental data obtained in this study (Supplementary Figure 1H, see Materials and methods). We newly constructed the AKT-dependent glucose metabolism model, in which phosphorylated AKT (pAKT) was assumed to suppress PEPCK and facilitate the conversion of G6P to F16P, which in turn activates PFKFB1 (Supplementary Figure 1A). GLCin or G6P induces the dephosphorylation of GP via the allosteric regulation of phosphorylase phosphatase. We assumed that G6P facilitates the dephosphorylation of phosphorylated GP (pGP). The upstream G1P also exhibited a transient increase similar to that observed with glycogen, which suggests that a metabolic enzyme upstream of G1P is activated by insulin, rather than the metabolic enzyme between G1P and glycogen. We therefore assumed that some metabolite upstream of G1P is regulated by insulin via pAKT. We then connected the AKT-dependent glucose metabolism model to the insulin-dependent AKT pathway model. The connected model is hereafter denoted as the insulin-dependent glucose metabolism model (Supplementary Figure 1). We estimated the parameters of the insulin-dependent glucose metabolism model based on the experimental data shown in Figures 1 and 3A. The model appeared to reproduce the essential characteristics of the experimental results shown in Figure 2B (Figure 2A). Importantly, pAKT exhibited a transient and sustained increase (Figure 2A). In the glycolysis pathway, F16P showed a transient and adaptive response (Figure 2A). In the glycogenesis pathway, G1P and glycogen also showed both transient and adaptive responses similar to F16P (Figure 2A). In contrast, in the gluconeogenesis pathway, PEPCK exhibited a gradual and sustained decrease (Figure 2A). This decrease in PEPCK resulted in the increase of OAA (oxaloacetate) and LAC through the inhibition of the conversion of OAA to F16P and suppressed gluconeogenesis, resulting in decreases of G6P and GLCex (Figure 2A). We next examined the network structures of the pathways by specific deletion of reactions in simulations, and found that the network motif of glycolysis is a feedforward (FF) with substrate depletion, that of gluconeogenesis is a FF and that of glycogenesis is an incoherent feedforward loop (iFFL) (Supplementary Figure 2, see also Figure 6 and Table 1). We also found that GLCex is mainly regulated by gluconeogenesis and glycolysis, but not by glycogenesis (Supplementary Figure 2).
Figure 2.

The computational model of insulin-dependent glucose metabolism. (A) Time courses of the metabolites and enzymes in response to insulin in the insulin-dependent glucose metabolism model (Supplementary Figure 1). The black, green and red lines indicate the insulin concentrations used (0, 1 and 100 nM, respectively). (B) Time courses of the metabolites and enzymes in response to insulin. All data shown are the same as Figure 1, and only the metabolites and enzymes incorporated into the model are shown for comparison. The black, green and red lines indicate the insulin concentrations used (0, 1 and 100 nM, respectively).
Figure 3.
The effect of insulin pulse stimulation on glucose metabolism. (A) Time courses of pAKT, F16P, PEPCK, glycogen and GLCex in response to a 10-min pulse stimulation (blue), a step stimulation (red) and 0 nM (black) of insulin in FAO cells. The mean values and SEMs of three independent experiments are shown. The doses and duration of the insulin stimulations are shown at the bottom. (B) Time courses of pAKT, PEPCK, glycogen, GLCex and F16P in response to a 10-min pulse stimulation of the insulin-dependent glucose metabolism model. Source data for this figure is available on the online supplementary information page.

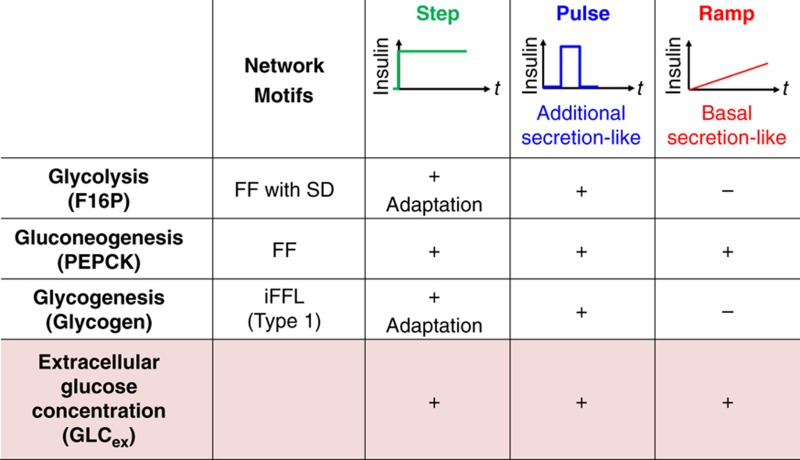
Table 1. Insulin selectively controls glycolysis, gluconeogenesis, glycogenesis and the extracellular glucose concentration via their network motifs.
|
Abbreviations: FF, feedfoward; FF with s.d., feedforward with substrate depletion; iFFL, incoherent feedforward loop.
A high responsiveness to the indicated stimulations is represented by ‘+’, and a low responsiveness is represented by ‘−’. The network motif of glycogenesis forms an Incoherent Type 1 motif (Mangan and Alon, 2003) (Supplementary Figure 4).
Glucose metabolism in response to a pulse stimulation of insulin
We next examined how the in vivo-like temporal patterns of insulin selectively regulate glucose metabolism. Insulin secretion has two major temporal patterns in vivo: additional secretion, which is a rapid transient secretion, and basal secretion, which is a slow sustained secretion (Polonsky et al, 1988b). We first experimentally used the additional secretion-like stimulation through a pulse stimulation and examined the responses of pAKT, GLCex, PEPCK and glycogen (Figure 3A). In this study, we used F16P, PEPCK and glycogen as markers of glycolysis, gluconeogenesis and glycogenesis, respectively. As the availability of CE-TOF-MS was limited and no quantitative enzymatic assay exists for the detection of F16P, we were only able to characterise glycolysis in simulations. We found that pAKT exhibited only a transient response to the pulse stimulation, whereas it exhibited both transient and sustained responses to the step stimulation (Figure 3A), which is consistent with our previous results (Kubota et al, 2012). In contrast, GLCex, PEPCK and glycogen showed similar responses in response to both the pulse and the step stimulations of insulin (Figure 3A). As pAKT did not exhibit a sustained response to the pulse stimulation, it can be deduced that GLCex, PEPCK and glycogen do not require a sustained pAKT signal and that a transient pAKT signal is sufficient to suppress gluconeogenesis, lower GLCex, and induce glycogenesis.
We computationally simulated the responses to the pulse stimulation (Figure 3B) and reproduced the transient response of pAKT, the sustained responses of GLCex and PEPCK, and the transient response of glycogen. Moreover, GLCex, PEPCK and glycogen showed similar temporal patterns in response to the step and the pulse stimulations. Thus, the model can capture the essential characteristics of the responses to the pulse stimulation, indicating that the model was able to predict the responses to the pulse stimulation. F16P exhibited a transient and adaptive response to both the step and pulse stimulations of insulin.
Glucose metabolism in response to a ramp stimulation of insulin
We next experimentally used the basal secretion-like stimulation of insulin through a ramp stimulation and examined the responses of pAKT, GLCex, PEPCK and glycogen (Figure 4A). We found that pAKT exhibited only a sustained response to the ramp stimulation, whereas it exhibited both transient and sustained responses to the step stimulation. In contrast, GLCex and PEPCK showed similar sustained responses in response to both the pulse and the step stimulations of insulin (Figure 4A). As pAKT did not exhibit a transient response to the ramp stimulation, it can be deduced that GLCex and PEPCK do not require a transient pAKT signal and that a sustained pAKT signal is sufficient to suppress gluconeogenesis and lower GLCex. Taken together with the result in Figure 3, either transient or sustained pAKT signal alone is sufficient to trigger the sustained suppressions of gluconeogenesis and GLCex. Moreover, considering that GLCex and PEPCK always show a similar sustained response, PEPCK is likely to mainly contribute to the regulation of GLCex by insulin. In contrast, glycogen did not respond to the ramp stimulation of insulin in spite of the transient response to the step stimulation. Given that pulse and ramp stimulation resemble the additional and basal secretion of insulin in vivo, respectively, these results demonstrate that GLCex and gluconeogenesis can respond to both additional and basal secretion of insulin, whereas glycogenesis selectively responds to additional secretion of insulin.
Figure 4.
The effect of insulin ramp stimulation on glucose metabolism. (A) Time courses of pAKT, F16P, PEPCK, glycogen and GLCex in response to a step stimulation (red), a ramp stimulation (blue) and 0 nM (black) of insulin in FAO cells. The mean values and SEMs of three independent experiments are shown. The step and ramp stimulations of insulin are shown at the bottom. The final concentrations of step and ramp stimulation of insulin were set at 0.1 nM, which mimics the basal secretion of insulin in vivo (Polonsky et al, 1988b; Basu et al, 1996). Note that the scale of absolute concentration of GLCex was normalised because of the variation between experiments. (B) Time courses of pAKT, PEPCK, glycogen, GLCex and F16P in response to a ramp stimulation of the insulin-dependent glucose metabolism model. Source data for this figure is available on the online supplementary information page.

We computationally predicted the responses to the ramp stimulation (Figure 4B) and reproduced the sustained response of pAKT, the sustained responses of GLCex and PEPCK, and no response of glycogen. Moreover, GLCex and PEPCK showed similar sustained patterns in response to the step and the ramp stimulations. Thus, the model can capture the essential characteristics of the responses to the ramp stimulation, indicating that the model was able to predict the responses to the ramp stimulation. F16P did not respond to the ramp stimulations of insulin in the model, suggesting that glycolysis selectively responds to additional secretion of insulin.
We then computationally examined the sensitivity of glycolysis, gluconeogenesis and glycogenesis to the rate of insulin increase (Supplementary Figure 3), and confirmed that transient responses of pAKT, glycogen and F16P were sensitive to the rate of insulin increase, whereas sustained responses of pAKT, GLCex and PEPCK were insensitive to that.
Taken together, these results suggest that glycolysis and glycogenesis respond to temporal changes of insulin concentration, whereas gluconeogenesis and GLCex respond to the absolute insulin concentration but not to its temporal changes.
Sensitivity of glycolysis, gluconeogenesis and glycogenesis to the concentration of insulin
We next examined the sensitivity of glycolysis, gluconeogenesis and glycogenesis to the concentration of insulin using step stimulations with different concentrations of insulin (Figure 5). We graphed the amplitude of the molecules at the transient peak and at the final time point in the simulation, the latter of which is a marker for the sustained phase, against the insulin concentration used (Figure 5B, solid lines), and then we experimentally validated the simulated results (Figure 5B, dots). pAKT at the transient peak and at final time point gradually increased against the insulin concentration, indicating that pAKT can code information over a wide dynamic range of insulin concentrations in both transient and sustained phases. Glycogen and F16P at the transient peak increased gradually against insulin concentration, indicating that insulin can regulate glycogenesis and glycolysis over a wide dynamic range. In contrast, glycogen and F16P at the final time point showed a flat curve against the insulin concentration, indicating that glycogen and F16P exhibit adaptation. PEPCK and GLCex exhibited an abrupt decrease against insulin concentration. PEPCK and GLCex at the early time point showed a flat curve against insulin concentration. The EC50s of insulin, which give 50% of the maximal responses, were 0.013 nM for PEPCK, 0.085 nM for GLCex, 0.55 nM for F16P and 0.79 nM for glycogen in the simulation. This result indicates that PEPCK and GLCex show higher sensitivity to insulin than F16P and glycogen. The similar high sensitivity of both PEPCK and GLCex suggests that GLCex is mainly regulated by PEPCK at low doses of insulin. In summary, step stimulation of insulin induced the transient and sustained response of pAKT, the transient and adaptive responses of F16P and glycogen, and the sustained responses of PEPCK and GLCex. The transient responses of pAKT, F16P and glycogen showed low sensitivity to insulin, whereas the sustained responses of PEPCK and GLCex showed high sensitivity to insulin.
Figure 5.

The sensitivity of pAKT, F16P, PEPCK, glycogen and GLCex to the insulin concentration. (A) Insulin concentration-dependent responses of pAKT, F16P, PEPCK, glycogen and GLCex obtained from the simulated model. The concentrations of insulin used are indicated using colours. Black lines indicate the responses of the molecules without stimulation of insulin. (B) Dose–response curves of pAKT, F16P, PEPCK, glycogen and GLCex at the final time point (red line), and those of pAKT, glycogen and F16P at the transient peaks, and PEPCK and GLCex at the early time point (at 30 min) (blue line). Note that the scale of absolute concentration of GLCex was normalised because of the variation between experiments. EC50s of glycogen at the transient peak, F16P at the transient peak, PEPCK at the final time point and GLCex at the final time point are shown. All EC50s were numerically calculated by the use of the simulated data (solid lines).
Discussion
Mechanism of the insulin-dependent regulation of glucose metabolism in the model are summarised in Figure 6 and Table 1. F16P is regulated through a FF activation by the pAKT-dependent conversion of G6P to F16P and the substrate depletion of glucose (Figure 6, orange), which makes glycolysis responsive to temporal changes in the concentration of insulin rather than its absolute concentration. The pAKT-dependent suppression of PEPCK indicates FF inhibition with the small EC50 and large time constant, which makes gluconeogenesis responsive to absolute concentration of insulin regardless of its temporal patterns (Figure 6, pink). The 3-node network of pAKT, PEPCK and F16P also forms an Incoherent Type 4 motif with substrate depletion (Supplementary Figure 4) (Mangan and Alon, 2003). Glycogen is regulated by an iFFL that consists of activation via the pAKT-dependent production of G1P (Figure 6, cyan) and inhibition via the G6P-dependent inhibition of pGP, which makes glycogenesis responsive to temporal changes of insulin rather than its absolute concentration. (Figure 6, cyan). The network motif of glycogen regulation by insulin via pAKT also forms an Incoherent Type 1 motif (Supplementary Figure 4) (Mangan and Alon, 2003), that have been known to show an adaptive response and responsiveness to the fold change of the input signal rather than the absolute levels of the input signal (Goentoro et al, 2009). GLCex is regulated by gluconeogenesis and glycolysis, which makes GLCex responsive to all of the stimulation patterns of insulin, such as step, pulse and ramp stimulation. In conclusion, temporal patterns of insulin selectively regulate glucose metabolism through the distinct network motifs (Table 1). Step stimulation of insulin induces the transient and adaptive responses of glycolysis via F16P through a FF with substrate depletion, the transient and adaptive responses of gluconeogenesis via PEPCK through a FF inhibition and the sustained response of glycogenesis through an incoherent FF loop (Table 1). Pulse stimulation of insulin induces responses of glycolysis, gluconeogenesis and glycogenesis. Ramp stimulation of insulin induces only the response of gluconeogenesis (via PEPCK), but not those of glycolysis (via F16P) and glycogenesis. Glycolysis and glycogenesis showed the similar responsiveness to step, pulse and ramp stimulation of insulin despite their different network motifs. In this study, we assumed that pAKT controls glucose metabolism based on the fact that pAKT show the essential role in hepatic glucose metabolism (Saltiel and Kahn, 2001; Whiteman et al, 2002). However, it remains to be clarified whether pAKT directly controls glucose metabolism, and further study is necessary to identify detailed molecular mechanism of glucose metabolism.
Figure 6.

Selective control mechanisms of the glycolysis, gluconeogenesis and glycogenesis in the insulin-dependent glucose metabolism model. The responses of pAKT, F16P, PEPCK, glycogen and GLCex to step (green), pulse (blue) and ramp (red) stimulations of insulin are shown. Glycolysis (F16P) responds to temporal insulin changes (step and pulse stimulations) via FF activation and substrate depletion (orange). Gluconeogenesis (PEPCK) responds to the absolute insulin concentration (step, pulse and ramp stimulations) via FF inhibition (pink). Glycogenesis (glycogen) responds to temporal insulin changes (step and pulse stimulations) via an incoherent feedforward loop (iFFL) (cyan). GLCex responds to all insulin stimulations via gluconeogenesis and glycolysis. Note that pAKT-to-pGP connection in the iFFL for the glycogenesis pathway forms a complicated structure by multiple components, such as F16P and PEPCK.
Considering that the additional and basal secretions of insulin correspond to the pulse and ramp stimulations used in this study, respectively, glycolysis and glycogenesis selectively respond to additional secretion and gluconeogenesis responds to both additional and basal secretions. This finding suggests that glycolysis and glycogenesis might be induced selectively during the postprandial elevation of blood glucose concentrations through the additional secretion of insulin and might be adapted when the blood glucose concentration returns to its basal level. This suggests that glycogenesis may be induced immediately after meals, when the blood glucose concentration is high, and may be tightly and precisely controlled over a wide range of insulin concentrations. Glycogenesis did not contribute to the regulation of GLCex, likely because of the experimental conditions used in our study. We used glucose starvation to observe the changes in the GLCex (see Materials and methods), which may lead to an extreme decrease in glycogen at the basal level. Therefore, the contribution of glycogenesis to extracellular glucose regulation may be underestimated.
Gluconeogenesis was more sensitive to the concentration of insulin. This result suggests that gluconeogenesis may be induced only when blood glucose and insulin concentrations are low for long periods, such as during fasting and overnight, and is tightly inhibited by the additional secretion that occurs when insulin is triggered by high postprandial glucose concentrations. This conclusion is consistent with our previous observation (Kubota et al, 2012).
The inhibition of hepatic glucose release by insulin in vivo has been reported to be more rapid (∼15 min) (Sindelar et al, 1997; Grubert et al, 2005). However, the decrease in GLCex exhibited a slower response with a time constant of ∼1 h. The regulation of gene and protein expression levels generally has a time constant on the order of hours (Papin et al, 2005; Alon, 2007). In fact, we confirmed that the protein expression of PEPCK in the rat liver in response to the addition of oral glucose did not change over at least 2 h. Thus, the rapid inhibition of hepatic glucose release in vivo is probably regulated by a different rapid regulation mechanism, such as the post-translational modification of enzymes in the glycolysis pathway.
Both G6Pase and PEPCK are the rate-limiting enzymes for gluconeogenesis, and share the feedfoward motifs (Kubota et al, 2012) (Figure 6). However, G6Pase cannot sufficiently respond to an insulin pulse stimulation (Kubota et al, 2012), whereas PEPCK can (Figure 3A). The reason why only PEPCK can respond to an insulin pulse stimulation is its smaller EC50 and the larger apparent time constant compared with those of G6Pase (Supplementary Figure 5); increasing the EC50 of PEPCK or decreasing the apparent time constant of PEPCK made PEPCK unresponsive to an insulin pulse stimulation (Supplementary Figure 5). Moreover, we previously found that GSK3β, which is a signalling molecule for glycogenesis, shows a transient and sustained response to an insulin step stimulation (Kubota et al, 2012); whereas in this study, we found that the phosphorylation of GS at Ser641, which is the direct downstream molecule of GSK3β, is not changed by insulin stimulation. This suggests that GSK3β may not be involved in glycogenesis under the conditions used in FAO cells.
In this study, we demonstrate that temporal insulin patterns selectively regulate gluconeogenesis, glycogenesis and glycolysis via the AKT-signalling pathway in FAO hepatoma cells. Although we previously confirmed that FAO cells show a similar signalling response to insulin as that observed in primary hepatocytes (Kubota et al, 2012), some metabolic responses may be different between FAO cells and primary hepatocytes. For example, GK was not incorporated into the current model, because the protein abundance of GK was not changed by insulin (Figure 1) and the activity of GK in FAO cells has been reported to be much lower than that in primary hepatocytes (Argaud et al, 1997); however, GK is considered to be a rate-limiting enzyme for glucose utilisation in vivo (Ferre et al, 1996), and therefore, the effect of GK should be incorporated into the in vivo model. In addition, GS, which is considered to be responsible for glycogen synthesis in vivo (Skurat and Roach, 1995; Villar-Palasi and Guinovart, 1997), was also not incorporated into the current model because the important phosphorylation site of GS (Ser641) for glycogenesis regulation (Skurat and Roach, 1995) was not changed by insulin. Further study is necessary to address whether the temporal insulin patterns are used to selectively regulate hepatic glucose metabolism in vivo.
Materials and methods
Cell culture and treatments
For the assays, FAO cells were seeded at a density of 3.0 × 10⁶ cells in 6-cm dishes (Corning) and cultured in RPMI 1640 supplemented with 10% (v/v) fetal bovine serum for 2 days before starvation. The cells were washed twice with 4 ml of phosphate-buffered saline (PBS) and starved in 4 ml of glucose- and serum-free DMEM (Sigma) (containing 20 mM sodium lactate (Sigma) and 2 mM sodium pyruvate (Sigma) as the gluconeogenic substrates) with 10 nM dexamethasone (Wako) for 16 h in the incubator. The cells that had been seeded in the 6-cm dishes were stimulated through the addition of stimulant solutions containing the indicated concentrations of insulin and 0.01% BSA. In the pulse stimulation experiment, 2 ml of the conditioned medium was collected immediately before stimulation. After a 10-min insulin stimulation, the cells were washed twice with 4 ml of PBS, and the medium was then replaced with the conditioned medium without insulin. In the ramp stimulation experiment, 2 ml of the conditioned medium was collected immediately before stimulation, and the conditioned medium with insulin was continuously added by use of a microsyringe pump (KD Scientific, Holliston, MA) at a flow rate of 62.5 μl/h into the cultured medium.
GLCex assay
The concentration of glucose in the medium was measured using a simple fluorometric glucose assay kit (A22189, Invitrogen) according to the manufacturer’s instructions. This assay is based on the glucose oxidation reaction. The fluorescence was detected with a LAS4000 imager (Fujifilm), and the intensities were quantified using TotalLab TL120 (Nonlinear Dynamics) analysis software.
Glycogen content assay
The cell suspension was digested for 1 h with 1.2 ml of 30% (w/v) KOH solution at 95°C. A volume of 61.2 μl of glacial acetic acid and 1% (w/v) linear polyacrylamide was added to 200 μl of the cell suspension to coprecipitate the glycogen. Then, 400 μl of pure ethanol was added to the mixture to precipitate the total glycogen. The solution was centrifuged for 15 min at 15 000 r.p.m. and 4°C. The supernatants were removed, and the glycogen pellets were resuspended in 50 μl of 50 mM NaOAc buffer (comprised of an equal volume of 50 mM sodium acetate and 50 mM acetate) and centrifuged for 15 min at 15000, r.p.m. and 4°C with 600 μl of pure ethanol. After the supernatant was removed, the cells were resuspended and centrifuged with pure ethanol. The glycogen suspension was then dried to eliminate any residual ethanol and incubated with 20 μl of amyloglucosidase (0.1 mg/ml in 50 mM NaOAc buffer) for 2 h at 55°C. Hydrolysed glycogen was quantified using the glucose assay. Note that the glycogen showed little response to 100 nM insulin; however, the response was not reproducible likely owing to experimental problems and has therefore not been shown. As shown in Figures 1, 2, 3, 4, 5, the basal values at t=0 were set to 1.
Metabolome analysis
The stimulated cells were washed twice with 5% mannitol and incubated for 10 min in 1 ml of methanol containing 25 μM each of the three internal standards (L-methionine sulphone, D-camphor-10-sulphonic acid and 2-(N-morpholin-o)ethanesulfonic acid). After 500 μl of Milli-Q purified water was added, 600 μl of the solution was taken and mixed well with 400 μl of chloroform, and then centrifuged for 15 min at 20 000 g and 4°C. The separated 400-μl aqueous layer was centrifugally filtered through a Millipore 5-kDa cutoff filter to remove any protein. The filtrate (320 μl) was lyophilised and dissolved in 50 μl of Milli-Q water containing reference compounds (200 μM each of trimesate and 3-aminopyrrolidine) and then injected into a CE-TOF-MS system (Agilent Technologies) (Soga et al, 2006, 2009). To measure the amount of PYRex by CE-TOF-MS, 400 μl of methanol containing 50 μM each of five internal standards (L-methionine sulphone, D-camphor-10-sulphonic acid, 2-(N-morpholin-o)ethanesulfonic acid, trimesate and 3-aminopyrrolidine) was added to 100 μl of the medium. After 200 μl of Milli-Q water and 500 μl of chloroform were added, the samples were subjected to the same protocol that was used to analyse the intracellular metabolome. For the data analysis, the obtained intracellular and extracellular absolute amounts (nmol) were converted into intracellular and extracellular concentrations (μM), respectively, (Figure 1) by dividing the absolute amounts by the total intracellular water content of hepatocytes (2.64 × 10⁻⁵ l per sample; (Le Cam and Freychet, 1977)) and the total extracellular medium content (4 ml), respectively.
Immunoblotting
The cell lysates were subjected to standard SDS–PAGE. The resolved proteins were transferred to nitrocellulose membranes and probed with specific antibodies (antibodies against pAKT [Ser473, #9271] and pGS [Ser641, #3891] were purchased from Cell Signalling Technology; antibodies against PEPCK [ab70358] and glucokinse [ab37796] were purchased from Abcam; and rabbit polyclonal antibodies against G6Pase and pGP (Ser14) were generated against residues 133–149 [STLAIFRGKKKSTYGFR ] and 346–357 [ARLLGQTHKKSL ], and 10–19 [KRRQI(P)SIRGI], respectively). The signal was visualised using chemiluminescence and horseradish peroxidase (HRP)-conjugated secondary antibodies (GE Healthcare) and the Immobilon Western Chemiluminescent HRP Substrate (Millipore) using a LAS4000 imager (Fujifilm). The intensities of the specific bands were quantified using TotalLab TL120 (Nonlinear Dynamics) analysis software. The maximal peak intensity of each molecule in Figures 1, 2, 3, 4, 5 were set to 1 such that the signal intensities in the experiments were comparable between figures.
Development of the insulin-dependent glucose metabolism model
The insulin-dependent glucose metabolism model consists of two sub-models, the insulin-dependent AKT pathway model and the AKT-dependent glucose metabolism model. We newly developed the AKT-dependent glucose metabolism model based on Michaelis–Menten kinetics for the metabolic reactions. We used mass action kinetics for the G6P-induced phosphorylation of GP and the pAKT-induced gene expression of PEPCK. We also used the previously developed insulin-dependent pAKT pathway model for the upstream pAKT-signalling pathway (Kubota et al, 2012). The parameters of the AKT-dependent glucose metabolism model were estimated using the experimental data shown in Figures 1 and 3A according to two methods-in-series: a meta-evolutionary programming method (Fogel et al, 1991) was used to approach the neighbourhood of the local minimum, and the Nelder–Mead method (Nelder and Mead, 1965) was used to reach the local minimum. Using these methods, the parameters were estimated to minimise the value of the objective function, which was defined as the sum of the squared residuals between our measurements and the model trajectories. After 200 independent estimations of the model, we selected the model and parameters that resulted in the minimum value for the objective function. The parameters and equations used in this study are shown in Supplementary Figure 1. We also modified the parameters of the insulin-dependent pAKT pathway model because we obtained the data at higher insulin doses (0–100 nM of insulin) in the current study than those (0–1 nM of insulin) in the previous study (Kubota et al, 2012). Therefore, we re-estimated the parameters of the insulin-dependent AKT pathway model to reproduce the time course data of pAKT in Figures 1 and 3A. The re-estimated parameters for the insulin-dependent AKT pathway model are shown in Supplementary Figure 1H. We performed the simulations and the parameter estimations using MATLAB software (version R2011b, MathWorks) and the Systems Biology Toolbox 2 (SBTOOLBOX2) (Schmidt and Jirstrand, 2006) for MATLAB.
The insulin-dependent glucose metabolism model is available in SBML format at BioModels (accession number: MODEL1301020001) and in Supplementary Information. Note that the pathways and molecules in the model do not directly correspond to the real biochemical pathway owing to the abstract model. As our aim is to explore how specific temporal patterns of insulin are selectively decoded by temporal patterns of the metabolites, we compared the experimental data of the actual molecules with the simulated data of the corresponding abstract variables in the model in terms of temporal patterns. Therefore, the absolute concentration of the molecules cannot be directly compared between the experimental and simulated data.
Supplementary Material
Acknowledgments
We deeply thank Kasumi Kashikura (of the Institute for Advanced Biosciences, Keio University) for providing excellent technical support during the CE-TOF-MS analysis. We are also grateful to our laboratory members for their critical reading of this manuscript and to Miharu Sato for her technical assistance with the experiments. This work was supported by The Creation of Fundamental Technologies for Understanding and Control of Biosystem Dynamics, CREST, from the Japan Science and Technology (JST); by a KAKENHI Scientific Research grant (A) (#21240025) and by Grant-in-Aid for JSPS Fellows (11J06435) from the Ministry of Education, Culture, Sports, Science and Technology of Japan (MEXT); and by a Human Frontier Science Project (HFSP) grant (RGP0061/2011); and by Daiichi–Sankyo Foundation of Life Science.
Author contributions: RN, HK and SK conceived the project; RN, HK and YT designed the experiments; RN and TS performed the experiments; RN and TS analysed the data; RN, HK and YT developed and employed the computational model; RN, HK, KY, TS and SK interpreted the data; and RN, HK, KY, YT, YK, TS and SK wrote the manuscript.
Footnotes
The authors declare that they have no conflict of interest.
References
- Aiston S, Andersen B, Agius L (2003) Glucose 6-phosphate regulates hepatic glycogenolysis through inactivation of phosphorylase. Diabetes 52: 1333–1339 [DOI] [PubMed] [Google Scholar]
- Aiston S, Hampson LJ, Arden C, Iynedjian PB, Agius L (2006) The role of protein kinase B/Akt in insulin-induced inactivation of phosphorylase in rat hepatocytes. Diabetologia 49: 174–182 [DOI] [PubMed] [Google Scholar]
- Alon U (2007) An Introduction to Systems Biology: Design Principles of Biological Circuits Boca Raton, FL: Chapman & Hall/CRC, [Google Scholar]
- Argaud D, Kirby TL, Newgard CB, Lange aJ (1997) Stimulation of glucose-6-phosphatase gene expression by glucose and fructose-2,6-bisphosphate. J Biol Chem 272: 12854–12861 [DOI] [PubMed] [Google Scholar]
- Barthel A, Schmoll D (2003) Novel concepts in insulin regulation of hepatic gluconeogenesis. Am J Physiol Endocrinol Metab 285: E685–E692 [DOI] [PubMed] [Google Scholar]
- Basu A, Alzaid A, Dinneen S, Caumo A, Cobelli C, Rizza RA (1996) Effects of a change in the pattern of insulin delivery on carbohydrate tolerance in diabetic and nondiabetic humans in the presence of differing degrees of insulin resistance. J Clin Invest 97: 2351–2361 [DOI] [PMC free article] [PubMed] [Google Scholar]
- Bollen M, Keppens S, Stalmans W (1998) Specific features of glycogen metabolism in the liver. Biochem J 336: Pt 119–31 [DOI] [PMC free article] [PubMed] [Google Scholar]
- Bruce DG, Chisholm DJ, Storlien LH, Kraegen EW (1988) Physiological importance of deficiency in early prandial insulin secretion in non-insulin-dependent diabetes. Diabetes 37: 736–744 [DOI] [PubMed] [Google Scholar]
- Del Prato S (2003) Loss of early insulin secretion leads to postprandial hyperglycaemia. Diabetologia 46: Suppl 1M2–M8 [DOI] [PubMed] [Google Scholar]
- Ferre T, Riu E, Bosch F, Valera A (1996) Evidence from transgenic mice that glucokinase is rate limiting for glucose utilization in the liver. FASEB J 10: 1213–1218 [DOI] [PubMed] [Google Scholar]
- Fogel DB, Fogel LJ, Atmar JW (1991) Meta-evolutionary programming. In Signals, Systems and Computers, 1991. 1991 Conference Record of the Twenty-Fifth Asilomar Conference Vol. 541: pp 540–545 [Google Scholar]
- Goentoro L, Shoval O, Kirschner MW, Alon U (2009) The incoherent feedforward loop can provide fold-change detection in gene regulation. Mol Cell 36: 894–899 [DOI] [PMC free article] [PubMed] [Google Scholar]
- Grubert JM, Lautz M, Lacy DB, Moore MC, Farmer B, Penaloza A, Cherrington AD, McGuinness OP (2005) Impact of continuous and pulsatile insulin delivery on net hepatic glucose uptake. Am J Physiol Endocrinol Metab 289: E232–E240 [DOI] [PubMed] [Google Scholar]
- Iynedjian PB, Roth RA, Fleischmann M, Gjinovci A (2000) Activation of protein kinase B/cAkt in hepatocytes is sufficient for the induction of expression of the gene encoding glucokinase. Biochem J 351: Pt 3621–627 [PMC free article] [PubMed] [Google Scholar]
- Johnson L (1992) Glycogen phosphorylase: control by phosphorylation and allosteric effectors. FASEB J 6: 2274–2282 [DOI] [PubMed] [Google Scholar]
- Kubota H, Noguchi R, Toyoshima Y, Ozaki Y, Uda S, Watanabe K, Ogawa W, Kuroda S (2012) Temporal coding of insulin action through multiplexing of the AKT pathway. Mol Cell 46: 820–832 [DOI] [PubMed] [Google Scholar]
- Le Cam A, Freychet P (1977) Neutral amino acid transport. Characterization of the A and L systems in isolated rat hepatocytes. J Biol Chem 252: 148–156 [PubMed] [Google Scholar]
- Lindsay JR, McKillop AM, Mooney MH, Flatt PR, Bell PM, O'Harte FP (2003) Meal-induced 24-hour profile of circulating glycated insulin in type 2 diabetic subjects measured by a novel radioimmunoassay. Metabolism 52: 631–635 [DOI] [PubMed] [Google Scholar]
- Mangan S, Alon U (2003) Structure and function of the feed-forward loop network motif. Proc Natl Acad Sci USA 100: 11980–11985 [DOI] [PMC free article] [PubMed] [Google Scholar]
- Massimi M, Tomassini A, Sciubba F, Sobolev AP, Devirgiliis LC, Miccheli A (2012) Effects of resveratrol on HepG2 cells as revealed by (1)H-NMR based metabolic profiling. Biochim Biophys Acta 1820: 1–8 [DOI] [PubMed] [Google Scholar]
- Nakae J, Park BC, Accili D (1999) Insulin stimulates phosphorylation of the forkhead transcription factor FKHR on serine 253 through a Wortmannin-sensitive pathway. J Biol Chem 274: 15982–15985 [DOI] [PubMed] [Google Scholar]
- Nelder JA, Mead R (1965) A simplex-method for function minimization. Comput J 7: 308–313 [Google Scholar]
- Nordlie RC, Foster JD, Lange AJ (1999) Regulation of glucose production by the liver. Annu Rev Nutr 19: 379–406 [DOI] [PubMed] [Google Scholar]
- Okar DA, Lange AJ, Manzano À, Navarro-Sabatè A, Ls Riera, Bartrons R (2001) PFK-2/FBPase-2: maker and breaker of the essential biofactor fructose-2,6-bisphosphate. Trends Biochem Sci 26: 30–35 [DOI] [PubMed] [Google Scholar]
- Okar DA, Wu C, Lange AJ (2004) Regulation of the regulatory enzyme, 6-phosphofructo-2-kinase/fructose-2,6-bisphosphatase. Adv Enzyme Regul 44: 123–154 [DOI] [PubMed] [Google Scholar]
- Papin JA, Hunter T, Palsson BO, Subramaniam S (2005) Reconstruction of cellular signalling networks and analysis of their properties. Nat Rev Mol Cell Biol 6: 99–111 [DOI] [PubMed] [Google Scholar]
- Pessin JE, Saltiel AR (2000) Signaling pathways in insulin action: molecular targets of insulin resistance. J Clin Invest 106: 165–169 [DOI] [PMC free article] [PubMed] [Google Scholar]
- Pilkis SJ, Chrisman T, Burgress B, McGrane M, Colosia A, Pilkis J, Claus TH, el-Maghrabi MR (1983) Rat hepatic 6-phosphofructo 2-kinase/fructose 2,6-bisphosphatase: a unique bifunctional enzyme. Adv Enzyme Regul 21: 147–173 [DOI] [PubMed] [Google Scholar]
- Pilkis SJ, Claus TH, Kurland IJ, Lange AJ (1995) 6-Phosphofructo-2-kinase/fructose-2,6-bisphosphatase: a metabolic signaling enzyme. Annu Rev Biochem 64: 799–835 [DOI] [PubMed] [Google Scholar]
- Polonsky KS, Given BD, Hirsch LJ, Tillil H, Shapiro ET, Beebe C, Frank BH, Galloway JA, Van Cauter E (1988a) Abnormal patterns of insulin secretion in non-insulin-dependent diabetes mellitus. N Engl J Med 318: 1231–1239 [DOI] [PubMed] [Google Scholar]
- Polonsky KS, Given BD, Van Cauter E (1988b) Twenty-four-hour profiles and pulsatile patterns of insulin secretion in normal and obese subjects. J Clin Invest 81: 442–448 [DOI] [PMC free article] [PubMed] [Google Scholar]
- Polonsky KS, Sturis J, Van Cauter E (1998) Temporal profiles and clinical significance of pulsatile insulin secretion. Horm Res 49: 178–184 [DOI] [PubMed] [Google Scholar]
- Pratley RE, Weyer C (2001) The role of impaired early insulin secretion in the pathogenesis of Type II diabetes mellitus. Diabetologia 44: 929–945 [DOI] [PubMed] [Google Scholar]
- Probst I, Unthan-Fechner K (1985) Activation of glycolysis by insulin with a sequential increase of the 6-phosphofructo-2-kinase activity, fructose-2,6-bisphosphate level and pyruvate kinase activity in cultured rat hepatocytes. Eur J Biochem/FEBS 153: 347–353 [DOI] [PubMed] [Google Scholar]
- Purvis JE, Lahav G (2012) Decoding the insulin signal. Mol Cell 46: 715–716 [DOI] [PMC free article] [PubMed] [Google Scholar]
- Ribaux PG, Iynedjian PB (2003) Analysis of the role of protein kinase B (cAKT) in insulin-dependent induction of glucokinase and sterol regulatory element-binding protein 1 (SREBP1) mRNAs in hepatocytes. Biochem J 376: 697–705 [DOI] [PMC free article] [PubMed] [Google Scholar]
- Roach PJ, Skurat AV, Harris R (2001) Regulation of glycogen metabolism. In The Endocrine Pancreas and Regulation of Metabolism, Cherrington AD and Jefferson LS (eds), Vol. 2, pp 609–647. New York, NY: Oxford University Press
- Saltiel AR, Kahn CR (2001) Insulin signalling and the regulation of glucose and lipid metabolism. Nature 414: 799–806 [DOI] [PubMed] [Google Scholar]
- Schmidt H, Jirstrand M (2006) Systems Biology Toolbox for MATLAB: a computational platform for research in systems biology. Bioinformatics 22: 514–515 [DOI] [PubMed] [Google Scholar]
- Scribner DM, Witowski NE, Mulier KE, Lusczek ER, Wasiluk KR, Beilman GJ (2010) Liver metabolomic changes identify biochemical pathways in hemorrhagic shock. J Surg Res 164: e131–e139 [DOI] [PubMed] [Google Scholar]
- Sindelar DK, Chu CA, Neal DW, Cherrington AD (1997) Interaction of equal increments in arterial and portal vein insulin on hepatic glucose production in the dog. Am J Physiol 273: E972–E980 [DOI] [PubMed] [Google Scholar]
- Skurat AV, Roach PJ (1995) Phosphorylation of sites 3a and 3b (Ser640 and Ser644) in the control of rabbit muscle glycogen synthase. J Biol Chem 270: 12491–12497 [DOI] [PubMed] [Google Scholar]
- Soga T, Baran R, Suematsu M, Ueno Y, Ikeda S, Sakurakawa T, Kakazu Y, Ishikawa T, Robert M, Nishioka T, Tomita M (2006) Differential metabolomics reveals ophthalmic acid as an oxidative stress biomarker indicating hepatic glutathione consumption. J Biol Chem 281: 16768–16776 [DOI] [PubMed] [Google Scholar]
- Soga T, Igarashi K, Ito C, Mizobuchi K, Zimmermann H-P, Tomita M (2009) Metabolomic profiling of anionic metabolites by capillary electrophoresis mass spectrometry. Anal Chem 81: 6165–6174 [DOI] [PubMed] [Google Scholar]
- Srivastava AK, Pandey SK (1998) Potential mechanism(s) involved in the regulation of glycogen synthesis by insulin. Mol Cell Biochem 182: 135–141 [PubMed] [Google Scholar]
- Sutherland C, O'Brien RM, Granner DK (1996) New connections in the regulation of PEPCK gene expression by insulin. Philos Trans R Soc Lond B Biol Sci 351: 191–199 [DOI] [PubMed] [Google Scholar]
- Van Schaftingen E, Detheux M, Veiga da Cunha M (1994) Short-term control of glucokinase activity: role of a regulatory protein. FASEB J 8: 414–419 [DOI] [PubMed] [Google Scholar]
- Villar-Palasi C, Guinovart JJ (1997) The role of glucose 6-phosphate in the control of glycogen synthase. FASEB J 11: 544–558 [PubMed] [Google Scholar]
- Watanabe C, Seino Y, Miyahira H, Yamamoto M, Fukami A, Ozaki N, Takagishi Y, Sato J, Fukuwatari T, Shibata K, Oiso Y, Murata Y, Hayashi Y (2012) Remodeling of hepatic metabolism and hyperaminoacidemia in mice deficient in proglucagon-derived peptides. Diabetes 61: 74–84 [DOI] [PMC free article] [PubMed] [Google Scholar]
- Whiteman EL, Cho H, Birnbaum MJ (2002) Role of Akt/protein kinase B in metabolism. Trends Endocrinol Metab 13: 444–451 [DOI] [PubMed] [Google Scholar]
- Yabaluri N, Bashyam MD (2010) Hormonal regulation of gluconeogenic gene transcription in the liver. J Biosci 35: 473–484 [DOI] [PubMed] [Google Scholar]
- Yki-Jarvinen H (1993) Action of insulin on glucose metabolism in vivo. Baillieres Clin Endocrinol Metab 7: 903–927 [DOI] [PubMed] [Google Scholar]
Associated Data
This section collects any data citations, data availability statements, or supplementary materials included in this article.