

Abstract
In drug discovery, promiscuous targets, multifactorial diseases, and “dirty” drugs construct complex network relationships. Network pharmacology description and analysis not only give a systems-level understanding of drug action and disease complexity but can also help to improve the efficiency of target selection and drug design. Visual network pharmacology (VNP) is developed to visualize network pharmacology of targets, diseases, and drugs with a graph network by using disease, target or drug names, chemical structures, or protein sequence. To our knowledge, VNP is the first free interactive VNP server that should be very helpful for systems pharmacology research. VNP is freely available at http://cadd.whu.edu.cn/ditad/vnpsearch.
Introduction
Drug discovery and development is a highly complex, lengthy, and expensive process, which starts from understanding molecular mechanisms of diseases, proceeds through selecting therapeutic targets, and leads to discovering drug leads and optimizing drug candidates.1,2,3,4 Diseases are usually multifactorial,5 in which multiple targets are affected and have to be targeted for successful treatment outcomes. Target proteins are always promiscuous6 with small molecular drugs. “Dirty” drugs may bind to many different molecular targets or receptors in the body and so tend to have a wide range of effects and possibly negative side effects.7,8,9,10,11
Several research groups curated different databases for storing information of diseases, targets, and drugs. Online Mendelian Inheritance in Man contains information on all known mendelian disorders and >12,000 genes.12 However, there is a lack of the disease-related target and drug information. DrugBank database combines detailed drug (i.e., chemical, pharmacological, and pharmaceutical) data with comprehensive drug target (i.e., sequence, structure, and pathway) information.13 In DrugBank, the therapeutic indication descriptions (for example, “Used in combination with prednisone for the treatment of metastatic, castration-resistant prostate cancer”) of drugs are listed, which needs further manual curation for specific diseases. BindingDB is a public, Web-accessible database of measured binding affinities, focusing chiefly on the interactions of proteins considered to be drug targets with small, drug-like molecules.14 The disease information of the targets and drugs are not yet provided. Therapeutic Target Database is a database containing information about the known and explored therapeutic proteins and nucleic acid targets, diseases, pathway information, and the corresponding drugs.15
The above-mentioned databases provide valuable resources for drug discovery. Currently, the potentially useful knowledge among diseases, targets, and drugs are still hidden in the text descriptions. CIDeR (multifactorial interaction networks in human diseases) provides a systems biology tool to integrate disease-associated factors focusing on metabolic and neurological diseases.16 Using systems or network4,10,17,18 tools to investigate the structure and dynamics of molecular networks is a novel paradigm of drug discovery.
Results
Disease-Target-Drug Database
Disease-Target-Drug Database (http://cadd.whu.edu.cn/ditad/) stores known connections among diseases, targets, and drugs approved by the US Food and Drug Administration. Each record has a drug target, which is also used as a bridge to link diseases and drugs. Currently, there are >1,000 diseases, >500 protein targets, and >4,000 drugs (including >2,500 herb medicines and 1,500 chemical drugs) curated with tens of thousands of connections among them. The diseases and drugs are curated from the “Pharmacopoeia of People's Republic of China, version 2010, three columns” (http://en.wikipedia.org/wiki/Pharmacopoeia_of_the_People%27s_Republic_of_China), compiled by the Chinese Pharmacopoeia Commission (http://www.chp.org.cn/cms/about/). The target information is from the Therapeutic Target Database.15 To our knowledge, there are no visual and interactive Web-based tools available elsewhere to explore the network pharmacology complex relationships.
Visual network pharmacology
Visual network pharmacology (VNP) is specially designed to visualize the complex relationships among diseases, targets, and drugs, which mainly contains three functional modules: drug-centric, target-centric, and disease-centric VNP. Users can search the database using disease, target, or drug name strings; chemical structures and substructures; or protein sequence similarity and then obtain an online interactive network view of the retrieved records. In the obtained network view, each node is a disease, target, or drug, and each edge is a known connection between two of them.
Three search examples are illustrated: a disease-centric network (Figure 1), retrieved by “Alzheimer's disease”; a target-centric network (Figure 2), obtained by “Muscarinic acetylcholine receptor”; and a drug-centric network (Figure 3), searched by chemical substructure (7-amino-3-cephem-4-carboxylic acid), in which red triangles, green circles, and yellow rectangles correspond to diseases, drugs, and targets, respectively.
Figure 1.

A disease-centric view of visual network pharmacology retrieved by the search term “Alzheimer's disease.”
Figure 2.

A target-centric view of visual network pharmacology obtained by the term “muscarinic acetylcholine receptor.”
Figure 3.

A drug-centric view of visual network pharmacology by chemical substructure (7-amino-3-cephem-4-carboxylic acid).
In Figure 1, the input disease string “Alzheimer's disease” will find >50 proteins and >10 drugs. The graph provides an intuitive view to network the targets and drugs related with Alzheimer's disease. The connection degrees between targets and drugs are asymmetry, for instance, three drugs connecting to acetylcholinesterase. One drug is linked to alpha-2 adrenergic receptor.
In Figure 2, the query string “Muscarinic acetylcholine receptor” will obtain six targets. These targets are found connecting with >20 diseases and 50 drugs.
In Figure 3, the network view is obtained by chemical substructure “7-amino-3-cephem-4-carboxylic acid,” represented as smiles string23 “NC1C(=O)N2C1SCC=C2C(=O)O.” There are >30 drugs containing the chemical substructure. These drugs are further mapped with six diseases and six targets. Furthermore, after clicking on any node on the graph, users will get a detailed list of the related records.
Discussion
Network pharmacology analysis
In the VNP graphs, diseases are usually multifactorial, in which multiple targets/pathways have to be involved for the successful treatment outcomes and thus multiple drugs are usually developed for the same disease. Second, target proteins are always promiscuous with small molecular drugs and are related with different diseases. Third, some drugs are found interacting with several different molecular targets or receptors in the body, which might be the reason that the drugs have a wide range of effects and possibly negative side effects. Using the VNP, users can easily get a landscape of the related diseases, targets, or drugs in a dynamic and interactive way.
VNP has potential applications such as network analysis of drug combinations and drug repositioning. Hypertension is a typical disease with multiple mechanisms resulting from a complex interaction of genes and environmental factors. VNP provides a convenient tool to get an overview (Supplementary Figure S1) of the drugs and targets for the treatment of hypertension. The treatment of hypertension involves multiple mechanisms and thus several targets. The majority of people require more than one drug to control their hypertension, which includes thiazides, angiotensin-converting enzyme inhibitor, angiotensin receptor block, or calcium channel blocker.19 Some combinations of drugs might be avoided in practice, such as the use of clonidine, verapamil, or diltiazem together with a beta-blocker.19 How to select drug combinations for personal treatments is still a very challenging issue waiting for network or systems pharmacology modeling. What should also be noted is that “dirty drug” phenomenon7,8,9,10,11 can be found in this example, that is, the drug omapatrilat can bind to both neprilysin and angiotensin-converting enzyme.
Ropinirole has been originally used in the treatment of Parkinson's disease and has been further successfully repositioned in the treatment of restless legs syndrome. The drug target of ropinirole is mainly the dopamine receptor. Using VNP, several diseases are related with the dopamine receptor, which includes schizophrenia (Supplementary Figure S2). After searching literatures, ropinirole is found to be an effective adjunctive treatment for schizophrenia.20 Through the drug target (via VNP searching) as a bridge, it is possible to find potential new indications of an old drug. However, ropinirole can also cause nausea, dizziness, hallucinations, orthostatic hypotension, sudden sleep attacks, hypersexuality, punding, and compulsive gambling.21 How to distinguish side effects and drug repositioning is another challenge of network or systems pharmacology modeling techniques.
In drug discovery cases, fully understanding the complex network relationships among diseases, targets, and drugs still remains a big challenge, yet it is essential for understanding multiple mechanisms of diseases, selecting important therapeutic targets, reducing side effects, and discovering new therapeutic indications of old drugs.22
Method comparisons
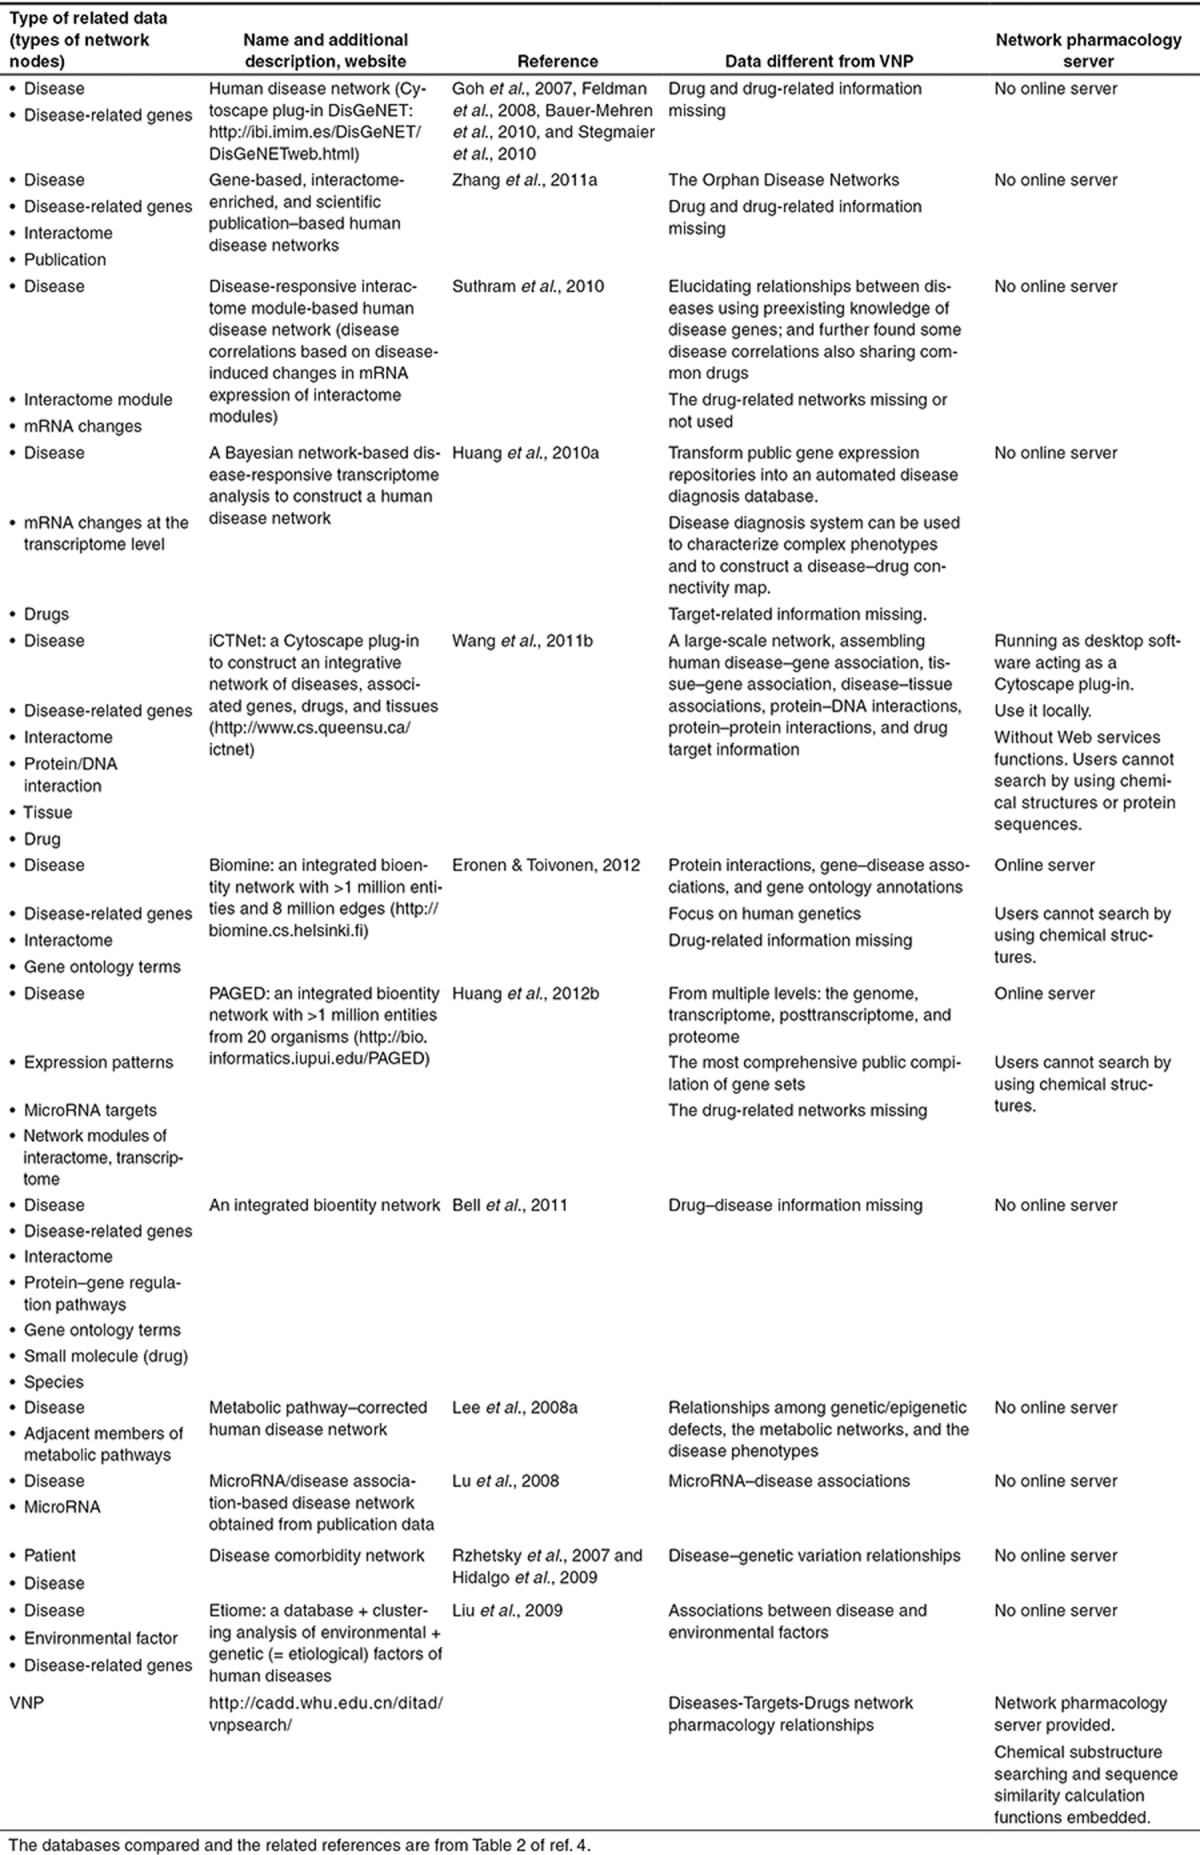
A comprehensive comparison is carried out to compare network pharmacology visualization tools and disease-related data, as shown in Tables 1 and 2 respectively. The software comparison table (Table 1) includes (i) data, (ii) online server; and (iii) chemoinformatics and bioinformatics search tools. The table on data comparisons (Table 2) is composed of (i) data different from that in VNP and (ii) the detail regarding whether there is a network pharmacology server visualizing the data. From the comparisons, the technical novelty of VNP is highlighted as the first network pharmacology server combined with bioinformatics and chemoinformatics tools for network analysis of multifactorial diseases, promiscuous target proteins, and “dirty” drugs.
Table 1. Comparisons with visualization tools.

Table 2. Comparisons with disease-related networks.
Methods
Substructure searching
Chemoinformatics is the application of computer and informational techniques to a range of problems in the field of chemistry, in which a key tool is to find a mapping for a query to a target molecule. Our group implemented chemoinformatics tools to search substructure in biochemical reaction database.23
Sequence similarity searching
In this work, we applied protein Smith–Waterman similarity methods24,25,26 to compare a query biological sequence with different target protein sequences. The software package is downloaded from the FASTA (a protein sequence similarity software) team at Virginia University (http://fasta.bioch.virginia.edu/fasta_www2/fasta_list2.shtml).
Graph visualization
In this work, the diseases, targets, and drugs are treated as graph nodes, and the connections among them are regarded as graph edges. Our purpose is to position the nodes of a graph in two-dimensional space so that all the edges are of more or less equal length and there are as few crossing edges as possible, by assigning forces among the set of edges and the set of nodes, based on their relative positions, and then using these forces either to simulate the motion of the edges and nodes or to minimize their energy.27 A Fruchterman–Reingold force-directed graph-drawing algorithm is implemented to assign forces among the sets of edges and nodes (diseases, targets, and drugs) of a graph drawing.
Web server
On the Web server side, Apache, Python, Django, C++, Javascript, and Ajax tools are used to integrate the related chemoinformatics, bioinformatics, graph layout, and visualization tools.
Author contributions
Q-N.H. wrote the manuscript. Q-N.H., Z-X.D., and J.L. designed the research. Q-N.H., Z.D., W.T., X.Y., and Z-B.M. performed the research and analyzed data.
Conflict of Interest
The authors declared no conflict of interest.
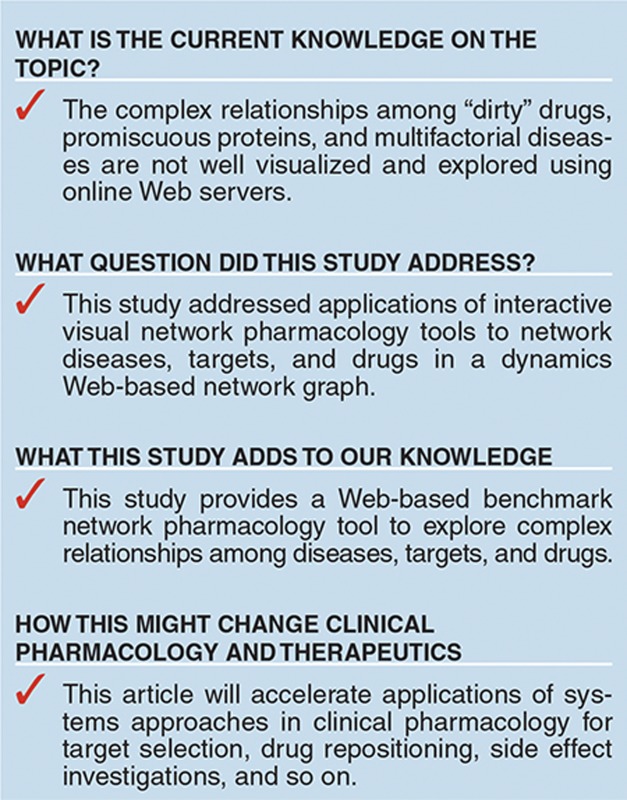
Study Highlights
Acknowledgments
This study was supported by grants from the National Natural Science Foundation of China, the Ministry of Science and Technology of China (973 and 863 Programs), the program for New Century Excellent Talents in Universities, and the National Mega Project on Major Drug Development.
Supplementary Material
References
- Gashaw I., Ellinghaus P., Sommer A., Asadullah K. What makes a good drug target. Drug Discov. Today. 2011;16:1037–1043. doi: 10.1016/j.drudis.2011.09.007. [DOI] [PubMed] [Google Scholar]
- Chen X., Ji Z.L., Chen Y.Z. TTD: Therapeutic Target Database. Nucleic Acids Res. 2002;30:412–415. doi: 10.1093/nar/30.1.412. [DOI] [PMC free article] [PubMed] [Google Scholar]
- Ainsworth C. Networking for new drugs. Nat. Med. 2011;17:1166–1168. doi: 10.1038/nm1011-1166. [DOI] [PubMed] [Google Scholar]
- Csermely P., Korcsmáros T., Kiss H.J., London G., Nussinov R. Structure and dynamics of molecular networks: a novel paradigm of drug discovery: a comprehensive review. Pharmacol. Ther. 2013;138:333–408. doi: 10.1016/j.pharmthera.2013.01.016. [DOI] [PMC free article] [PubMed] [Google Scholar]
- Hu G., Agarwal P. Human disease-drug network based on genomic expression profiles. PLoS ONE. 2009;4:e6536. doi: 10.1371/journal.pone.0006536. [DOI] [PMC free article] [PubMed] [Google Scholar]
- Nobeli I., Favia A.D., Thornton J.M. Protein promiscuity and its implications for biotechnology. Nat. Biotechnol. 2009;27:157–167. doi: 10.1038/nbt1519. [DOI] [PubMed] [Google Scholar]
- Schrattenholz A., Groebe K., Soskic V. Systems biology approaches and tools for analysis of interactomes and multi-target drugs. Methods Mol. Biol. 2010;662:29–58. doi: 10.1007/978-1-60761-800-3_2. [DOI] [PubMed] [Google Scholar]
- Mencher S.K., Wang L.G. Promiscuous drugs compared to selective drugs (promiscuity can be a virtue). BMC Clin. Pharmacol. 2005;5:3. doi: 10.1186/1472-6904-5-3. [DOI] [PMC free article] [PubMed] [Google Scholar]
- Hopkins A.L., Mason J.S., Overington J.P. Can we rationally design promiscuous drugs. Curr. Opin. Struct. Biol. 2006;16:127–136. doi: 10.1016/j.sbi.2006.01.013. [DOI] [PubMed] [Google Scholar]
- Hopkins A.L. Network pharmacology: the next paradigm in drug discovery. Nat. Chem. Biol. 2008;4:682–690. doi: 10.1038/nchembio.118. [DOI] [PubMed] [Google Scholar]
- Frantz S. Drug discovery: playing dirty. Nature. 2005;437:942–943. doi: 10.1038/437942a. [DOI] [PubMed] [Google Scholar]
- Hamosh A., Scott A.F., Amberger J.S., Bocchini C.A., McKusick V.A. Online Mendelian Inheritance in Man (OMIM), a knowledgebase of human genes and genetic disorders. Nucleic Acids Res. 2005;33:D514–D517. doi: 10.1093/nar/gki033. [DOI] [PMC free article] [PubMed] [Google Scholar]
- Knox C., et al. DrugBank 3.0: a comprehensive resource for ‘omics' research on drugs. Nucleic Acids Res. 2011;39:D1035–D1041. doi: 10.1093/nar/gkq1126. [DOI] [PMC free article] [PubMed] [Google Scholar]
- Liu T., Lin Y., Wen X., Jorissen R.N., Gilson M.K. BindingDB: a web-accessible database of experimentally determined protein-ligand binding affinities. Nucleic Acids Res. 2007;35:D198–D201. doi: 10.1093/nar/gkl999. [DOI] [PMC free article] [PubMed] [Google Scholar]
- Zhu F., et al. Therapeutic target database update 2012: a resource for facilitating target-oriented drug discovery. Nucleic Acids Res. 2012;40:D1128–D1136. doi: 10.1093/nar/gkr797. [DOI] [PMC free article] [PubMed] [Google Scholar]
- Lechner M., et al. CIDeR: multifactorial interaction networks in human diseases. Genome Biol. 2012;13:R62. doi: 10.1186/gb-2012-13-7-r62. [DOI] [PMC free article] [PubMed] [Google Scholar]
- Waldman S.A., van der Graaf P.H., Terzic A. Systems approaches evolve clinical pharmacology. CPT. Pharmacometrics Syst. Pharmacol. 2013;2:e68. doi: 10.1038/psp.2013.48. [DOI] [PMC free article] [PubMed] [Google Scholar]
- Kirouac D.C., Onsum M.D. Using network biology to bridge pharmacokinetics and pharmacodynamics in oncology. CPT. Pharmacometrics Syst. Pharmacol. 2013;2:e71. doi: 10.1038/psp.2013.38. [DOI] [PMC free article] [PubMed] [Google Scholar]
- Go A.S., et al. An Effective Approach to High Blood Pressure Control: A Science Advisory From the American Heart Association, the American College of Cardiology, and the Centers for Disease Control and Prevention. Hypertension. 2014. [DOI] [PMC free article] [PubMed]
- Michalopoulou P.G., Azim A., Tracy D., Shergill S.S. Ropinirole as an effective adjunctive treatment for clozapine-resistant negative symptoms in simple schizophrenia: a case report. J. Clin. Psychopharmacol. 2012;32:719–720. doi: 10.1097/JCP.0b013e318267062c. [DOI] [PubMed] [Google Scholar]
- Bostwick J.M., Hecksel K.A., Stevens S.R., Bower J.H., Ahlskog J.E. Frequency of new-onset pathologic compulsive gambling or hypersexuality after drug treatment of idiopathic Parkinson disease. Mayo Clin. Proc. 2009;84:310–316. doi: 10.1016/S0025-6196(11)60538-7. [DOI] [PMC free article] [PubMed] [Google Scholar]
- Cao D.S., et al. Genome-scale screening of drug-target associations relevant to Ki using a chemogenomics approach. PLoS ONE. 2013;8:e57680. doi: 10.1371/journal.pone.0057680. [DOI] [PMC free article] [PubMed] [Google Scholar]
- Hu Q.N., Deng Z., Hu H., Cao D.S., Liang Y.Z. RxnFinder: biochemical reaction search engines using molecular structures, molecular fragments and reaction similarity. Bioinformatics. 2011;27:2465–2467. doi: 10.1093/bioinformatics/btr413. [DOI] [PubMed] [Google Scholar]
- Smith T.F., Waterman M.S. Identification of common molecular subsequences. J. Mol. Biol. 1981;147:195–197. doi: 10.1016/0022-2836(81)90087-5. [DOI] [PubMed] [Google Scholar]
- Pearson W.R., Lipman D.J. Improved tools for biological sequence comparison. Proc. Natl. Acad. Sci. U.S.A. 1988;85:2444–2448. doi: 10.1073/pnas.85.8.2444. [DOI] [PMC free article] [PubMed] [Google Scholar]
- Lipman D.J., Pearson W.R. Rapid and sensitive protein similarity searches. Science. 1985;227:1435–1441. doi: 10.1126/science.2983426. [DOI] [PubMed] [Google Scholar]
- Fruchterman T.M.J., Reingold E.M. Graph drawing by force-directed placement. Software: Practice Experience. 1991;21:1129–1164. [Google Scholar]
Associated Data
This section collects any data citations, data availability statements, or supplementary materials included in this article.