

Abstract
Objective
We constructed random forest classifiers employing either the traditional method of scoring semantic fluency word lists or new methods. These classifiers were then compared in terms of their ability to diagnose Alzheimer disease (AD) or to prognosticate among individuals along the continuum from cognitively normal (CN) through mild cognitive impairment (MCI) to AD.
Method
Semantic fluency lists from 44 cognitively normal elderly individuals, 80 MCI patients, and 41 AD patients were transcribed into electronic text files and scored by four methods: traditional raw scores, clustering and switching scores, “generalized” versions of clustering and switching, and a method based on independent components analysis (ICA). Random forest classifiers based on raw scores were compared to “augmented” classifiers that incorporated newer scoring methods. Outcome variables included AD diagnosis at baseline, MCI conversion, increase in Clinical Dementia Rating-Sum of Boxes (CDR-SOB) score, or decrease in Financial Capacity Instrument (FCI) score. ROC curves were constructed for each classifier and the area under the curve (AUC) was calculated. We compared AUC between raw and augmented classifiers using Delong’s test and assessed validity and reliability of the augmented classifier.
Results
Augmented classifiers outperformed classifiers based on raw scores for the outcome measures AD diagnosis (AUC 0.97 vs. 0.95), MCI conversion (AUC 0.91 vs. 0.77), CDR-SOB increase (AUC 0.90 vs. 0.79), and FCI decrease (AUC 0.89 vs. 0.72). Measures of validity and stability over time support the use of the method.
Conclusion
Latent information in semantic fluency word lists is useful for predicting cognitive and functional decline among elderly individuals at increased risk for developing AD. Modern machine learning methods may incorporate latent information to enhance the diagnostic value of semantic fluency raw scores. These methods could yield information valuable for patient care and clinical trial design with a relatively small investment of time and money.
Keywords: Alzheimer’s disease, cognitive neuropsychology, dementia, MCI (mild cognitive impairment), machine learning, random forests
1. Introduction
The recognition of “mild cognitive impairment” (MCI) as a prodromal condition for Alzheimer disease (AD) has resulted in a strategic shift among researchers seeking effective AD treatments (Petersen, et al., 2001; Petersen, Smith, Waring, Ivnik, Tangalos, & Kokmen, 1999). The hope is to discover a treatment that will not only alleviate symptoms of cognitive decline, but will also slow the progression of the disease, such that non-demented individuals who are destined to develop AD may persist longer in a state of functional independence. However, the difficulty of identifying persons with cognitive impairment who are destined to “convert” to AD impedes the discovery of new treatments. (The term “conversion” is commonly used to refer to the transition from a state of preserved functional independence to a state of dementia.) Clinical trials investigating putative treatments for delaying the onset of dementia must either enroll many participants to guarantee the observation of a number of conversions sufficient for statistical analysis or enrich the sample with subjects likely to convert (Thal, et al., 2005; Salloway, Correia, & Richardson, 2007; Doody, et al., 2009). Improvements in methods for stratifying these participants in terms of their conversion risk could therefore improve the efficiency of clinical trials, accelerating progress toward effective AD treatments (Holland, McEvoy, Desikan, Dale, 2012). This view has inspired a body of work focused on the prediction of conversion. However, methods that are expensive, invasive, or time-consuming are less likely to provide practical benefit. We focus here on a potentially useful, yet inexpensive, fast, and non-invasive technique that is influenced by methods from artificial intelligence.
Alzheimer disease is a primary cognitive disorder and the clinical diagnosis relies on cognitive testing. However, because cognitive effects are secondary to biological changes in the brain, an appropriate biological test might more accurately reflect the disease process. Much recent work seeks to make AD diagnoses or predictions based on biological markers (Convit, de Asis, de Leon, Tarshish, De Santi, & Rusinek, 2000; Visser, Verhey, Hofman, Scheltens, & Jolles, 2002; Devanand, et al., 2008; Walhovd, et al., 2010; Clark & ADNI, 2011; Cui, et al., 2011; Furney, et al., 2011; Palmqvist, et al., 2012; Ye, et al., 2012; Zhang, Shen, & ADNI, 2012). Among the studies cited here that incorporate biological tests, those that include some form of cross-validation or a separate test set report accuracies ranging from 62% to 85%. Reported areas under the ROC curve (AUC) range from 0.647 to 0.859. Importantly, both the study that reports the highest accuracy (Devanand, et al., 2008) and the study that reports the highest AUC (Ye, et al., 2012) include both cognitive and biological measures in their classifiers.
For biological markers of AD to be useful in clinical practice or clinical trials, predictions from biological measurements must either be extremely inexpensive and quick or must exceed the accuracy of predictions based on cognitive tests alone to justify the additional expenditure of time or money. It is therefore important to know the limits of cognitive testing for diagnosing AD or making predictions of functional decline. Several studies evaluate cognitive predictors in the absence of biological markers for predicting conversion (Powell, et al., 2006; Tabert, et al., 2006; Chapman, et al., 2011; Pozueta, et al., 2011). These studies report good results using cognitive tests alone, but none of them report results from any form of cross-validation or on a held-out sample of subjects. Therefore, it is likely that the neuropsychological tests used as predictors in these studies would yield lower accuracy with a new sample of data. Nevertheless, it is likely that methods from artificial intelligence could be applied to the development of new scoring methods for certain cognitive tests that would improve their predictive value. Expensive or invasive tests that assess biological markers could then be evaluated in the context of the best possible prediction from cognitive tests.
The goal of the current study is to apply current machine learning techniques to predict functional change using measurements of performance on semantic fluency tasks. Specifically, the objectives were (1) to investigate the utility of raw semantic fluency scores for predicting functional outcomes, (2) to compare raw scores to more sophisticated semantic fluency scoring methods in terms of accuracy of functional outcome predictions, and (3) to evaluate the classifiers in terms of convergent validity, reliability over time, and generalizability to a separate subject sample.
Verbal fluency tasks are usually administered by asking the patient or research subject to generate a list of words in a certain category within one minute. These tests are commonly used in neuropsychology and cognitive neurology due to their speed, ease of administration, and clinical utility. Verbal fluency for semantic categories (e.g., animals) is impaired among patients with AD (Monsch, et al., 1994; Vogel, Gade, Stokholm, & Waldemar, 2005) and the animal fluency raw score is sensitive and specific for detecting dementia (Duff-Canning, Leach, Stuss, Ngo, & Black, 2004). Words produced during these tasks are the result of more than one underlying cognitive process, such as “clustering” (automatic activation of one concept by a related, activated concept, making it more probable that a subject will say, “Dog, cat”) and “switching” (a deliberate, goal-oriented change from one sub-category to another, e.g. “dog… seahorse”) (Abwender, Swan, Bowerman, & Connolly, 2001; Hirshorn & Thompson-Schill, 2006; Troyer & Moscovitch, 2006; Troyer, Moscovitch, Winocur, Alexander, & Stuss, 1998; Fagundo, Lopez, Romero, Guarch, Marcos, & Salamero, 2008; Pakhomov & Hemmy, 2013). These component processes are affected in MCI and may predict conversion to dementia (Fagundo, Lopez, Romero, Guarch, Marcos, & Salamero, 2008; Murphy, Rich, & Troyer, 2006; Clark, Gatz, Zheng, Chen, McCleary, & Mack, 2009; Price, et al., 2012). Thus, it is possible that MCI patients at high risk for progression to dementia may be differentiated from patients at low risk by differences in clustering, switching, or other types of information that are not reflected in raw semantic fluency scores.
To explore this possibility, we employed random forests (Breiman, 2001) (see Methods, section 2.5.4) to predict functional decline using scores derived from semantic fluency tasks. Each random forest classifier in this study was trained to predict one of four measures of functional status or decline—diagnosis of AD, conversion to AD at any time during follow up, increase in Clinical Dementia Rating-Sum of Boxes score (CDR-SOB) (Morris, 1993) within one year, or a decrease of at least 10 points on the Financial Capacity Instrument (FCI) (Marson, et al., 2000) within one year. Separate random forest classifiers were trained using data from each of five different fluency tasks. A final classifier was produced for each outcome variable by combining the predictions from these five random forests.
2. Methods
2.1. Participants—training sample
This study used data collected on research participants evaluated between June 2004 and December 2010 and diagnostically characterized through the Alzheimer’s Disease Research Center (ADRC) at the University of Alabama at Birmingham (UAB) as part of the COINS study, an ongoing longitudinal study of functional change in MCI. Methods of recruitment and data acquisition for this study have been described elsewhere (Triebel, et al., 2009). Participants were annually diagnosed by a consensus team consisting of neurologists, neuropsychologists, a geriatric psychiatrist, and nursing staff. The team was blinded to the results of the financial capacity measures when diagnosing participants.
During the course of the COINS study, a total of 46 individuals were noted to “convert,” or transition from a diagnosis of MCI to a diagnosis of AD (MCI-C) on the basis of neurological evaluation, neuropsychological tests (Table 2), and informant report. We wished to demographically match three groups of individuals to this MCI-C group. These three other groups were selected by the following methods. The COINS study recruited 333 participants, of whom 103 were flagged in the database with a baseline consensus diagnosis of CN, 164 were diagnosed with MCI, and 50 were diagnosed with probable AD. The remaining 16 participants were not flagged in the database as having any of these diagnoses and some were assigned other specific diagnoses (e.g., vascular dementia, frontotemporal dementia, or parkinsonism with apraxia). From among the CN participants, only those who were diagnosed as CN at every evaluation were considered for this project (n = 54). Among the MCI patients who did not convert to AD (118 participants), we excluded those who underwent only one evaluation (23 participants) or who were determined at any consensus conference to be cognitively normal or to have non-memory cognitive impairment (38 participants), leaving 57 participants. These participants are referred to as MCI non-converters (MCI-N). None of the 50 participants diagnosed with AD at baseline underwent a shift in consensus diagnosis.
Table 2.
Baseline neuropsychological measurements
| CN | MCI-N | MCI-C | AD | p-value | Post hoc | |
|---|---|---|---|---|---|---|
| N | 44 | 36 | 44 | 41 | ||
| Mattis Dementia Rating Scale (ref) | 138.9 (3.9) | 133.7 (5.8) | 129.0 (7.1) | 119.1 (9.7) | < 0.0001 | CN > MCI-N > MCI-C > AD |
| MMSE | 29.3 (1.2) | 28.2 (1.6) | 27.2 (1.9) | 24.3 (3.4) | < 0.0001 | CN > MCI-N > MCI-C > AD |
| Digit Span- Forward | 9.1 (1.9) | 7.8 (1.8) | 7.6 (1.9) | 7.4 (2.2) | < 0.001 | CN > MCI = AD |
| Digit Span- Backward | 7.1 (1.9) | 5.3 (1.9) | 5.4 (2.0) | 4.8 (1.8) | < 0.0001 | CN > MCI = AD |
| Trail Making Test – A (seconds) | 32.2 (9.2) | 41.6 (14.7) | 48.3 (24.2) | 62.4 (32.5) | < 0.0001 | CN < MCI-C; CN = MCI- N; CN, MCI < AD |
| Trail Making Test – B (seconds) | 79.8 (22.1) | 142.1 (68.6) | 158.5 (82.2) | 217.6 (83.6) | < 0.0001 | CN < MCI-N = MCI-C < AD |
| Trail Making Test C – (seconds) | 81.0 (26.0) | 164.2 (92.7) | 201.8 (106.7) | 299.3 (100.6) | < 0.0001 | CN < MCI-N = MCI-C < AD |
| CVLT (total) | 46.6 (8.2) | 31.1 (7.3) | 28.6 (7.4) | 24.0 (7.8) | < 0.0001 | CN > MCI-C = MCI-N > AD |
| CVLT long delay free recall | 10.5 (2.5) | 4.1 (2.8) | 2.5 (2.7) | 1.4 (2.0) | < 0.0001 | CN > MCI-N > MCI-C > AD |
| CVLT long delay cued recall | 11.6 (2.3) | 6.0 (2.5) | 4.8 (2.8) | 3.4 (2.2) | < 0.0001 | CN > MCI-N > MCI-C > AD |
| 10/36 Spatial Recall (total) | 18.9 (5.0) | 15.7 (5.5) | 15.2 (3.8) | 11.5 (3.2) | < 0.0001 | CN > MCI-N = MCI-C > AD |
| 10/36 Spatial Recall (delayed) | 6.7 (2.1) | 5.3 (2.0) | 4.6 (1.8) | 3.5 (1.5) | < 0.0001 | CN > MCI-N = MCI-C > AD |
| WMS Logical Memory I | 27.7 (5.1) | 21.7 (7.2) | 15 (5.7) | 9.8 (6.2) | < 0.0001 | CN > MCI-N > MCI-C > AD |
| WMS Logical Memory II | 24.0 (5.1) | 15.6 (8.1) | 6.7 (5.6) | 2.8 (4.1) | < 0.0001 | CN > MCI-N > MCI-C > AD |
| WMS Logical Memory Recognition | 86.4 (8.1) | 68.4 (24.0) | 40.5 (29.3) | 21.1 (22.4) | < 0.0001 | CN > MCI-N > MCI-C > AD |
| WMS Visual Recall I | 75.1 (13.2) | 62.4 (13.3) | 53.7 (14.3) | 39.7 (13.7) | < 0.0001 | CN > MCI-N > MCI-C > AD |
| WMS Visual Recall II | 50.7 (18.9) | 31.0 (15.3) | 12.8 (12.7) | 7.7 (10.4) | < 0.0001 | CN > MCI-N > MCI-C = AD |
| WMS-Visual Reproduction Recognition | 66.5 (20.7) | 49.2 (19.7) | 21.5 (19.3) | 16.3 (19.0) | < 0.0001 | CN > MCI-N > MCI-C = AD |
| CLOX-1 | 12.1 (1.9) | 11.2 (2.0) | 10.9 (2.3) | 9.3 (2.9) | < 0.0001 | CN > MCI-C = MCI-N > AD |
| CLOX-2 | 13.6 (1.2) | 13.0 (1.4) | 12.9 (1.4) | 12.0 (1.7) | < 0.0001 | CN = MCI-N; CN > MCI- C; CN, MCI > AD |
| Boston Naming Test-30 item | 27.6 (2.0) | 24.8 (5.5) | 24.5 (4.5) | 23.7 (4.6) | <0.001 | CN>MCI-N,MCI-C,AD |
| Animals (n=163) | 20.2 (4.3) | 16.4 (5.0) | 14.7 (3.6) | 11.9 (3.9) | < 0.0001 | CN> MCI-N=MCI-C>AD |
| Clothing (n=164) | 18.6 (3.4) | 16.4 (3.6) | 14.4 (3.8) | 12.2 (3.3) | < 0.0001 | CN>MCI-N> MCI-C>AD |
| Fruits and vegetables (n=164) | 20.5 (4.4) | 17.4 (3.3) | 13.9 (3.7) | 12.2 (3.8) | < 0.0001 | CN>MCI-N> MCI-C>AD |
| Supermarket (n=162) | 24.8 (4.9) | 23.5 (5.2) | 18.5 (5.6) | 14.9 (5.2) | < 0.0001 | CN, MCI-N> MCI-C>AD |
| Vegetables (n=105) | 16.0 (4.1) | 12.3 (3.2) | 10.3 (3.2) | 9.2 (3.2) | < 0.0001 | CN>MCI-N> MCI-C=AD |
CN = cognitively normal participant, MCI-N = mild cognitive impairment- non-converter, MCI-C = mild cognitive impairment- converter, AD = Alzheimer disease, MMSE = Mini-mental status exam. CVLT = California Verbal Learning Test. WMS = Wechsler Memory Scale. P-values were determined by one-way ANOVA or by Fisher exact test, where appropriate. Post hoc tests included t-tests for continuous variables and χ2 or Fisher exact tests for categorical variables. Numbers in parentheses represent standard deviations.
Data for two of the MCI-C participants were not available for this analysis, leaving 44 MCI-C participants. From among the unambiguously diagnosed participants in the other three groups, i.e., 54 CN, 57 MCI-N, and 50 AD participants, subgroups were manually selected using an Excel spreadsheet to statistically match the MCI-C participants as closely as possible with regard to age, sex, and educational level. Within these constraints, we made an effort to include MCI-N participants with more annual follow-up visits, as we had greater confidence that these participants were clinically distinct from the MCI-C group. This matching process yielded the final study sample of 44 cognitively normal controls (CN), 80 MCI patients (of whom 44 converted to AD), and 41 AD patients (Table 1). The total number of selected participants was 165 (49.5% of the total COINS sample).
Table 1.
Demographic and Functional Data
| CN | MCI-N | MCI-C | AD | p-value | Post hoc | ||
|---|---|---|---|---|---|---|---|
| N | Baseline | 44 | 36 | 44 | 41 | ||
| Baseline+Y1 | 39 | 36 | 44 | 11 | |||
| Baseline+Y1+Y2 | 35 | 35 | 34 | 5 | |||
| Age (years) | Baseline | 70.5 (7.1) | 71.5 (6.2) | 72.8 (6.3) | 72.5 (6.0) | - | - |
| Sex (M:F) | Baseline | 17:27 | 14:22 | 20:24 | 26:15 | - | - |
| Education (years) | Baseline | 14.4 (2.2) | 14.8 (2.9) | 14.6 (3.2) | 14.0 (3.0) | - | - |
| Annual follow-up visits | Baseline | 3.2 (1.8) | 3.5 (1.2) | 2.8 (1.5) | 0.6 (1.2) | < 0.0001 | CN=MCI, CN>AD MCI-N> MCI-C>AD |
| CDR-SOB | Baseline | 0.2 (0.1) | 1.1 (0.6) | 1.9 (0.8) | 4.0 (1.4) | < 0.0001 | CN>MCI-N> MCI-C>AD |
| CDR increase | Year 1 | 3/39 | 13/36 | 25/44 | 3/10 | ||
| Year 2 | 3/35 | 12/35 | 18/34 | 2/4 | |||
| FCI | Baseline | 231.2 (10.8) | 214.1 (24.1) | 207.9 (27.1) | 184.2 (34.3) | < 0.0001 | CN> MCI-N=MCI-C>AD |
| FCI decrease | Year 1 | 6/38 | 7/34 | 15/43 | 5/11 | ||
| Year 2 | 6/34 | 7/33 | 11/34 | 1/5 |
CN = cognitively normal participant, MCI-N = mild cognitive impairment- non-converter, MCI-C = mild cognitive impairment- converter, AD = Alzheimer disease, MMSE = Mini-mental status exam (Folstein, Folstein, & McHugh, 1975), CDR-SOB = Clinical Dementia Rating Sum of Boxes score. Baseline = measurements from all subjects who entered study. Baseline+Y1 = subjects at baseline who had year-1 follow-up data. Baseline+Y1+Y2 = subjects at baseline who had two years of follow-up data. P-values were determined by one-way ANOVA across all four groups or by Fisher exact test, where appropriate. Post hoc tests included t-tests for continuous variables and χ2 or Fisher exact tests for categorical variables. Numbers in parentheses represent standard deviations. For cognitive and demographic measurements broken down by the baseline+Y1 and Y1+Y2 subsets of participants, see supplementary table e-1.
2.2. Participants—validation sample
Classifiers (described below) were tested on a group of 65 participants from a separate study of functional change in MCI. These participants were recruited between 2009 and 2013 from the Memory Disorders Clinics at the Birmingham Veterans Affairs Medical Center (BVAMC) and the University of Alabama at Birmingham. A consensus panel assigned diagnoses on the basis of each participant’s subjective memory complaints, neuropsychological test results, and an informant-based interview regarding instrumental activities of daily living. The consensus diagnoses rendered by the panel for these 65 subjects included 35 CN subjects, 21 MCI, and 9 mild AD. Three subjects (from an original sample of 68) were excluded from this analysis, one due to suspected intoxication, one due to diagnosis of non-Alzheimer’s dementia, and one who had been a member of the training sample. The neuropsychological battery included two semantic fluency tasks (animals and fruits and vegetables) that overlapped with those of the previous study, permitting estimation of risk for functional decline using two random forest classifiers trained with data from these two tasks.
2.3. Standard protocol approvals, registrations, and patient consents
Written informed consent was obtained from each study participant. The UAB institutional review board (IRB) approved the use of human subjects for the study that provided the data used for training the classifiers. The study that provided the validation sample was approved by both the UAB IRB and the IRB of the BVAMC.
2.4. Study measures
2.4.1. AD diagnosis and MCI conversion
The diagnosis of AD at baseline or following a previous diagnosis of MCI (i.e., conversion) was determined in consensus conference, as described above, using the National Institute for Neurological and Communicative Disorders and Stroke-Alzheimer’s Disease and Related Disorders Association criteria (McKhann, Drachman, Folstein, Katzman, Price, & Stadlan, 1984).
2.4.2. Clinical Dementia Rating
The Clinical Dementia Rating (CDR) is a composite measure of cognition and daily functioning (Morris, 1993). For this study, the outcome measure used was the “sum of boxes” (CDR-SOB) score, derived by adding together scores derived from direct and informant-based assessments of memory, orientation, judgment and problem solving, community affairs, home and hobbies, and personal care.
2.4.3. Financial Capacity Instrument
Financial capacity was directly assessed annually using the Financial Capacity Instrument (FCI) (Marson, et al., 2000). The FCI is a standardized psychometric instrument assessing nine domains of financial knowledge and skills, with each domain consisting of tasks of varying complexity, such as counting coins or preparing bills for mailing (Griffith, et al., 2003). The FCI has demonstrated high levels of reliability and validity in previous studies of healthy controls and persons with AD and MCI (Marson, et al., 2000; Griffith, et al., 2003; Okonkwo, Wadley, Griffith, Ball, & Marson, 2006). Trained technicians administered and scored the FCI using criteria described elsewhere (Marson, et al., 2000). In the present study, the primary FCI variable of interest was a global score using the sum of domains 1–7 and 9, which are (1) basic monetary skills, (2) financial concepts, (3) cash transactions, (4) checkbook management, (5) bank statement management, (6) financial judgment, (7) bill payment, and (9) investment decision making.
2.4.4. Neuropsychological tests
Apart from the outcome measures described above, the main cohort of participants (used for classifier training) undertook an extensive battery of neuropsychological tests, including tests of global cognitive ability (mini-mental state exam (Folstein, Folstein, & McHugh, 1975) and Mattis Dementia Rating Scale), attention (Trail Making Test A (Reitan, 1958), digit span forward), episodic memory (Wechsler Memory Scale-III (WMS-III) Logical Memory (The Psychological Corporation, 1997), WMS-III Visual Reproduction, California Verbal Learning Test-II (Delis, Kramer, Kaplan, & Ober, 2000), and 10/36 Spatial Recall), executive function (Trail Making Tests B and C, WMS-III Digit Span Backwards, CLOX-1 and 2 clock-drawing tests), and language (Boston Naming Test (Kaplan, Goodglass, & Weintraub, 1983) and verbal fluency tests).
All participants from the training sample were administered up to five semantic fluency tasks during the course of neuropsychological assessment. The five categories assessed were animals, articles of clothing, fruits and vegetables, things one finds in a supermarket, and vegetables. For each task, the participant was given 60 seconds to list as many items as possible within a certain semantic category. The words generated by the participant were transcribed verbatim, including repetitions and out-of-category items. The handwritten lists were subsequently transcribed to electronic text files with repetitions and intrusions (out-of-category items) labeled accordingly. Uncertainty over poorly legible words was resolved by consensus among those performing the transcriptions (including authors DGC and PK), with the final decision made by the first author. The impact of poor legibility was greatly reduced by the fact that the tasks were semantically constrained. More than 99% of words were readily legible.
The sample of validation participants undertook a battery of neuropsychological tests, including a test of global cognitive function (the extended mini-mental state exam), sustained attention (Trail Making Test A), executive function (Trail Making Test B, verbal fluency for the letters F, A, and S), episodic memory (California Verbal Learning Test and 10/36 Spatial Recall), and semantic memory and language (Boston Naming Test, Pyramids and Palm Trees (Howard & Patterson, 1992), and verbal fluency for five categories not used in the classifiers).
Participants in the study that provided the validation sample were administered 10 fluency tasks, including two that overlapped with those undertaken by the other group (animals and fruits and vegetables). The other tasks included fluency for words starting with the letters F, A, and S, and semantic fluency tasks for the categories of tools, vehicles, boats, water creatures, and verbs. Methods of fluency list transcription and scoring were the same as those described above, but transcription and adjudication of poorly legible words were performed by authors TPD and DGC. The overall legibility of the words was comparable to the other data set (more than 99% unambiguously legible).
2.5. Data analyses
2.5.1. Baseline comparisons
Baseline demographic, clinical, and cognitive variables were compared across groups (CN, MCI-N, MCI-C, and AD) using one-way analysis of variance and post hoc t-tests (for continuous variables) and χ2 or Fisher exact tests (for categorical variables). See Tables 1 and 2.
2.5.2. Independent components analysis
One goal of this work was to explore the diagnostic and prognostic utility of scores derived automatically from the verbal fluency word lists using independent components analysis (ICA). ICA is a technique of “blind source separation” that takes as input a set of signals, each of which is assumed to be a mixture of signals from several independent sources. A classic illustrative example of ICA involves two microphones and two individuals, all situated some distance from one another in a room. The individuals speak simultaneously and each microphone records a mixture of the two voices. The ICA algorithm takes advantage of the fact that mixtures of signals tend to be more normally distributed than signals from a single source. Such differences enable ICA to “unmix” the two voice recordings into the two original source signals, i.e., the voices of the two individuals.
We assume that performance on fluency tasks is influenced by semantic associations (and probably other types of associations) that arise due to activity in a vast cerebral network. Many unconscious mental associations may occur in parallel. The shared nature of language and semantic knowledge imposes a general structure on such networks in the minds of individuals, but this structure may be influenced by education or impacted by disease.
We proposed to extract components from verbal fluency word lists, where each component represents a source signal comprising a large set of lexical or semantic associations (Figure 1). For this purpose, each verbal fluency word list was transformed into a matrix of word proximities, with proximity calculated as , where p2 was the position of the second word in the list, p1 was the position of first word, and L was the length of the list. Each matrix was square, with rows and columns equal to the total number of exemplars produced for each category (e.g., animal names). For example, if the third row and column represented the word “cat” and the fourth row and column represented the word “dog,” then the entry at row 3, column 4 was the proximity of the words “cat” and “dog” within each individual’s list. If the two words were produced as the first and second items in a list with 20 animal names, then the proximity would be 1.0 − (2 − 1)/20 = 0.95. Because the matrix was symmetric, only the entries above the diagonal were needed for ICA. These entries were simply transferred into a column vector in a consistent manner. Thus every verbal fluency list for a given task was transformed into a vector representing all of the word proximities within the list. The size of these vectors was the same within each fluency task, but varied across tasks. For example, a total of 380 different animal names were generated for the animals task. Thus, proximities from each list were loaded into a 380 × 380 matrix. Thus, the column vectors for this task all had (380 × 379)/2 = 72,010 entries. For simplicity, coordinates were assigned to words according to position in the alphabetized list, e.g., the proximities of words occurring in the same list as the word “aardvark” occupied the first row and column of each matrix. For each task, we transformed all available lists into vectors and placed all the vectors into a new matrix. For the animals task, this matrix had dimensions 72,010 × 557. ICA was performed on this matrix using the R library fastICA (Marchini, Heaton, & Ripley, 2012). Twenty components were extracted. We then derived twenty scores for each word list by calculating the dot product of the proximity vector with each of the extracted components.
Figure 1.
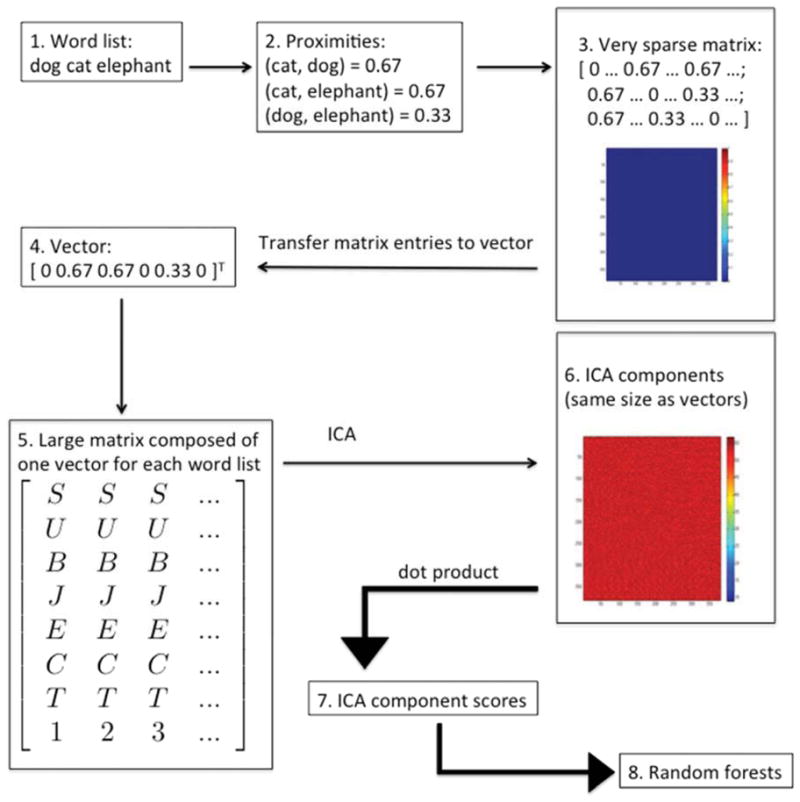
Description of procedure for deriving ICA component scores. (1) Semantic fluency lists were obtained from the participants. (2) The proximity of every pair of words in each list was calculated using the formula , where p2 was the position of the later word, p1 was the position of the earlier word, and L was the length of the list. (3) For each list, a sparse N × N proximity matrix was created, where N was the total number of all words generated (by all participants) for the given semantic category. (4) The entries in the upper triangular portion of each sparse matrix were transferred into a column vector in a fixed order. (The superscript T indicates the transpose of the row vector shown.) (5) Column vectors generated by this method were arranged in a large M × P matrix, where M = (N × (N−1))/2 and P = the number of verbal fluency lists available (at least 380, but up to 550). (6) Independent components analysis (ICA) was performed on the M × P matrix. The output of the ICA algorithm consists of component vectors the same size as the column vectors. One of these components is shown here, transformed back into a matrix the same size as the original sparse matrices (N × N). (7) Twenty component scores were obtained for each fluency list by computing the dot product of each ICA component with each column vector from the large matrix. (8) Component scores were then used as inputs to the random forests algorithm, along with raw scores and measures of clustering and switching.
2.5.3 Clustering and switching
As described above, the term “clustering” refers to the tendency for individuals to produce related words consecutively within lists, while the term “switching” refers to the deliberate transition between subcategories during a fluency task. We followed Troyer for the quantification of clustering and switching, beginning with published lists of subcategories and exemplars within each subcategory (Troyer, 2000). These previously published lists were developed for scoring the animals and supermarket tasks. For example, the animals list included subcategories by geographic region (e.g., African animals), natural habitat (e.g., water animals), and taxonomy (e.g., primates). The supermarket list included subcategories by store area (e.g., dairy), biochemical constituents (e.g., grain products), and specific meals (e.g., breakfast foods). We generated comparable lists for the remaining three tasks (fruits and vegetables, articles of clothing, and vegetables) and expanded the lists by means of a custom Python program that searched fluency word lists for uncategorized words and required user input to assign each new word to one or more categories. (Note that for this research it was not necessary to generate subcategory lists for the additional verbal fluency tasks that were performed only by the participants in the validation sample, such as vehicles.)
Clustering and switching scores were calculated automatically with a Python program, according to the rules set out in published work (Troyer, 2000; Troyer & Moscovitch, 2006). We operationalized these rules as follows. All clusters of consecutive words in a list that belonged to any common subcategory were identified. For example, in the sequence tiger, lion, cat, dog, wolf, the program identified the following clusters: tiger-lion-cat, cat-dog, and dog-wolf. In accordance with published methods, these were scored as the number of items in each cluster minus one, i.e., clusters of sizes 2, 1, and 1, for an average cluster size of 1.33. In the event that a cluster was a subset of another cluster, only the larger cluster was quantified. The number of switches was defined as the number of clusters minus one. The same programs were used to process the corresponding fluency lists from the participants in the validation sample (animals and fruits and vegetables). Use of computer programs for these tasks ensured consistency of scoring despite the necessarily large subcategory lists (see supplemental data for the actual subcategory lists).
We developed two new measures that were related to these clustering and switching measures. The measurement of clustering and switching relies heavily on adjacency of words. We wished to explore “generalized” measures of clustering and switching taking into account the proximities, rather than adjacencies, of semantically related or unrelated words. For each verbal fluency word list, we created a list of all pairs of words within the list and calculated the proximity for each pair using the formula described in section 2.5.2. This list of pairs was partitioned into those deemed to be semantically related and those deemed semantically unrelated, according to the subcategory listings described above. We calculated the generalized clustering score by averaging the proximities for the semantically related pairs and the generalized switching score by averaging the proximities for the semantically unrelated pairs.
2.5.4. Random forest classifiers
A random forest is an ensemble of decision trees (Breiman, 2001). Decision trees are classifiers, that is, numerical models that sort individual data points into two or more groups. In this work, the groups usually consisted of patients who did or did not worsen. Decision trees are constructed by an algorithm that (1) selects from among a set of candidate predictor variables the best variable for sorting the data points, (2) partitions the data points according to an optimal threshold, and (3) recursively applies the algorithm to the data points on both sides of the partition until all data points receive a classification. The main problem with decision trees is that they usually overfit the data, that is, they essentially “memorize” the data set in minute detail and many of these details are not actually relevant. Overfitting leads to poor performance when the classifier is tested on data points that were not in the training set.
The random forests algorithm is an effective method for overcoming the problem of overfitting. On each iteration of the algorithm, approximately two-thirds of the data points are randomly selected and a bootstrap sample (with replacement) is generated from the selected data points. This “bootstrap aggregate” sample is referred to as the in bag data and the unselected data points are referred to as out of bag (OOB) data. A decision tree is then grown using the in bag data. Random forests employ a slightly modified version of the decision tree algorithm described above: on each recursion of the algorithm, the set of candidate predictor variables is restricted to a randomly selected subset. If there are N predictor variables, this subset is usually restricted to have √N members. When the decision tree is complete, it is tested on the OOB data and the percentage of incorrect classifications is reported as the OOB error for that tree. One may grow any number of decision trees, but most random forests consist of 50–1000 trees. These trees act as an ensemble to classify new data points, and the performance of the ensemble on new data points is almost always better than any individual decision tree. To classify a new data point, the data point is presented to each tree in the random forest and the tree “votes” on which category the data point should be assigned to. Typically, the outcome of this voting process is determined by majority rule, but the proportion of trees voting for a classification may be used as an estimate of the probability that the data point belongs in that category.
Random forests have the additional advantage that one may rapidly calculate a measure of “importance” for the predictor variables. This calculation is performed for a given variable by randomly permuting the values of the variable and repeating the classification for the entire random forest. Shuffling the values of important variables leads to large increases in the OOB error. The size of this increase constitutes the importance measure. These importance measures provide methods both for interpreting the model and for selecting variables for use in other classifiers (which may be constructed using random forests or other classifier architectures). For the current research, random forest classifiers were generated in two steps (described below), using the randomForest library (version 4.6–6) (Liaw & Wiener, 2002) in the statistical programming language R (version 2.15.1) (R Core Team, 2012). We calculated correlation among trees in each random forest and OOB error.
2.5.4.1. Outcome: AD Diagnosis
An overview of the classifiers generated for this research is provided in Figure 2. For each of the five semantic fluency tasks, two random forest classifiers were trained to discern between CN and AD diagnoses using the baseline measurements from those groups. The first (“raw”) model made use of only demographic data and counts from the fluency lists (raw scores, perseverations, and intrusions). The second (“augmented”) model added clustering and switching scores as well as two new types of scores that we developed: ICA component scores and generalized versions of clustering and switching scores. The random forests algorithm was run once to measure the relative importance of the variables. A threshold was selected (absolute value of lowest negative importance value) and variables that met this threshold were left in the model for the second run of the algorithm. We then generated a sixth classifier by aggregating votes from all five random forests. Thus, a final estimate was produced for each participant by averaging together results from whichever fluency tasks were available for that individual. This method allowed us to include all participants in the final analysis, rather than only the subset that completed all of the fluency tasks. ROC curves were plotted and analyzed using the ROCR (Sing, Sander, Beerenwinkel, & Lengauer, 2009) and pROC (Robin, et al., 2011) libraries for R. Statistical testing of the ROC curves was performed using Delong’s test from the pROC library.
Figure 2.

Boxes and arrows description of methods for generating classifiers. (A) The classifier built for AD diagnosis included only the CN and AD participants. The gray arrows indicate the pathway for constructing classifiers using only raw scores and demographic data, while the black arrows indicate the pathway for constructing classifiers that incorporate latent information. (B) The classifier built for discerning MCI-C from MCI-N participants included only MCI participants. Gray and black arrows represent the same meaning as in Figure 2A. Dashed arrows represent the pathway used for constructing classifiers using only baseline data, while solid arrows represent the use of baseline+Y1 data. (C) The classifiers built for predicting CDR-SOB increase and FCI decrease included data from all participants. The numbers in the figure refer to the numbers of participants in each group at baseline. Arrows have the same meanings as in Figure 2B.
2.5.4.2. Other outcomes: measures of functional decline
Four classifiers for each fluency task were trained to predict each of the remaining three outcome measures (MCI conversion, CDR-SOB increase, and FCI decrease ≥ 10 points). MCI conversion classifiers used data only from the MCI-C and MCI-N participants: a raw model with all of the baseline measurements, a raw model with measurements at baseline and year 1 (baseline+Y1), and two augmented models using these same two data subsets. The same procedures described above for AD diagnosis were then followed, including aggregation of votes from all five fluency tasks. For CDR-SOB and FCI, data from all four participant groups were used, with baseline models predicting the relevant change at year 1 and baseline+Y1 models predicting the change at year 2.
2.5.5. Convergent validity with other neuropsychological measures
In order to assess the cognitive basis of the random forest classifications, the relationship between “risk” (as estimated by the random forest models) and neuropsychological raw scores was evaluated with Pearson correlation. Risk of each undesirable outcome (i.e., conversion, CDR-SOB increase, or FCI decrease) was estimated as the proportion of votes favoring that outcome for each baseline verbal fluency task. An overall risk score was then assigned to each participant by averaging risk scores from the verbal fluency lists provided by that participant at baseline. (We are using the term “risk” loosely here as shorthand for “proportion of votes in favor of an undesirable outcome.”)
2.5.6. Longitudinal stability of risk scores
In order to assess the ability of the baseline classifiers to categorize participants at future time points, risk scores were calculated as described above for every available verbal fluency list, including those acquired during follow-up visits one or more years after the baseline visit. For each year of follow up, participants seen during that year were assigned an overall risk score by averaging the risk scores from the verbal fluency lists they provided that year. The same cross-validation partitions described above were employed when these scores were calculated. That is, participants were divided into the same 10 groups used during classifier training and scores were assigned to each subject’s lists using a random forest that was trained using only subjects from the other nine groups. For each of the three predictive classifiers, Cronbach’s alpha was calculated for risk estimates over consecutive years, starting with the baseline evaluation and including each follow-up year in which a risk estimate was available for at least half of the participants. A bootstrap procedure was used to calculate the 95% confidence interval for Cronbach’s alpha. Risk levels for the two categories of participants were plotted at each year of follow up for each of the three predictive classifiers (MCI conversion, CDR-SOB increase, and FCI decrease).
2.5.7. Validation with a separate participant sample
Raw scores, clustering and switching scores, generalized clustering and switching scores, and ICA component scores were calculated for the validation sample, i.e., participants taking part in a separate study. Importantly, ICA component scores were generated using the ICA components from ICA performed with the original training sample. Random forest classifiers trained with fluency data from the animals and fruits and vegetables tasks were then used to generate vote counts for the participants in the validation sample and these vote counts were transformed into proportions (with larger proportions indicating relatively higher estimated risk for functional decline).
Longitudinal data on the participants from this sample are not yet available, so the actual accuracy of the classifiers cannot yet be determined. In lieu of this ideal analysis, we performed Pearson correlation between estimated risk and raw scores from the neuropsychological tests, anticipating strong negative correlations for tests known to be important in the identification of individuals at risk for AD, particularly tests of episodic memory.
3. Results
3.1. Group comparisons from main participant sample
Demographic, functional, and cognitive data on the participant sample used for classifier training at baseline are shown in Tables 1 and 2. (See Supplemental Table e-1 for the same measurements on relevant subsets of participants.) Participants were matched in terms of age, sex, and educational level. One-way ANOVA revealed a difference in the number of annual follow-up visits that they undertook (p < 0.0001) with participants diagnosed with AD at baseline returning for fewer follow-up assessments. Significant differences were observed among the four groups on all cognitive measures.
3.2. Diagnosis of AD
Baseline scores on 44 CN participants and 41 AD patients were entered into the random forests algorithm with diagnosis of AD as the outcome variable. Figure 3A shows ROC curves for raw (gray) and augmented (black) models created by aggregating votes across the first five classifiers. Table 3 shows measurements of prediction quality for these models based on aggregated votes. Both models exhibited high AUC measurements, although the AUC of the augmented model significantly exceeded that of the raw model (0.97 vs. 0.95, Z = 2.27, p < 0.05). Correlations among the trees (ρ) were higher for the raw model (0.68 vs. 0.57) as was OOB error (0.22 vs. 0.15).
Figure 3.

ROC curves of random forest classifiers constructed by aggregating votes from classifiers made from the five individual semantic fluency tasks. (A) Diagnosis of AD at baseline from semantic fluency raw scores (gray) and augmented scoring methods (black). (B) Prediction of conversion from MCI to AD using baseline semantic fluency raw scores (dashed gray), baseline+Y1 raw scores (gray), a baseline model with new scoring methods (dashed black), and baseline+Y1 augmented scores (black). (C) Increase in CDR-SOB one year after evaluation. The shading scheme is the same as for MCI conversion. (D) Decrease in FCI score ≥ 10 points one year after evaluation. The shading scheme is the same as for MCI conversion.
Table 3.
Performance of Aggregated Classifiers
| Baseline, Raw | Baseline, Augmented | Baseline+Y1, Raw | Baseline+Y1, Augmented | |
|---|---|---|---|---|
| AD Diagnosis | * | |||
| AUC | 0.95 (0.90–0.99) | 0.97 (0.95–1.0) | - | - |
| Accuracy | 0.89 | 0.94 | - | - |
| Sensitivity | 0.90 | 0.93 | - | - |
| Specificity | 0.89 | 0.95 | - | - |
| Positive Predictive Value | 0.88 | 0.95 | - | - |
| Negative Predictive Value | 0.91 | 0.93 | - | - |
| ρ, OOB error | 0.68, 0.22 | 0.57, 0.15 | ||
| MCI Conversion | ** | ** | ||
| AUC | 0.73 (0.62–0.84) | 0.88 (0.80–0.96) | 0.77 (0.67–0.87) | 0.91 (0.85–0.97) |
| Accuracy | 0.69 | 0.83 | 0.71 | 0.84 |
| Sensitivity | 0.64 | 0.77 | 0.66 | 0.84 |
| Specificity | 0.75 | 0.89 | 0.78 | 0.83 |
| Positive Predictive Value | 0.76 | 0.89 | 0.78 | 0.86 |
| Negative Predictive Value | 0.63 | 0.76 | 0.74 | 0.81 |
| ρ, OOB error | 0.35, 0.41 | 0.41, 0.32 | 0.40, 0.38 | 0.43, 0.28 |
| CDR-SOB Increase | ** | ** | ||
| AUC | 0.79 (0.71–0.87) | 0.90 (0.85–0.95) | 0.74 (0.65–0.84) | 0.89 (0.83–0.95) |
| Accuracy | 0.73 | 0.84 | 0.65 | 0.82 |
| Sensitivity | 0.85 | 0.78 | 0.67 | 0.84 |
| Specificity | 0.64 | 0.90 | 0.64 | 0.79 |
| Positive Predictive Value | 0.67 | 0.87 | 0.64 | 0.80 |
| Negative Predictive Value | 0.83 | 0.83 | 0.67 | 0.84 |
| ρ, OOB error | 0.46, 0.36 | 0.42, 0.29 | 0.40, 0.36 | 0.42, 0.33 |
| FCI Decrease | ns | ** | ||
| AUC | 0.80 (0.71–0.89) | 0.85 (0.76–0.94) | 0.72 (0.62–0.82) | 0.89 (0.83–0.96) |
| Accuracy | 0.78 | 0.84 | 0.66 | 0.81 |
| Sensitivity | 0.66 | 0.78 | 0.81 | 0.88 |
| Specificity | 0.82 | 0.86 | 0.58 | 0.78 |
| Positive Predictive Value | 0.55 | 0.66 | 0.48 | 0.65 |
| Negative Predictive Value | 0.88 | 0.92 | 0.87 | 0.93 |
| ρ, OOB error | 0.27, 0.42 | 0.24, 0.36 | 0.33, 0.43 | 0.31, 0.30 |
Numbers in parentheses are 95% confidence intervals. All comparisons are between the AUCs of an augmented model and the corresponding raw model. AUC = area under the ROC curve; ns = difference ROC curves is not statistically significant; ρ = average correlation among trees; OOB ERROR = out of bag error;
p < 0.05;
p < 0.01.
3.3. Classification of MCI converters and non-converters
The two MCI groups (36 MCI-N, 44 MCI-C) were entered into the random forests algorithm, using conversion (at any time point) as the outcome variable. All participants had at least one year of follow-up. Table 3 contains measurements of quality and Figure 3B shows ROC curves for the raw baseline model (gray-dashed), the raw baseline+Y1 model (gray-solid), the augmented baseline model (black-dashed) and the augmented baseline+Y1 model (black-solid). The augmented baseline+Y1 model performed best, with AUC 0.91. The difference between the corresponding raw and augmented models was statistically significant (baseline raw vs. augmented: Z = 2.69, p < 0.01; baseline+Y1 raw vs. augmented: Z = 3.15, p < 0.01). Despite the fact that the correlations among trees were higher for the augmented models, they exhibited a lower OOB error.
3.4. Identification of participants with increase in CDR-SOB
Table 1 shows the fraction of participants from each group with higher CDR-SOB score at follow-up year 1 or year 2. Table 3 contains measurements of quality and Figure 3C shows ROC curves for the four classifiers. The augmented baseline model performed best, with AUC 0.90. The difference between the corresponding raw and augmented models was statistically significant (baseline raw vs. augmented: Z = 3.75, p < 0.001; baseline+Y1 raw vs. augmented: Z = 2.63, p < 0.01). OOB error was lower for the augmented models than for the corresponding raw models, but the average correlation among trees did not follow a definite pattern. For the baseline only models, ρ was 0.46 (raw) vs. 0.42 (augmented), while for the baseline+Y1 models, ρ was 0.40 (raw) vs. 0.43 (augmented).
3.5. Identification of participants with decline in FCI
Table 1 shows the proportion of participants with declines of ≥ 10 points at follow-up year 1 or year 2. Table 3 contains measurements of quality and Figure 3D shows ROC curves for the four classifiers. The augmented baseline+Y1 model performed best, with AUC 0.88. The difference between the baseline+Y1 raw and augmented models was statistically significant (baseline raw vs. augmented: Z = 1.12, p > 0.05; baseline+Y1 raw vs. augmented: Z = 2.88, p < 0.01). OOB error and ρ were lower for augmented models than for the corresponding raw models.
3.6. Convergent validity with neuropsychological measures
Correlations of neuropsychological raw scores with risk estimates from the baseline, augmented classifiers are shown in Table 4. Risk scores from all three predictive classifiers correlated significantly with the following neuropsychological test scores: Mattis Dementia Rating Scale (total score, initiation and perseveration, and memory), Trail Making Test C, California Verbal Learning Test (total score), and WMS-Logical Memory (I, II, and recognition). Estimated risk of conversion to AD correlated with CVLT long delay free recall and WMS-Visual Reproduction recognition. Estimated risk of CDR-SOB increase correlated with digit span (forward and backward), Trail Making Tests A and B, 10/36 Spatial Recall (delayed), and the CVLT long delay free recall. Estimated risk of decline on the FCI correlated with digit span (forward and backward), Trail Making Tests A and B, 10/36 Spatial Recall (total and delayed), WMS-Visual Reproduction I, and the Boston Naming Test.
Table 4.
Correlation of “Risk” with Neuropsychological Test Scores
| Conversion | CDR Increase | FCI Decrease | |
|---|---|---|---|
| MMSE | −0.07 | −0.11 | −0.08 |
| Mattis Dementia Rating Scale-2 (DRS) | −0.35** | −0.54*** | −0.50*** |
| DRS - attention | −0.05 | −0.21 | −0.28* |
| DRS - conceptualization | 0.11 | −0.11 | −0.05 |
| DRS - construction | 0.10 | −0.02 | −0.04 |
| DRS – initiation and perseveration | −0.39*** | −0.42*** | −0.42*** |
| DRS - memory | −0.47*** | −0.52*** | −0.46*** |
| Digit Span- Forward | −0.18 | −0.29* | −0.28* |
| Digit Span- Backward | −0.18 | −0.33** | −0.35** |
| Trail Making Test – A (seconds) | 0.17 | 0.29** | −0.29** |
| Trail Making Test – B (seconds) | 0.21 | 0.32** | −0.32** |
| Trail Making Test – C (seconds) | 0.28* | 0.36** | −0.32** |
| CVLT (total) | −0.26* | −0.23* | −0.24* |
| CVLT long delay free recall | −0.25* | −0.26* | −0.12 |
| CVLT long delay cued recall | −0.17 | −0.20 | −0.21 |
| 10/36 Spatial Recall (total) | −0.12 | −0.17 | −0.24* |
| 10/36 Spatial Recall (delayed) | −0.19 | −0.23* | −0.24* |
| WMS Logical Memory I | −0.34** | −0.38*** | −0.30** |
| WMS Logical Memory II | −0.35** | −0.37*** | −0.31** |
| WMS Logical Memory Recognition | −0.30** | −0.30** | −0.24* |
| WMS Visual Recall I | −0.18 | −0.21 | −0.22* |
| WMS Visual Recall II | −0.21 | −0.17 | −0.18 |
| WMS Visual Recall Recognition | −0.22* | −0.15 | −0.16 |
| CLOX-1 | −0.03 | −0.04 | 0.04 |
| CLOX-2 | −0.02 | −0.03 | −0.08 |
| Boston Naming Test-30 item | −0.004 | −0.19 | −0.30** |
CDR = Clinical Dementia Rating; FCI = Financial Capacity Instrument; MMSE = mini-mental stat exam; CVLT = California Verbal Learning Test; WMS = Wechsler Memory Scale
p < 0.05;
p < 0.01;
p < 0.001
3.7. Longitudinal stability of risk scores
Figure 4 depicts the stability of the risk scores from the baseline classifiers over subsequent follow-up years. The clear delineation of risk for all three classifiers persisted for at least two years of follow up. Cronbach’s alpha for the three classifiers was calculated to be 0.85 for the MCI-conversion classifier (subset of 47/80 MCI participants with four years of follow-up, 95% CI 0.77–0.90), 0.84 for the CDR-SOB classifier (subset of 106/165 participants with three years of follow-up, 95% CI 0.79–0.88), and 0.85 for the FCI classifier (subset of 106/165 participants with three years of follow-up, 95% CI 0.80–0.89).
Figure 4.

Average level of risk within each group assigned by the baseline, augmented random forest classifiers at each follow-up year. Error bars represent standard error. The dashed lines represent risk level for the participants with the undesirable outcome as assigned by a classifier trained to predict conversion to AD (A), increase in CDR-SOB score (B), and decrease in FCI score of at least 10 points. Solid lines represent the level of risk assigned to participants without the undesirable outcome. Levels of risk are higher for the participants with the undesirable outcome for a minimum of two years after the baseline evaluation.
3.8. Validation sample
Two of the previously generated random forest classifiers were used to make predictions of risk for functional decline on a group of research subjects who had undertaken these two semantic fluency tasks as part of a separate study. Specifically, these were the baseline, augmented classifiers trained with data from the animals and fruits and vegetables tasks. Pearson correlations between estimated risks and neuropsychological test scores are shown in Table 4. All significant correlations were in the predicted direction (i.e., negative, except for positive correlations with the Trail Making Tests, in which higher scores indicate worse performance). The strongest correlations were with the CVLT and verbal fluency measures. No risk estimate correlated with either part of the Pyramids and Palm Trees. Estimated risk of increasing CDR-SOB score correlated with extended-MMSE score, and Trail Making Tests A and B. Estimated risk of decreasing score on the FCI correlated with three non-verbal measures: Trail Making Test B, and the total and delayed recall scores from the 10/36 Spatial Recall. Boston Naming Test scores correlated only with risk estimates from the conversion and CDR-SOB classifiers.
4. Discussion
We report the use of random forests with three methods of semantic fluency list scoring that potentially add to the value of the standard scoring method when predicting functional decline in individuals at risk for AD. These three scoring methods are: clustering and switching scores (Troyer & Moscovitch, 2006), generalized variants of clustering and switching scores, and scores derived from an ICA analysis of the verbal fluency lists. We find that these scoring methods, when used as predictors in random forest classifiers, improve on predictions of functional decline using only demographic variables and traditional scores (i.e., raw counts of valid items, intrusions, and repetitions). Estimates of risk based on these classifiers correlate with neuropsychological test scores, particularly those of episodic memory, in the original training sample and in a validation sample of participants from a separate study. Cronbach’s alpha is high for all three of the baseline classifiers over at least three years of follow-up, indicating good stability of the risk estimates over time.
Raw scores from verbal fluency tasks have utility for diagnosing dementia and for differentiating between AD and vascular dementia (Duff-Canning, Leach, Stuss, Ngo, & Black, 2004), and the current work demonstrates that raw scores remain useful for characterizing the population from which this participant sample was drawn. Despite the utility of the raw scores, however, we find that models augmented with newer methods of scoring outperform the models based on raw scores. AD diagnosis was significantly more accurate for the augmented model (AUC 0.97). For the three predictive models, the AUC of the best augmented model ranged from 0.89 to 0.91.
Random forests have advantages over standard statistical methods that make them useful for the approach presented here. First, they can give accurate results even when the relationship between the predictor and outcome variables is non-linear. Second, it is possible to generate a useful classifier when the number of predictors exceeds the number of subjects. Third, collinearity among the predictor variables does not prevent convergence of the model or diminish measures of predictor variable importance. However, rather than providing the user with a compact set of coefficients for interpretation, random forests provide only measures of variable importance, which are useful for variable selection but do not constitute a summary of the model.
We note that after the variable selection step every augmented model incorporated more than one ICA component score. Boxplots of the six most important variables for predicting MCI conversion from animal fluency data are shown in Figure 5. Four of these six variables are ICA component scores. Attempting to simplify the classifiers by omitting the ICA variables (not shown here) results in worsened performance. ICA stands out as potentially the most useful of the new scoring methods, based on the frequency with which ICA-derived variables exceed the threshold of variable importance for remaining in the model. ICA component scores have the disadvantage that they are not readily interpretable, but future work could address this by evaluating the correlation of specific, relevant ICA scores with neuropsychological tests or brain imaging. Switching scores and the generalized switching scores often meet the selection threshold. Examination of their relationship with risk of conversion reveals that higher switching scores are associated with lower risk of conversion, but generalized switching scores are associated with higher risk. This apparent contradiction is likely due to the fact that the generalized switching scores are based on proximities, which are normalized for list length and are therefore inflated by low raw scores. This work merely scratches the surface of potentially useful new scoring methods (see also Pakhomov & Hemmy, 2013).
Figure 5.

Box and whiskers plots depicting the values of the six most important variables for predicting MCI conversion from animal fluency data. The median values (heavy black horizontal line) are always lower for the MCI-C group, but each variable appears to have only weak independent value for discerning the groups. Note that four of the variables are ICA component scores and one of these variables exceeds the measured importance for the raw score (ICA Component 20).
Correlation of risk estimates from these classifiers with neuropsychological test scores in the original training sample and a separate validation sample (Tables 4 and 5) reveals a significant relationship between classifier output and episodic memory as measured with the CVLT in participant groups from both studies, WMS-Logical Memory in the training sample, and, to a limited extent, 10/36 Spatial Recall in both samples. These findings have potential importance, as episodic memory is the most commonly affected cognitive domain in MCI and AD. In general, the correlations with classifier output are strongest for verbal measures, and perhaps one should expect this finding, since the inputs are derived from purely verbal data. There are some correlations with non-verbal measures, suggesting that the method is sensitive to changes in domains outside of verbal semantics. For example, portions of the 10/36 Spatial Recall test correlate with output from the CDR classifier on the training data (delayed recall scores), and with output from the FCI classifier on both the training data and the validation data (total and delayed recall scores). Apart from strong correlations with FAS in the validation sample, there is evidence that the classifiers are detecting executive dysfunction as measured with non-verbal tests, based on the findings in the training sample that all three classifiers correlate with Trail Making Test C and two of the classifiers (for CDR and FCI) correlate with Trails B. This pattern is also observed in the validation sample, in which risk estimates from the CDR and FCI classifiers correlate with time to complete Trails B. The relatively greater association between estimated risk of FCI decrease and non-verbal neuropsychological measures in both participant samples suggests that the classifiers are sensitive to the relatively greater importance of non-verbal cognition for this particular outcome measure. The findings from the correlation analysis with the validation sample suggest that the output from the classifiers is sufficiently generalizable to warrant further longitudinal study.
Table 5.
Correlation of “risk” with neuropsychological test scores – validation sample
| Conversion | CDR Increase | FCI Decrease | |
|---|---|---|---|
| Extended MMSE | −0.20 | −0.39** | −0.25 |
| Trail Making Test – A (seconds) | 0.22 | 0.33* | 0.23 |
| Trail Making Test – B (seconds) | 0.15 | 0.32* | 0.39** |
| Verbal fluency for letters FAS | −0.40*** | −0.51*** | −0.32* |
| CVLT (total) | −0.38** | −0.59*** | −0.44*** |
| CVLT long delay free recall | −0.45*** | −0.49*** | −0.37** |
| CVLT long delay cued recall | −0.44*** | −0.48*** | −0.36** |
| 10/36 Spatial Recall (total) | −0.14 | −0.23 | −0.28* |
| 10/36 Spatial Recall (delayed) | −0.20 | −0.15 | −0.30* |
| Pyramids and Palm Trees – pictures | −0.17 | −0.22 | −0.04 |
| Pyramids and Palm Trees – words | −0.01 | −0.17 | 0.03 |
| Verbal fluency for water creatures | −0.43*** | −0.53*** | −0.39** |
| Verbal fluency for tools | −0.31* | −0.41*** | −0.01 |
| Verbal fluency for vehicles | −0.38** | −0.54*** | −0.32** |
| Verbal fluency for boats | −0.25* | −0.46*** | −0.24 |
| Verbal fluency for verbs | −0.25* | −0.55*** | −0.27* |
| Sum of semantic fluencies (excluding animals and fruits/vegetables) | −0.41*** | −0.64*** | −0.31* |
| Boston Naming Test-30 item | −0.42*** | −0.42*** | −0.25 |
CDR = Clinical Dementia Rating; FCI = Financial Capacity Instrument; MMSE = mini-mental state exam; CVLT = California Verbal Learning Test
p < 0.05;
p < 0.01;
p < 0.001
Several limitations of this research should be noted. First, although letter fluency tasks are known to be a useful complement to semantic fluency (Duff-Canning, Leach, Stuss, Ngo, & Black, 2004) we did not perform them on the participants in the training sample. Classifiers that use raw and augmented scores from letter fluency tasks might be more accurate than those presented here. Second, there is a risk of circularity in the prediction of conversion, CDR scores, and AD diagnosis based on verbal fluency scores, as the consensus team was not blinded to the raw scores for animals, clothing, or fruits and vegetables during the consensus meeting, nor were they blinded to the CDR. However, this concern does not relate to the finding that the augmented models outperformed the raw models. In addition, the consensus team was always blinded to all aspects of the FCI. A third limitation is that the use of handwritten verbal fluency transcriptions introduces some imprecision into the measurements. Although these measurements were made on electronic files with absolutely no typographical errors, the possibility of real-word, within-category substitutions by the technicians cannot be excluded. Future work will make use of audio recordings, which may improve the accuracy of transcription and will permit precise quantification of time between words. Fourth, the semantic category cues employed included three nested categories. That is, all vegetables are elements in the set of fruits and vegetables, and all fruits and vegetables are elements in the set of items one might find in a supermarket. It is common for such nested categories to be used in studies of verbal fluency (e.g., see Hodges & Patterson, 1995) and it is possible that their use may enhance the evaluation of fine-grained semantic distinctions that are clinically relevant. However, use of these overlapping categories could generate order effects in the neuropsychological battery as a whole. For example, patients with cognitive impairment could suffer greater semantic interference and generate more intrusions on the vegetables task as a result of having been recently asked to generate a list of fruits and vegetables. Alternatively, those with cognitive impairment could derive less benefit on the vegetables task due to poor memory for the fruits and vegetables task. Either of these possibilities could cause cognitively impaired individuals to perform worse on the vegetables task (which was administered last). The quality of the classifications described here could be enhanced by such order effects, which are a feature of the test battery as a whole rather than a feature specific to semantic fluency tasks. Finally, although we do offer some evidence that the measures generalize to unseen data points (i.e., the measures correlate with neuropsychological measures in a comparable sample), a better validation could be performed if longitudinal data were available on the participants from the second study. If such data were available, then the analysis could take advantage of the baseline+Y1 classifiers (instead of using the baseline classifiers only) and classifier performance could be characterized in terms of actual accuracy or AUC.
In summary, our results demonstrate that computerized analysis of semantic fluency lists can be used to generate sound predictions of functional decline. The artificial intelligence techniques described here, but potentially also other machine learning methods, such as deep belief networks (Hinton & Salakhutdinov, 2006) and AdaBoost (Freund & Schapire, 1997), may reveal a wealth of information relevant to the study of diseases that affect the brain when used in conjunction with verbal fluency tasks, which are widely used due to their brevity and ease of administration. The random forest classifiers generated for this work compare favorably with results reported on similar research subjects using classifiers based on more invasive, expensive, and time-consuming methods. Future work will address the potential of these methods to add to the predictive power of biological markers, such as brain imaging, genotype, or cerebrospinal fluid markers.
Supplementary Material
Acknowledgments
Funding sources: VA (E6553W) and NIH (2R01 AG021927 and 1P50 AG16582)
The research reported here was supported by the Department of Veterans Affairs, Veterans Health Administration, Rehabilitation Research and Development Service (E6553W, PI David Clark, Department of Neurology). In addition, the work was supported by grants 2R01 AG021927 (Marson, PI) and 1P50 AG16582 (Alzheimer’s Disease Research Center) (Marson, PI). Drs. Gary Cutter and Glenn L. Clark provided useful comments on an earlier version of the manuscript. Nana Tsuladze and David E. Quinlan assisted with electronic transcription of verbal fluency lists. The authors would like to thank Andrew Ng, Christopher Manning, and Daniel Jurafsky, whose massively open online courses in machine learning and natural language processing influenced this work.
Footnotes
Authorship Qualifications
Dr. Clark developed the methods of transcription and programs for data analysis, performed the statistical analysis, and drafted the initial manuscript. Dr. Clark is the PI on the study that provided the validation sample.
Dr. Kapur assisted with development of transcription methods and troubleshooting, performed transcription and adjudication of word lists, and provided feedback on the manuscript.
Dr. Geldmacher served on the diagnostic consensus team for the training sample and assisted with study conceptualization and manuscript preparation.
Dr. Brockington performed clinical evaluations on research subjects, served on the diagnostic consensus team for the training sample, and provided feedback on the manuscript.
Dr. Harrell performed clinical evaluations on research subjects, served on the diagnostic consensus team for the training sample, and provided feedback on the manuscript.
Mr. DeRamus assisted with transcription methods and troubleshooting, performed transcription and adjudication of word lists for the validation sample, and provided feedback on the manuscript.
Dr. Blanton served on the consensus panel for the validation sample and reviewed the manuscript.
Dr. Lokken served on the consensus panel for the validation sample and reviewed the manuscript.
Dr. Nicholas served on the consensus panel for the validation sample and reviewed the manuscript.
Dr. Marson developed the longitudinal study under which the training data sample was gathered, supervised neuropsychological testing of the participants, led the diagnostic consensus team for the training sample, and provided feedback on the manuscript.
Conflict of Interest Statement
Dr. Clark receives research support from the Department of Veterans Affairs [Career Development Award E6553W (PI)] and Alzheimer’s of Central Alabama; he receives royalty payments from UpToDate for articles on aphasia. He has received research support from the UAB Evelyn F. McKnight Brain Research Institute, from Neurochem, Inc. [CL-758007 (Coinvestigator)] and from NIH [1P50 AG16582-08 (Investigator), 5R01 AG021927-04 (Investigator), U01 AG24904-02 (Investigator)]. He has received funding for travel from Ceregene, Inc. He has provided a narrative patient history summary to a lawyer at the patient’s request and was a paid consultant in a criminal case.
Dr. Kapur reports no disclosures.
Dr. Geldmacher receives research support from Bayer, Baxter, Elan, and Eisai and acts as a paid consultant for Eisai, Janssen, and GlaxoSmithKline. He has received research support from the NIH [NIA #R01-AG28905 and P50 AG08012], the Ivy Fund and the Virginia Center on Aging.
Dr. Brockington receives research support from Baxter and has received research support from Bristol Myers Squibb, Lilly, Ceregene, and NIH [1P50 AG16582-08 (Investigator) and ADC-023-HU].
Dr. Harrell has received research support from the NIH [NIA 1R01 AG021927 (Coinvestigator) and NIA 1P50 AG16582 (Coinvestigator)] and receives royalty payments as Coinventor of CCTI assessment instrument, which is owned by UAB Research Foundation.
Mr. DeRamus has nothing to disclose.
Dr. Blanton has nothing to disclose.
Dr. Lokken has nothing to disclose.
Dr. Nicholas has been a consultant for UCB and Ipsen Pharmaceuticals. He has no financial conflict of interest.
Dr. Marson serves as a consultant for Medivation, Inc., for Rush University, the American Bar Association, and for the American Psychological Association; he receives research support from the NIH [NIHCD #1R01 HD053074 and NIA 2R01 AG021927-06A1]; he has received research support from the NIH [HD053074, NIA AG021927, AG16582, NIA Director’s Supplementary Reserve, AG24904, and AG10483]; he receives royalty payments as co-inventor of CCTI assessment instrument, which is owned by UAB Research Foundation (since 1996). He has provided expert consultation and testimony in approximately 30 legal cases.
Publisher's Disclaimer: This is a PDF file of an unedited manuscript that has been accepted for publication. As a service to our customers we are providing this early version of the manuscript. The manuscript will undergo copyediting, typesetting, and review of the resulting proof before it is published in its final citable form. Please note that during the production process errors may be discovered which could affect the content, and all legal disclaimers that apply to the journal pertain.
Bibliography
- Abwender D, Swan J, Bowerman J, Connolly S. Qualitative analysis of verbal fluency output: review and comparison of several scoring methods. Assessment. 2001;8(3):323–336. doi: 10.1177/107319110100800308. [DOI] [PubMed] [Google Scholar]
- Bakkour A, Morris J, Dickerson B. The cortical signature of prodromal AD: regional thinning predicts mild AD dementia. Neurology. 2009;72:1048–1055. doi: 10.1212/01.wnl.0000340981.97664.2f. [DOI] [PMC free article] [PubMed] [Google Scholar]
- Breiman L. Random forests. Machine Learning. 2001;45:5–32. [Google Scholar]
- Chapman R, Mapstone M, McCrary J, Gardner M, Porsteinsson A, Sandoval T, et al. Predicting conversion from mild cognitive impairment to Alzheimer’s disease using neuropsychological tests and multivariate methods. Journal of Clinical and Experimental Neuropsychology. 2011;33(2):187–199. doi: 10.1080/13803395.2010.499356. [DOI] [PMC free article] [PubMed] [Google Scholar]
- Clark D. Residual vectors for Alzheimer disease diagnosis and prognostication. Brain and Behavior. 2011;1(2):142–152. doi: 10.1002/brb3.19. [DOI] [PMC free article] [PubMed] [Google Scholar]
- Clark L, Gatz M, Zheng L, Chen Y, McCleary C, Mack W. Longitudinal verbal fluency in normal aging, preclinical and prevalent Alzheimer disease. Americal Journal of Alzheimer’s Disease and Other Dementias. 2009;24(6):461–468. doi: 10.1177/1533317509345154. [DOI] [PMC free article] [PubMed] [Google Scholar]
- Convit A, de Asis J, de Leon M, Tarshish C, De Santi S, Rusinek H. Atrophy of the medial occipitotemporal, inferior, and middle temporal gyri in non-dementia elderly predict decline to Alzheimer’s disease. Neurobiology of Aging. 2000;21:19–26. doi: 10.1016/s0197-4580(99)00107-4. [DOI] [PubMed] [Google Scholar]
- Cui Y, Liu B, Luo S, Zhen X, Fan M, Liu T, et al. Identification of conversion from mild cognitive impairment to Alzheimer’s disease using multivariate predictors. PLOS One. 2011;6(7):1–10. doi: 10.1371/journal.pone.0021896. [DOI] [PMC free article] [PubMed] [Google Scholar]
- Davatzikos C, Bhatt P, Shaw L, Batmanghelich K, Trojanowski J. Prediction of MCI to AD conversion, via MRI, CSF biomarkers, and pattern classification. Neurobiology of Aging. 2011;32:19–27. doi: 10.1016/j.neurobiolaging.2010.05.023. [DOI] [PMC free article] [PubMed] [Google Scholar]
- Delis D, Kramer J, Kaplan E, Ober B. California Verbal Learning Test. 2. San Antonio, TX: Psychological Corporation; 2000. [Google Scholar]
- Devanand D, Liu X, Tabert M, Pradhaban G, Cuasay K, Bell K, et al. Combining early markers strongly predicts conversion from mild cognitive impairment to Alzheimer’s disease. Biological Psychiatry. 2008;64(10):871–879. doi: 10.1016/j.biopsych.2008.06.020. [DOI] [PMC free article] [PubMed] [Google Scholar]
- Doody R, Ferris S, Salloway S, Sun Y, Goldman R, Watkins W, et al. Donepezil treatment of patients with MCI: a 48-week randomized, placebo-controlled trial. Neurology. 2009;72(18):1555–1561. doi: 10.1212/01.wnl.0000344650.95823.03. [DOI] [PubMed] [Google Scholar]
- Duff-Canning S, Leach L, Stuss D, Ngo L, Black S. Diagnostic utility of abbreviated fluency measures in Alzheimer disease and vascular dementia. Neurology. 2004;62:556–562. doi: 10.1212/wnl.62.4.556. [DOI] [PubMed] [Google Scholar]
- Fagundo A, Lopez S, Romero M, Guarch J, Marcos T, Salamero M. Clustering and switching in semantic fluency: predictors of the development of Alzheimer’s disease. International Journal of Geriatric Psychiatry. 2008;23:1007–1013. doi: 10.1002/gps.2025. [DOI] [PubMed] [Google Scholar]
- Folstein M, Folstein S, McHugh P. Mini-Mental State: a practical guide for grading the cognitive state of the patient for the physician. Journal of Psychiatry Research. 1975;12:189–198. doi: 10.1016/0022-3956(75)90026-6. [DOI] [PubMed] [Google Scholar]
- Freund Y, Schapire R. A decision-theoretic generalization of on-line learning and an application to boosting. Journal of Computer and System Sciences. 1997;55(1):119–139. [Google Scholar]
- Furney S, Kronenberg D, Simmons A, Guentert A, Dobson R, Proitsi P, et al. Combinatorial markers of mild cognitive impairment conversion to Alzheimer’s disease - cytokines and MRI measures together predict disease progression. Journal of Alzheimer’s Disease. 2011;26:395–405. doi: 10.3233/JAD-2011-0044. [DOI] [PubMed] [Google Scholar]
- Griffith H, Belue K, Sicola A, Krzywanski S, Zamrini E, Harrell L, et al. Impaired financial abilities in mild cognitive impairment: a direct assessment approach. Neurology. 2003;60(3):449–457. doi: 10.1212/wnl.60.3.449. [DOI] [PubMed] [Google Scholar]
- Hinton G, Salakhutdinov R. Reducing the dimensionality of data with neural networks. Science. 2006;313(5786):504–507. doi: 10.1126/science.1127647. [DOI] [PubMed] [Google Scholar]
- Hirshorn E, Thompson-Schill S. Role of the left inferior frontal gyrus in covert word retrieval: neural correlates of switching during verbal fluency. Neuropsychologia. 2006;44:2547–2557. doi: 10.1016/j.neuropsychologia.2006.03.035. [DOI] [PubMed] [Google Scholar]
- Hodges JR, Patterson K. Is semantic memory consistently impaired early in the course of Alzheimer’s disease? Neuroanatomical and diagnostic implications. Neuropsychologia. 1995;33(4):441–459. doi: 10.1016/0028-3932(94)00127-b. [DOI] [PubMed] [Google Scholar]
- Holland D, McEvoy LK, Desikan RS, Dale AM the Alzheimer’s Disease Neuroimaging Inititive. Enrichment and stratification for predementia Alzheimer’s disease clinical trials. PLoS One. 2012;7 (10):e47739. doi: 10.1371/journal.pone.0047739. [DOI] [PMC free article] [PubMed] [Google Scholar]
- Howard D, Patterson K. Pyramids and Palm Trees: a test of semantic access from pictures and words. London: Harcourt Assessment; 1992. [Google Scholar]
- Kaplan E, Goodglass H, Weintraub S. Boston Naming Test. Philadelphia: Lea & Febiger; 1983. [Google Scholar]
- Liaw A, Wiener M. Classification and regression by randomForest. R News. 2002;2(3):18–22. [Google Scholar]
- Marchini J, Heaton C, Ripley B. fastICA: FastICA algorithms for perform ICA and projection pursuit. 2012:1.1–16. Retrieved from http://CRAN.R-project.org/package=fastICA.
- Marson D, Sawrie S, Snyder S, McInturff B, Stalvey T, Boothe A, et al. Assessing financial capacity in patients with Alzheimer disease: a conceptual model and prototype instrument. Archives of Neurology. 2000;57(6):877–884. doi: 10.1001/archneur.57.6.877. [DOI] [PubMed] [Google Scholar]
- McKhann G, Drachman D, Folstein M, Katzman R, Price D, Stadlan E. Clinical diagnosis of Alzheimer’s disease: report of the NINCDS-ADRDA work group under the auspices of the Department of Health and Human Services Task Force on Alzheimer’s Disease. Neurology. 1984;34:939–944. doi: 10.1212/wnl.34.7.939. [DOI] [PubMed] [Google Scholar]
- Monsch A, Bondi M, Butters N, Paulsen J, Salmon D, Brugger P, et al. A comparison of category and letter fluency in Alzheimer’s disease and Huntington’s disease. Neuropsychology. 1994;8(1):25–30. [Google Scholar]
- Morris J. The clinical dementia rating (CDR): current version and scoring rules. Neurology. 1993;43:2412–2414. doi: 10.1212/wnl.43.11.2412-a. [DOI] [PubMed] [Google Scholar]
- Murphy K, Rich J, Troyer A. Verbal fluency patterns in amnestic mild cognitive impairment are characteristic of Alzheimer’s type dementia. Journal of the International Neuropsychological Society. 2006;12:570–574. doi: 10.1017/s1355617706060590. [DOI] [PubMed] [Google Scholar]
- Okonkwo O, Wadley V, Griffith H, Ball K, Marson D. Cognitive correlates of financial abilities in mild cognitive impairment. Journal of the American Geriatric Society. 2006;54:1745–1750. doi: 10.1111/j.1532-5415.2006.00916.x. [DOI] [PubMed] [Google Scholar]
- Pakhomov S, Hemmy L. A computational linguistic measure of clustering behavior on semantic verbal fluency task predicts risk of future dementia in the Nun Study. 2013 doi: 10.1016/j.cortex.2013.05.009. S0010-9452(13)00137-8. [DOI] [PMC free article] [PubMed] [Google Scholar]
- Palmqvist S, Hertze J, Minthon L, Wattmo C, Zetterberg H, Blennow K, et al. Comparison of brief cognitive tests and CSF biomarkers in predicting Alzheimer’s disease in mild cognitive impairment: six-year follow-up study. PLOS One. 2012;7(6):1–7. doi: 10.1371/journal.pone.0038639. [DOI] [PMC free article] [PubMed] [Google Scholar]
- Petersen R, Doody R, Kurz A, Mohs R, Morris J, Rabins P, et al. Current concepts in mild cognitive impairment. Archives of Neurology. 2001;58(12):1985–1992. doi: 10.1001/archneur.58.12.1985. [DOI] [PubMed] [Google Scholar]
- Petersen R, Smith G, Waring S, Ivnik R, Tangalos E, Kokmen E. Mild cognitive impairment: clinical characterization and outcome. Archives of Neurology. 1999;56:303–308. doi: 10.1001/archneur.56.3.303. [DOI] [PubMed] [Google Scholar]
- Powell M, Smith G, Knopman D, Parisi J, Boeve B, Petersen R, et al. Cognitive measures predict pathologic Alzheimer disease. Archives of Neurology. 2006;63:865–868. doi: 10.1001/archneur.63.6.865. [DOI] [PubMed] [Google Scholar]
- Pozueta A, Rodriguez-Rodriguez E, Vazquez-Higuera J, Mateo I, Sanchez-Juan P, Gonzalez-Perez S, et al. Detection of early Alzheimer’s disease in MCI patients by the combination of MMSE and an episodic memory test. BMC Neurology. 2011;11(78):1–5. doi: 10.1186/1471-2377-11-78. [DOI] [PMC free article] [PubMed] [Google Scholar]
- Price S, Kinsella G, Ong B, Storey E, Mullaly E, Phillips M, et al. Semantic verbal fluency strategies in amnestic mild cognitive impairment. Neuropsychology. 2012;26(4):490–497. doi: 10.1037/a0028567. [DOI] [PubMed] [Google Scholar]
- R Core Team. R: a language and environment for statistical computing. R Foundation for Statistical Computing; 2012. Retrieved from http://www.R-project.org/ [Google Scholar]
- Reitan R. Validity of the Trail Making test as an indicator of organic brain damage. Perceptual Motor Skills. 1958;8:271–276. [Google Scholar]
- Robin X, Turck N, Hainard A, Tiberti N, Lisacek F, Sanchez JC, et al. pROC: an open-source package for R and S+ to analyze and compare ROC curves. BMC Bioinformatics. 2011;12:77. doi: 10.1186/1471-2105-12-77. [DOI] [PMC free article] [PubMed] [Google Scholar]
- Salloway S, Correia S, Richardson S. Key lessons learned from short-term treatment trials of cholinesterase inhibitors for MCI. International Psychogeriatrics. 2007;20(1):40–46. doi: 10.1017/S1041610207005650. [DOI] [PubMed] [Google Scholar]
- Sing T, Sander O, Beerenwinkel N, Lengauer T. ROCR: Visualizing the performance of scoring classifiers. 2009:1.0–4. doi: 10.1093/bioinformatics/bti623. Retrieved from http://CRAN.R-project.org/package=ROCR. [DOI] [PubMed]
- Tabert M, Manly J, Liu X, Pelton G, Rosenblum S, Jacobs M, et al. Neuropsychological prediction of conversion to Alzheimer disease in patients with mild cognitive impairment. Archives of General Psychiatry. 2006;63:916–924. doi: 10.1001/archpsyc.63.8.916. [DOI] [PubMed] [Google Scholar]
- Thal L, Ferris S, Kirby L, Block G, Lines C, Yuen E, et al. A randomized, double-blind, study of rofecoxib in patients with mild cognitive impairment. Neuropsychopharmacology. 2005;30(6):1204–1215. doi: 10.1038/sj.npp.1300690. [DOI] [PubMed] [Google Scholar]
- The Psychological Corporation. WAIS-III - WMS-III technical manual. San Antonio: Harcourt Brace & Co; 1997. [Google Scholar]
- Triebel K, Martin R, Griffith H, Marceaux J, Okonkwo O, Harrell L, et al. Declining financial capacity in mild cognitive impairment: a 1-year longitudinal study. Neurology. 2009;73:928–934. doi: 10.1212/WNL.0b013e3181b87971. [DOI] [PMC free article] [PubMed] [Google Scholar]
- Troyer A. Normative data for clustering and switching on verbal fluency tasks. Journal of Clinical and Experimental Neuropsychology. 2000;22(3):370–378. doi: 10.1076/1380-3395(200006)22:3;1-V;FT370. [DOI] [PubMed] [Google Scholar]
- Troyer A, Moscovitch M. Cognitive processes of verbal fluency tasks. In: Poreh A, editor. The Quantified Process Approach to Neuropsychological Assessment. New York, New York: Taylor and Francis; 2006. pp. 143–157. [Google Scholar]
- Troyer A, Moscovitch M, Winocur G, Alexander M, Stuss D. Clustering and switching on verbal fluency: the effects of focal frontal- and temporal-lobe lesions. Neuropsychologia. 1998;36(6):499–504. doi: 10.1016/s0028-3932(97)00152-8. [DOI] [PubMed] [Google Scholar]
- Visser P, Verhey F, Hofman P, Scheltens P, Jolles J. Medial temporal lobe atrophy predicts Alzheimer’s disease in patients with minor cognitive impairment. Journal of Neurology, Neurosurgery, and Psychiatry. 2002;72:491–497. doi: 10.1136/jnnp.72.4.491. [DOI] [PMC free article] [PubMed] [Google Scholar]
- Vogel A, Gade A, Stokholm J, Waldemar G. Semantic memory impairment in the earliest phases of Alzheimer’s disease. Dementia and Geriatric Cognitive Disorders. 2005;19:75–85. doi: 10.1159/000082352. [DOI] [PubMed] [Google Scholar]
- Walhovd K, Fjell A, Brewer J, McEvoy L, Fenneme-Notestine C, Hagler D, et al. Combining MR imaging, positron emission tomography, and CSF biomarkers in the diagnosis and prognosis of Alzheimer disease. American Journal of Neuroradiology. 2010;31:347–354. doi: 10.3174/ajnr.A1809. [DOI] [PMC free article] [PubMed] [Google Scholar]
- Westman E, Muehlboeck JS, Simmons A. Combining MRI and CSF measures for classification of Alzheimer’s disease and prediction of mild cognitive impairment conversion. NeuroImage. 2012;62:229–238. doi: 10.1016/j.neuroimage.2012.04.056. [DOI] [PubMed] [Google Scholar]
- Ye J, Farnum M, Yang E, Verbeeck R, Lobanov V, Raghavan N, et al. Sparse learning and stability selection for predicting MCI to AD conversion using baseline ADNI data. BMC Neurology. 2012;12(46):1–12. doi: 10.1186/1471-2377-12-46. [DOI] [PMC free article] [PubMed] [Google Scholar]
- Zhang D, Shen D ADNI. Predicting future clinical changes of MCI patients using longitudinal and multimodal biomarkers. PLOS One. 2012;7(3):1–15. doi: 10.1371/journal.pone.0033182. [DOI] [PMC free article] [PubMed] [Google Scholar]
Associated Data
This section collects any data citations, data availability statements, or supplementary materials included in this article.