Abstract
Background
Antiretroviral drugs are used for the treatment and prevention of HIV infection. Non-adherence to antiretroviral drug regimens can compromise their clinical efficacy and lead to emergence of drug-resistant HIV. Clinical trials evaluating antiretroviral regimens for HIV treatment and prevention can also be compromised by poor adherence and non-disclosed off-study antiretroviral drug use. This report describes the development and validation of a high throughput, qualitative method for the identification of antiretroviral drugs using high-resolution mass spectrometry (HRMS) for the retrospective assessment of off-study antiretroviral drug use and the determination of potential antiretroviral therapy (ART) non-compliance.
Methods
Serum standards were prepared that contained 15 antiretroviral drugs: 9 protease inhibitors (PIs), 4 nucleotide/nucleoside reverse transcriptase inhibitors (NRTIs), and 2 nonnucleoside/nucleotide reverse transcriptase inhibitors (NNRTIs). Analytical separation was achieved on a Hypersil Gold PFP (100 × 3 mm) column and the eluent was analyzed using the Thermo Exactive Orbitrap mass spectrometer (Exactive-MS) operated in full scan mode. Limit of identification, signal intensity precision, retention time analysis, selectivity, and carryover studies were conducted. Concordance with liquid chromatographic-tandem mass spectrometric (LC-MS/MS) methods was evaluated using remnant plasma samples from a clinical trial.
Results
The limit of identification ranged from 5-10 ng/ml for 14 drugs (9 PIs, 1 NNRTI, 4 NRTIs) and was 150 ng/ml for 1 NNRTI. Precision studies with high and low control mixtures revealed signal intensity coefficients of variation of 3.0-27.5%. The Exactive-MS method was selective for the compounds of interest. Overall, concordance ranged from 89.1%-100% for the screening of antiretroviral drugs in clinical plasma specimens as compared to LC-MS/MS methods.
Conclusion
Using the Exactive-MS, we developed and validated a highly selective, robust method for the multiplexed detection of 15 antiretroviral drugs.
Keywords: antiretroviral, clinical trials, high-resolution mass spectrometry, Exactive-MS, validation
1.0 Introduction
An estimated 34 million people are living with human immunodeficiency virus/acquired immune deficiency syndrome (HIV/AIDS) worldwide, with approximately 2.5 million new infections occurring annually [1]. Numerous antiretroviral drugs are approved for HIV treatment by the United States Food and Drug Administration (FDA) in single drug and multi-drug formulations [2]. The most widely used classes of antiretroviral drugs are nucleoside/nucleotide reverse transcriptase inhibitors (NRTIs), non-nucleoside reverse transcriptase inhibitors (NNRTIs), and protease inhibitors (PIs) [3,4]. Antiretroviral drugs were first introduced in the late-1980s; however, subsequent research demonstrated that potent, multi-drug regimens are needed for durable suppression of viral replication and clinical benefit [3]. Most antiretroviral treatment regimens include two NRTIs with an NNRTI or PI [4,5]. Newer classes of antiretroviral drugs include entry inhibitors, fusion inhibitors, and integrase inhibitors [6,7].
While antiretroviral drugs are effective for treatment of HIV infection, non-adherence to treatment regimens can lead to treatment failure and emergence of drug-resistant HIV strains [8,9]. Adherence counseling is an important component of HIV treatment. However, the complexity of treatment regimens, adverse events, and other factors can reduce adherence [9,10]. Antiretroviral drugs are also used for HIV prevention in a variety of settings, including prevention of mother-to-child transmission, pre-exposure prophylaxis in HIV-uninfected individuals (PrEP), and “treatment for prevention” in HIV-infected individuals [11-13]. A variety of approaches have been used for adherence monitoring in clinical trial settings (e.g., self-report, pill counts, electronic monitoring, monitoring pharmacy refills); however, each of these approaches has limitations [14,15]. Furthermore, some participants in clinical trials may not disclose that they are using antiretroviral drugs provided outside of the study [16,17]. For example, in the HIV Prevention Trials Network (HPTN) 052 study [18], some HIV-infected participants who reported that they were antiretroviral drug naïve at study enrollment had antiretroviral drugs detected in their blood that indicated that they were on antiretroviral treatment [17].
The limitations of self-report and other approaches used for adherence monitoring highlight the need for rapid, high-throughput methods that can be used for the direct detection of antiretroviral drugs in clinical and research settings. Several methods are available for the quantification of a single antiretroviral agent in plasma. The majority of these approaches involve liquid chromatographic-tandem mass spectrometric (LC-MS/MS) analysis in selected reaction monitoring (SRM) mode. However, since antiretroviral regimens almost always include a combination of drugs, and since study participants may access a variety of antiretroviral medications outside of clinical trials, laboratory methods are needed that can detect a large number of antiretroviral drugs, ideally in a single analytical run. To address this need, sensitive methods have been developed for simultaneous quantification of 12-18 drugs (including PIs, NRTIs, and NNRTIs) in a single chromatographic run using LC-MS/MS techniques [19-21]. However, those methods may not include newer antiretroviral drugs [19,20]. Further, while SRM-based quantitative analysis is useful for pharmacokinetic studies, qualitative, multiplexed methods may be more suitable for evaluation of non-compliance or off-study use of antiretroviral drugs, similar to qualitative methods used for monitoring pain management regimens, as well as drugs of abuse. With existing challenges to antiretroviral therapy (ART) adherence, including healthcare systems and socioeconomic factors, qualitative identification of drugs to assess compliance is warranted [22]. Therapeutic drug monitoring of antiretroviral classes is dependent on inter-individual pharmacokinetic variability, as well as the identification of a range that discriminates a therapeutic drug concentration from a toxic concentration. Because the treatment of HIV infection requires multi-drug regimens that may act antagonistically or synergistically, and several collections may be needed to understand the pharmacokinetic parameters of the drug, routine quantitative monitoring of antiretroviral drugs is not commonly performed [23].
Many methods currently available for drug monitoring use a triple quadrupole mass analyzer operated in SRM mode. In this report, we exploit high-resolution mass spectrometry (HRMS) for qualitative drug detection; HRMS has previously been pursued for the identification of other compounds in biological matrices [24-28]. An advantage of this approach is that instruments used for HRMS may be operated in a full scan mode, in which all ions are detected and analyzed by the mass spectrometer. A major benefit of using HRMS for antiretroviral drug detection is that sample data may be retrospectively analyzed for analytes that were not part of the initial screening assessment (e.g., other antiretroviral drugs, substances of abuse); this increases the flexibility of data collection and review. Current analyzers that offer high resolution accurate mass determination include time of flight (TOF) instruments, as well as instruments using Orbitrap technology. The Orbitrap consists of an outer barrel-like electrode and a co-axial central electrode; ions within the Orbitrap oscillate around this central electrode [29]. Mass to charge ratios are measured from the frequency of harmonic ion oscillations around this central electrode along the axis of the electrostatic field [29, 30]. The frequency of these oscillations are detected and transformed into mass spectra via Fourier-transformation [29]. The Orbitrap offers high mass accuracy set at thresholds of ± 5 ppm of theoretical mass values [29]. Currently, the Thermo Exactive mass spectrometer (Exactive-MS) uses the Orbitrap for HRMS; the Exactive-MS also contains a higher-energy collision cell, in which trapped ions may be subjected to high-energy collision-induced dissociation potentials, generating fragment ions [31]. Fragmentation may also occur at the ionization source through the application of increased voltage. The work described in this report uses the Exactive-MS for the development, validation and application of a method for the retrospective, simultaneous, qualitative detection of 15 antiretroviral agents used for HIV treatment and prevention.
2.0 Experimental
2.1 Chemicals
The antiretroviral agents monitored by this method include PIs [amprenavir (APV), atazanavir (ATV), darunavir (DRV), indinavir (IDV), lopinavir (LPV), nelfinavir (NFV), ritonavir (RTV), saquinavir (SQV) and tipranavir (TPV)]; NRTIs [emtricitabine (FTC), lamivudine (3TC), tenofovir (TFV) and zidovudine (ZDV)]; and NNRTIs [efavirenz (EFV) and nevirapine (NVP)]. These drugs were obtained as stock powder solutions through the AIDS Research and Reference Reagent Program (Pathogenesis and Basic Research Branch, Division of AIDS, NIAID, NIH; https://www.aidsreagent.org/index.cfm). Stock solutions were reconstituted in methanol or water (TFV and ZDV), depending on solubility, to master stock concentrations of 1 or 2 mg/ml. To ensure proper sample preparation and Exactive-MS analysis, an external reference molecule (morphine-D3, Toronto Research Chemicals, North York, ON) was included. Drug-free human serum was acquired from BioRad Laboratories (Irvine, CA). Formic acid was from Sigma-Aldrich. Drug-free human K2 EDTA plasma was acquired from Bioreclamation. Acetonitrile, acetone and methanol (all Optima-grade), and high performance liquid chromatography (HPLC)-grade water were from Fisher Scientific. HPLC-grade isopropanol was rom JT Baker.
2.2 Preparation of Reagents and Standards
To identify the specific retention times and fragmentation patterns for each analyte, working stock solutions were prepared from master stocks to final concentrations of 100 µg/ml and 10 µg/ml in 1:1 methanol:water. For each analyte, diluted stocks (1,000, 500, 250, 150, 100, 50, 25, 10 and 5 ng/ml) were prepared by spiking human serum with appropriate volumes from working solutions. After determining analyte-specific retention times and confirmation of fragment ions, when applicable, the 15 antiretroviral agents were combined from master stock solutions and prepared to the aforementioned final concentrations by spiking human serum or K2 EDTA plasma with appropriate volumes from combined working solutions. A standard mixture of morphine-d3 was prepared in acetonitrile at a final concentration of 125 ng/ml. Sample preparation involved combining 100 μl of spiked serum or subject specimen with 300 μl of acetonitrile containing morphine-d3, an easily-ionized species that was used to assess processing and analytical integrity of a specimen. The mixture was then briefly vortexed and centrifuged at 12,000 × g for 5 min at room temperature. Entire supernatants were evaporated to dryness using a Biotage SPE Dry 96 well plate dryer with the application of constant airflow, and subsequently reconstituted in 150 μl water; 30 μl of reconstituted samples were subjected to chromatographic separation.
2.3 Instrument and Acquisition Parameters
The liquid chromatography system consisted of an Aria TLX1 system (Thermo Fisher Scientific) equipped with a CTC HTC PAL Autosampler with a sample stack maintained at 4°C and 2 Transcend pumps. The TLX1 chromatography system was also configured with two 6-port switching valves controlled by the Aria OS software (Thermo Fisher). The autosampler was programmed to inject 30 μl of sample into the TLX1 system. Analytical separation was achieved using the Thermo Scientific Hypersil Gold PFP, 100 × 3 mm column, with a 3 μm particle size (Thermo Fisher). Mobile phase A consisted of water with 0.1% acetic acid, while mobile phase B consisted of acetonitrile with 0.1% acetic acid. The chromatographic run began with 30 sec of mobile phase A, followed by a 60 sec ramp to 10% mobile phase B. This slow ramp facilitated the elution of water-soluble analytes. The chromatographic separation continued with a step to 15% mobile phase B followed by a ramp to 95% mobile phase B over 600 seconds. Following the elution of all analytes, the column was washed for 60 sec with a 2:2:1 ratio of isopropanol:acetonitrile:acetone. The column was then re-equilibrated for 180 sec with mobile phase A. The total analytical run time for this method is 16.0 minutes and occurs at a flow rate of 500 μl/minute.
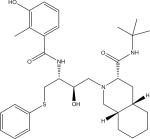
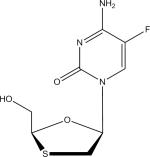
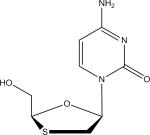
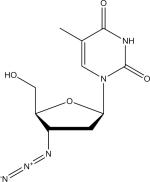
Detection of antiretroviral agents was performed using the Exactive-MS (Thermo Fisher) with a heated electrospray-ionization source in positive ionization mode and full scan mode. The Exactive-MS method included two scan events in positive polarity: one full scan event with ultra-high resolution (100000 @ 1Hz) and an additional scan event with in-source collision-induced dissociation (SCID) at 45eV with enhanced resolution (25000 @ 4Hz). All scan events were programmed for 100 msec maximum injection time and balanced automatic gain control (AGC) intensity targets. Additionally, instrument parameters were optimized, including sheath gas flow rate (20), discharge current (5 μA), capillary temperature (250°C), capillary voltage (10 V), tube lens voltage (140 V), skimmer voltage (12 V) and vaporizer temperature (250°C), through the analysis of an extracted 500 ng/ml ARV mixture prepared in serum. Since this method includes a variety of structurally dissimilar compounds, the mass spectrometer parameters identified as optimal were based on the highest signal intensity and fragment identification for analytes of interest. The aforementioned parameters were optimal for protease inhibitors, as well as several NRTIs and NNRTIs, including 3TC and FTC (NRTIs), and NVP (NNRTI). Antiretroviral molecular structures, precursor ion m/z ([M+H+]), and monitored fragments, when applicable, are described in Table 1.
Table 1.
Antiretroviral agents monitored in Exactive-MS method.
| Antiretroviral Agent | Structure | Molecualar Formula | [M+H]+ (m/z) | Fragment Ions |
|---|---|---|---|---|
| Protease Inhibitors | ||||
| Amprenavir (APV) |

|
C25H35N3O6S | 506.2319 | 245.1637 |
| Atazanavir (ATV) |
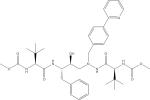
|
C38H52N6O7 | 705.3970 | 335.1948 168.0801 |
| Darunavir (DRV) |

|
C27H37N3O7S | 548.2425 | 392.1989 69.0335 |
| Indinavir (IDV) |

|
C36H47N5O4 | 614.3701 | 513.2847 465.2845 421.2339 |
| Lopinavir (LPV) |

|
C37H48N4O5 | 629.3697 | 447.2621 183.1121 155.1172 |
| Nelfinavir (NFV) |
|
C32H45N3O4S | 568.3204 | 467.2342 330.1142 |
| Ritonavir (RTV) |

|
C37H48N6O5S2 | 721.3200 | 296.1413 268.1465 |
| Saquinavir (SQV) |

|
C38H50N6O5 | 671.3915 | 570.3052 433.1853 |
| Tipranavir |

|
C31H33F3N2O5S | 603.2135 | 585.1999 375.2175 333.1707 |
| Nucleotide/Nucleoside Reverse Transcriptase Inibitors | ||||
| Emtricitabine (FTC) |
|
C8H10FN3O3S | 248.0500 | 130.0406 |
| Lamivudine (3TC) |
|
C8H11N3O3S | 230.0594 | 95.0237 |
| Tenofovir (TFV) |

|
C9H14N5O4P | 288.0856 | 176.0923 |
| Zidovudine (ZDV) |
|
C10H13N5O4 | 268.1040 | 127.0497 |
| Non-nucleoside Reverse Transcriptase Inhibitors | ||||
| Efavirenz (EFV) |
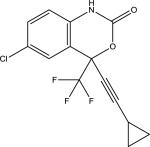
|
C14H9ClF3NO2 | 316.0347 | N/A |
| Nevirapine (NVP) |
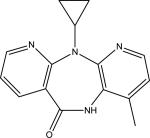
|
C15H14N4O | 267.1240 | 227.0924 226.0837 107.0599 |
2.4 Data Evaluation
Data analysis included automated review using the ToxID 2.1.1 and Xcalibur 2.2 programs (Thermo Fisher). Using the ToxID 2.1.1 data review software package, antiretroviral drug detection was evaluated in an automated manner, based on the presence of exact mass (± 5 ppm from theoretical mass), retention time (± 0.4 min from control standards), and the presence of fragments (with the exception of EFV, in which no fragment ions were observed). The presence of fragments was based on the identification of a fragment ion with an exact mass (±5 ppm from theoretical mass) as well as the identification of the fragment at the same retention time as the precursor drug. It should be noted that while signal intensity was not used as a specific acceptance criteria, identified fragments yielded signal intensities approximately one order of magnitude lower than the intensity observed for the precursor compound. Signal intensity thresholds were based on validation metrics, including limit of identification and carryover studies.
Fragment prediction was determined using the MassFrontier 7.0 (Thermo Fisher) prediction utility, which determines fragmentation based on theoretical models, as well as fragments based on a software-provided library containing known published fragmentation data. While alternative approaches, including the direct infusion of a neat mixture of an ARV agent, could also be used to empirically select for fragment ions, prediction software was employed to identify species that result from fragmentation at susceptible chemical bonds and particular structural moieties. This approach avoids the inclusion of fragments based on potential adducts or fragments formed through secondary decompositions involving randomized rearrangements, which do not denote specific structural moieties, thereby reducing the reporting of falsely positive results. Predicted fragments were confirmed via spectral deconvolution, in which the ion spectra from the higher energy in-source CID scan event were evaluated for the presence of predicted fragment ions.
Potential positives for EFV and ZDV, which did not consistently elicit fragments, were manually confirmed using the XCalibur 2.2 software. The presence of the analyte at the correct retention time (± 0.4 min) was assessed using post-processing mass filters with a ± 5 ppm threshold from theoretical mass. This manual review was performed for EFV because no fragment ion was identified, and for ZDV because fragmentation was not observed at concentrations <50 ng/ml.
3.0 Method Validation
The validation metrics assessed for this qualitative method included: analyte signal and retention time within-run precision, limit of identification, carryover, selectivity, and method concordance studies.
3.1 Precision
Within-run precision was evaluated for each analyte when standards were run five times within a single run as: (1) a high control mixture containing 1000 ng/ml of all analytes, and (2) a low control mixture containing 400 ng/ml of EFV and 50 ng/ml of the remaining 14 analytes. Mean signal intensities and retention times, as well as standard deviations (SD) and coefficients of variation (% CV), were assessed at each level. Within-run precision studies were also conducted for the morphine-d3 external reference molecule.
3.2 Limit of Identification and Carryover Analysis
For limit of identification (sensitivity) studies, antiretroviral agents were prepared at the aforementioned concentrations in drug-free human serum. The limit of identification was based on the lowest concentration at which a precursor ion was observed using a ± 5 ppm threshold from theoretical mass, retention time, and the presence of fragments. Notable exceptions for fragment identification include EFV at all analyzed concentrations, and ZDV at concentrations <50 ng/ml. The limit of identification was further established by comparing the signal intensity threshold of the lowest concentration that met the aforementioned criteria with a post-injection serum blank following an extracted specimen containing a 2.5 μg/ml mixture of the 15 antiretroviral agents.
Further, to illustrate comparability between plasma and serum matrices, ARV mixtures were spiked into drug-free human plasma to yield final concentrations of 1,000, 500, 250, 150, 100, 50, 25, 10 and 5 ng/ml of each antiretroviral drug. Samples were extracted as previously described and analyzed in parallel with serum-spiked specimens at the aforementioned concentrations. Samples were analyzed in triplicate and observed mean analyte peak areas, as well as SDs and %CVs were calculated across each level. Further, a % difference was determined by calculating the difference between the plasma-spiked mixture and the serum-spiked mixture, divided by the serum-spiked mixture, and multiplied by 100.
3.3 Selectivity
To assess assay selectivity, five specimens free of antiretroviral agents were extracted as previously described. Results were reviewed using both the automated ToxID 2.1.1 and manual Xcalibur 2.2 software modules. Additionally, a 250 ng/ml ARV mixture was spiked into a series of solutions containing varying levels of bilirubin, hemoglobin, and lipids. Samples were extracted in triplicate and analyzed using the Exactive-MS method. A significant interference was determined as a decrease in peak area for an ARV drug >50% as compared to analyte peak area spiked into a solution with no interferent present. Sample indeces were determined on a cobas® series analyzer (Roche Diagnostics).
3.4 Method Comparison
Sixty-four plasma specimens were obtained from the HIV Trials Prevention Network (HPTN) 052 study [18]. These specimens were previously analyzed by the Clinical Pharmacology Analytical Laboratory (Division of Clinical Pharmacology, Johns Hopkins University School of Medicine) [17]. The previous analysis involved 3 LC-MS/MS methods (3 separate assays) using a triple quadrupole mass analyzer. One LC-MS/MS method identified the following analytes (PIs and NNRTIs) with a cutoff of 100 ng/ml: APV, ATV, DRV, EFV, IDV, LPV, NFV, RTV, SQV and TPV; a second LC-MS/MS method detected the NRTI 3TC and the NNRTI NVP, with a limit of identification of 20 ng/ml; a third LC-MS/MS method detected the NRTIs FTC, TFV, and ZDV with a limit of identification of 5 ng/ml. In this study, these plasma specimens were analyzed in a blinded manner using the qualitative, Exactive-MS method described above. Overall concordance between the two approaches was determined as the number of specimens that showed agreement based on the limits of identification for the Exactive-MS and the LC-MS/MS methods.
4.0 Results and Discussion
4.1 Full-Scan Ion Acquisition
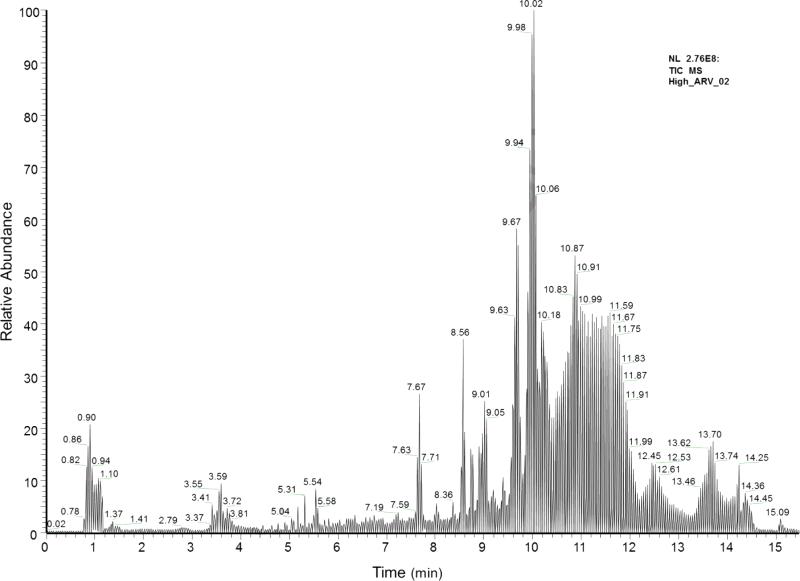
In this work, the Exactive-MS was used for the qualitative monitoring of 15 antiretroviral agents. The described method was developed to retrospectively test blood specimens for off-study use of antiretroviral drugs in a clinical study, and may be applied to assess ART non-compliance. The Exactive-MS was operated in full scan mode, with two positive scan events. A representative total ion chromatogram of antiretroviral agents spiked into drug-free human serum is shown in Fig. 1. Since all ions are recorded using this approach, the Exactive-MS allows for the retrospective detection of analytes of interest. This non-targeted ion collection offers enhanced flexibility for post-hoc data analysis and specimen querying. HRMS has been used in the analysis and detection of synthetic cannabinoids, as well as organic pollutants and drugs of abuse [25-28,32,33,34]. By extension, study specimens analyzed for the presence of antiretroviral agents could also be retrospectively queried for other compounds (e.g., substances of abuse). The developed method was designed for the rapid and robust identification of antiretroviral drugs in a qualitative manner. Targeted quantitative analyses could be performed using SRM-based LC-MS/MS methods with the inclusion of an isotopically-labeled internal standard or structural analog.
Fig. 1.
Total ion chromatogram from the Exactive-MS method collected in positive ionization mode. Representative chromatogram of 1000 ng/ml antiretroviral mixture spiked into drug-free human serum.
4.2 Analyte Identification Criteria
Antiretroviral agent detection in the raw data form was based on expected retention time, mass accuracy, and the presence of at least one fragment ion, with the exceptions of EFV and ZDV concentrations <50 ng/ml. Analyte detection was based on strict mass accuracy (± 5 ppm) and retention time (± 0.4 min) tolerance thresholds. These tolerance thresholds have been previously described and implemented in the qualitative monitoring of large panels of molecules using HRMS [25, 35]. The retention time and mass accuracy thresholds provide high selectivity in antiretroviral identification and reduce the probability of reporting false positives. An external reference molecule (morphine-d3) was added during initial protein precipitation, to monitor sample and analytical quality. This approach has been utilized in previously reported Exactive-MS methods [36,37].
Retention time windows were determined via the analysis of each antiretroviral agent individually on the Exactive-MS. Using the Xcalibur 2.2 software, retention time and mass filters were applied to view ion spectra and chromatograms, respectively. Fragment ions for the 15 ARVs, with the exception of EFV, were determined using the fragment prediction module of MassFrontier version 7.0; fragment ions were confirmed via spectral deconvolution (described in the methods section, Table 1). For each protonated molecular species, [M+H+], a mass filter was applied with a mass accuracy tolerance of (± 5 ppm) from theoretical mass. Using parameters offered by the Xcalibur 2.2 software module, ion spectra were reviewed to identify fragment ions across the scanning range of the precursor peak. Fragment ion generation was achieved via the incorporation of an enhanced resolution scan event performed during in-source collision-induced dissociation (SCID). The fragment ions used for antiretroviral identification are consistent with fragment ions observed in the literature.
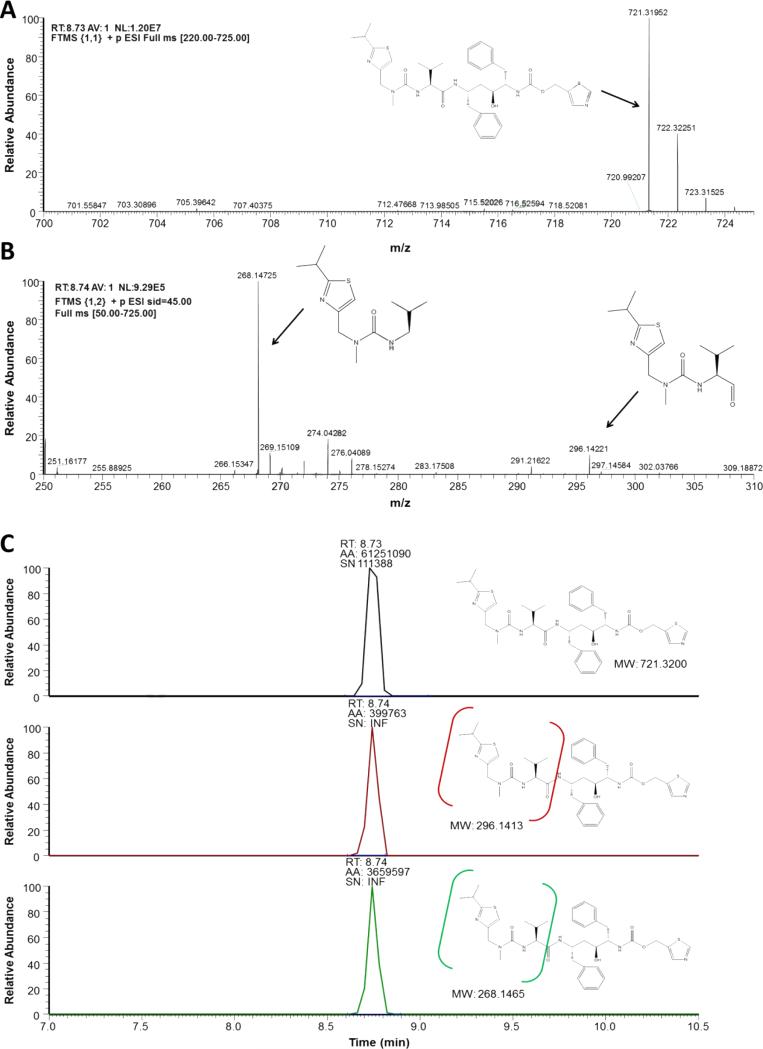
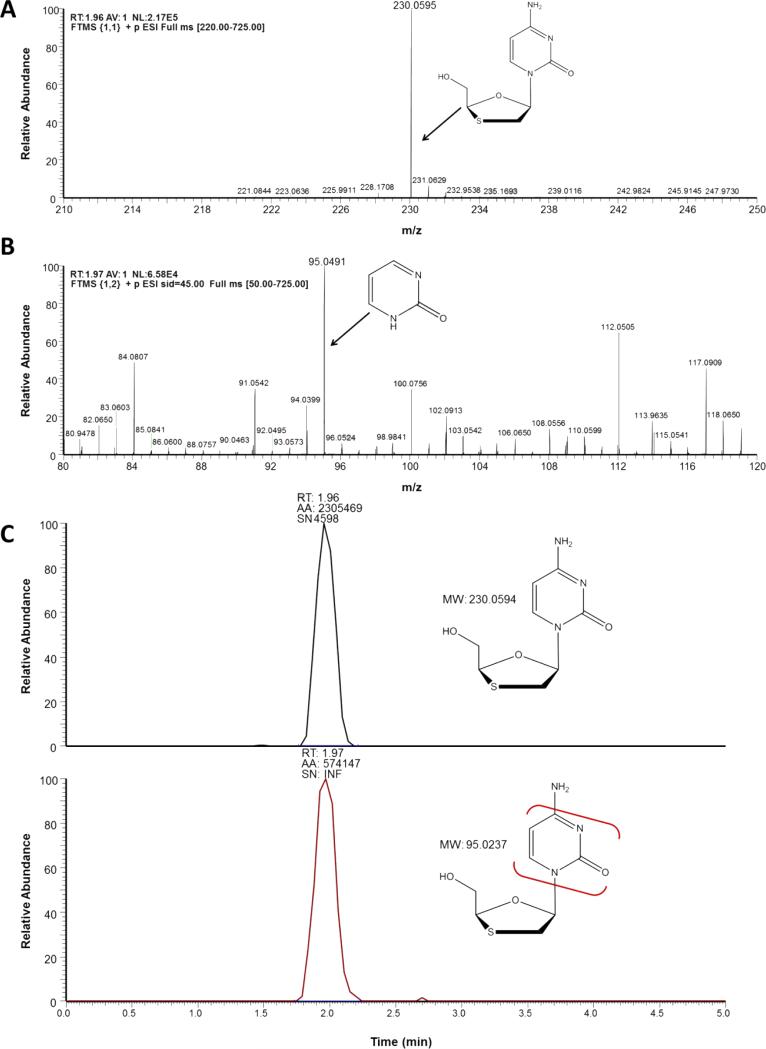
An example of ion spectra and mass filtering for the PI, RTV, ritonavir (RTV) and the NRTI, 3TC, are depicted in Fig. 2 and Fig. 3, respectively. Using the aforementioned thresholds, ion spectral analysis for RTV (CH37H48N6O5S2) depicts the [M+H+] protonated species at 8.73 minutes (Fig. 2A). Analysis for abundant fragment ions at that retention time in the 45 eV SCID scanning event depicts two well- characterized fragment ions of RTV (Fig. 2B) [38]. Applying the appropriate mass filters to the total ion chromatogram indicates the presence of the precursor RTV molecule at 8.73 minutes, as well as the two fragment peaks (Fig. 2C). It should be noted that the configurations of these fragments is tentative, and based on the predicted cleavage of structural moieties; however, the aforementioned fragment ions, at m/z 268 and m/z 296, have been previously used for both RTV identification as well as quantification [38]. This approach is also depicted for the NRTI 3TC (Fig. 3A-3C) [39,40]. While many LC-MS/MS methods indicate a 3TC fragment at m/z 112, our mass spectrometric methods indicate the highest abundance ion was detected at m/z 95 across tested concentrations [40,41].
Fig. 2.
Ion spectra of ritonavir generated by Exactive-MS (A) with the inclusion of an in-source collision-induced dissociation scan event for fragment production and detection (B) . Based on the m/z fragment ions monitored, we postulate that the m/z 268 and m/z 296 fragment ions were formed through the cleavage of a keto-isopropyl linkage and an amide bond, respectively. Retention time determination through the application of a mass filter with ± 5 ppm discrimination from theoretical mass of precursor and fragment ions (C).
Fig. 3.
Ion spectra of lamivudine generated by Exactive-MS (A) with the inclusion of an in-source collision-induced dissociation scan event for fragment production and detection (B) .The 95 m/z fragment ion was likely formed through the loss of the oxathiol moiety and subsequent loss of a NH3 constituent. Retention time determination through the application of a mass filter with ± 5 ppm discrimination from theoretical mass of precursor and fragment ions (C).
4.3 Limit of Identification Analysis
Following the establishment of retention time thresholds and fragment ion identification, the Exactive-MS method was evaluated for selectivity, limit of identification, precision and carryover. Selectivity was assessed through the analysis of 5 antiretroviral-negative remnant serum samples. No antiretroviral drugs were detected in the 5 specimens (data not shown), indicating the selectivity of the high resolution accurate mass thresholds and retention time windows for the qualitative detection of antiretroviral agents.
Limit of identification (sensitivity) analysis was determined as the lowest concentration for each analyte at which the previously described identification criteria were met: ±5 ppm accuracy from theoretical mass, retention time ± 0.4 minutes, and identification of at least one fragment ion. The limits of identification for the protease inhibitors APV, ATV, IDV, LPV, NFV, RTV, SQV, TPV, the NRTI 3TC and the NNRTI NVP were 5 ng/ml. The limits of identification for the NRTIs FTC, TFV and ZDV and the PI DRV were 10 ng/ml. Lastly, the limit of identification for the NNRTI EFV was 150 ng/ml. All antiretroviral agents were detected in positive ionization mode. Due to the structural disparities between antiretroviral compound classes, analytical separation and analyte ionization was optimized for the majority of analytes. Consequently, TFV fragmentation was not observed <10 ng/ml and ZDV fragmentation was not observed <50 ng/ml. In addition to studies in serum, comparison studies were performed in drug-free plasma. There were no significant changes observed with regard to the limit of identification of the analytes across the aforementioned tested concentrations (data not shown). A comparison of coefficients of variation for serum and plasma-prepared samples, as well as the percent difference between matrices is demonstrated for the NRTI FTC in Supplemental Table 1. Based on these data, although serum prepared solutions were analyzed for validation metrics, plasma samples may be evaluated using the described method.
Traditional mass spectrometric methods identify the NNRTI EFV in negative ionization mode, largely due to the presence of a highly electronegative CF3 constituent (Table 1) [42]. However, consistent with previously published observations, analyte detection in negative ionization mode significantly impacted overall peak shape and sensitivity of the NRTI TFV [43]. Notably, negative ionization mode significantly compromised the generation of the well-characterized TFV fragment ion, which lacks a phosphomethoxy group, and has a mass to charge ratio of m/z 176.0923 [43]. Therefore, the described Exactive-MS method was operated in positive ionization mode. A driving factor in the rationale to optimize the method for TFV is because TFV is commonly used for HIV treatment [5,44] and co-formulated TFV plus FTC (marketed as Truvada®, Gilead Sciences) has been shown to be effective for PrEP in some settings [13]. Further, pharmacokinetic analyses of these drugs indicate a five to ten-fold increase in the steady state concentration of EFV compared to TFV when administered at fixed doses [45,46]. Thus, a 150 ng/ml cutoff was deemed acceptable for the qualitative monitoring of EFV.
4.4 Precision and Carryover Studies
Precision studies were performed on both high (1000 ng/ml all compounds) and low (400 ng/ml EFV and 50 ng/ml all other drugs) mixtures of antiretroviral agents spiked in human serum (Table 2). For signal intensity, % CVs ranged from 3.0-20.6% for the high control mixture and from 3.0-27.5% for the low control mixture. Across both low and high control mixtures, very little deviation was observed from expected retention times, with a maximum % CV of 2.6%. A full analysis of signal intensity and retention time precision is described in Table 2. It is notable that the highest variability in signal intensity was observed at 50 ng/ml of ZDV, ranging from 2456-5059 in raw signal values. However, due to the high mass accuracy thresholds, there was negligible noise, facilitating the qualitative identification of an antiretroviral drug at lower analyte concentrations. Isotopically-labeled morphine was added to each specimen during the sample preparation step at a concentration of 125 ng/ml. Across 10 injections, the signal intensity and retention time % CVs were 2% and 1%, respectively (data not shown). Upon characterization of retention time and signal thresholds, the identification of all analytes, with the exceptions of the NRTI ZDV and the NNRTI EFV, was conducted using automated peak review via the ToxID 2.1.1 software module (Supplemental Table 2 and Supplemental Fig. 1).
Table 2.
Within-run precision of antiretroviral agent signal intensity and retention time.
| High ARV control mixture | Low ARV control mixture | High and Low ng/ml ARV control mixture | |||||||
|---|---|---|---|---|---|---|---|---|---|
| Analyte | Mean Signal Intensity (NL) (n=5) | SD | %CV | Mean Signal Intensity (NL) (n=5) | SD | %CV | Retention Time (min) (n=10) | SD | %CV |
| Protease Inhibitors | |||||||||
| Amprenavir | 6124463 | 183537 | 3.0 | 542972 | 26390 | 4.9 | 7.67 | 5.3E-03 | 0.07 |
| Atazanavir | 45121330 | 1625272 | 3.6 | 4192407 | 125739 | 3.0 | 8.56 | 5.7E-03 | 0.07 |
| Darunavir | 596270 | 57653 | 9.7 | 55117 | 7994 | 14.5 | 7.67 | 5.3E-03 | 0.07 |
| Indinavir | 28150923 | 1947717 | 6.9 | 2541560 | 310821 | 12.2 | 9.16 | 9.3E-02 | 1.01 |
| Lopinavir | 4612419 | 347425 | 7.5 | 358328 | 36614 | 10.2 | 8.89 | 1.3E-02 | 0.14 |
| Nelfinavir | 24949052 | 3455300 | 13.8 | 1139909 | 129655 | 11.4 | 10.40 | 8.3E-02 | 0.80 |
| Ritonavir | 13136967 | 1013771 | 7.7 | 1330593 | 113751 | 8.5 | 8.73 | 2.1E-02 | 0.24 |
| Saquinavir | 11302342 | 1382993 | 12.2 | 414473 | 77056 | 18.6 | 10.74 | 8.1E-02 | 0.76 |
| Tipranavir | 2114155 | 123453 | 5.8 | 127775 | 28046 | 21.9 | 9.66 | 1.3E-02 | 0.13 |
| Nucleotide/Nucleoside Reverse Transcriptase Inhibitors | |||||||||
| Emtricitabine | 395381 | 11898 | 3.0 | 50474 | 1767 | 3.5 | 3.38 | 1.9E-02 | 0.57 |
| Lamivudine | 240402 | 10299 | 4.3 | 3020 | 291 | 9.6 | 1.98 | 2.3E-02 | 1.18 |
| Tenofovir | 27743 | 2107 | 7.6 | 1111 | 71 | 6.4 | 2.42 | 6.4E-02 | 2.64 |
| Zidovudine | 36033 | 4599 | 12.8 | 4055 | 1117 | 27.5 | 5.53 | 5.2E-03 | 0.09 |
| Non-nucleoside Reverse Transcriptase Inhibitors | |||||||||
| Efavirenz | 7274 | 1497 | 20.6 | 12422 | 1472 | 11.9 | 8.57 | 3.1E-02 | 0.37 |
| Nevirapine | 5964711 | 355374 | 6.0 | 1467214 | 69109 | 4.7 | 5.54 | 1.0E-02 | 0.19 |
Carryover analysis was performed by preparing a mixture containing 2.5 μg/ml of the antiretroviral samples spiked in drug-free human serum and analyzing a post-injection unspiked specimen. Using the automated peak detection module, a post-injection blank did not identify any of the antiretroviral agents with the previously described signal intensity settings (Supplemental Table 2 and data not shown). Further, the potential impact of excess hemoglobin, lipids, or bilirubin on analyte ionization and detection was assessed. Evaluation of analyte peak areas were performed in solutions containing varying levels of the aforementioned interferents. None of the monitored ARVs were significantly impacted by increased hemolysis or icterus up to indeces of 200 and 30 units, respectively. However, several protease inhibitors, including ATV, IDV, LPV, NFV, RTV, SQV and TPV were impacted by increased lipemia. Modest lipemia (L-index greater than 150 units) resulted in decreased analyte peak area for LPV, NFV, RTV and SQV, while gross lipemia (L-index greater than 300 units) impacted the detection of ATV, IDV and TPV (data not shown). These data support the benefit of assessing specimen quality prior to analysis.
4.5 Concordance Analysis
The Exactive-MS method described above was used to screen for the presence of antiretroviral agents in human plasma samples from the HPTN 052 study, a Phase III randomized trial to assess treatment strategies for preventing the sexual transmission of HIV in serodiscordant couples [17,18]. Plasma specimens from individuals who were reportedly antiretroviral drug naïve and were not on study-administered treatment were previously identified using LC-MS/MS methods [18]. The purpose of that study was to detect undisclosed off-study antiretroviral drug use by study participants. To detect all of the antiretroviral agents included in that sample panel, three separate LC-MS/MS methods were required (see Method Comparison section of Experimental). A subset of the HPTN 052 specimens (n=64) was analyzed using the combined, qualitative, Exactive-MS method described in this report.
Of the 15 antiretroviral agents monitored in the Exactive-MS method, 7 PIs (APV, DRV, IDV, LPV, NFV, SQV and TPV) were not detected in any of the samples by any of the methods (data not shown); the aforementioned drugs were not commonly used in the countries at the time of the study. It should be noted that samples used for analysis reflect remnant specimens from a large international trial, which includes 13 study sites across 11 counties, and are reflective of a heterogeneous population. Acquiring a sufficient sample set for the additional PIs was not feasible for the method concordance using the HPTN 052 sample cohort. The percent agreement, which was used as a measure of concordance, ranged from 89.1% (for zidovudine) to 100% (ATV, FTC, EFV; Table 3). It should be noted that while the Exactive-MS method was compared to LC-MS/MS methods, the LC-MS/MS methods are still qualitative, and do not include isotopically-labeled standards for all of the monitored compounds. While the triple quadrupole mass analyzers were operated in SRM mode, the selection of fragment ions and overall identification criteria may be disparate from the Exactive-MS identification conditions. Consequently, we were unable to provide sensitivity and specificity metrics to the described Exactive-MS method, and thus report overall agreement with another qualitative LCMS/MS approach for ARV identification.
Table 3.
Concordance of results obtained using the Exactive-MS method and LC-MS/MS methods for analysis of plasma samples from a clinical trial.
| Analyte | LOI by LC-MS/MS (ng/ml) | LOI by Exactive-MS (ng/ml) | Positive by LC-MS/MS Only (n) | Positive by Exactive-MS Only (n) | Positive by Exactive-MS and LC-MS/MS (n) | Negative by Exactive-MS and LC-MS/MS (n) | Concordance (Percent Agreement, %) |
|---|---|---|---|---|---|---|---|
| Protease Inhibitors (PIs) | |||||||
| Ataznavir | 100 | 5 | 0 | 0 | 5 | 59 | 100 |
| Ritonavir | 100 | 5 | 0 | 1 | 2 | 61 | 98.4 |
| Nucleotide/Nucleoside Reverse Transcriptase Inhibitors (NRTIs) | |||||||
| Emtricitabine | 5 | 10 | 0 | 0 | 11 | 53 | 100 |
| Lamivudine | 20 | 5 | 2 | 0 | 26 | 36 | 96.8 |
| Tenofovir | 5 | 10 | 0 | 1 | 9 | 54 | 98.4 |
| Zidovudine | 5 | 10b | 6 | 1 | 8 | 49 | 89.1 |
| Non-Nucleotide/Nucleoside Reverse Transcriptase Inhibitors (NNRTIs) | |||||||
| Efavirenz | 100 | 150 | 0 | 0 | 13 | 51 | 100 |
| Nevirapine | 20 | 5 | 2 | 1 | 15 | 46 | 95.3 |
a. The LC-MS/MS method included an isotopically-labeled internal standard for zidovudine and monitors fragments at a limit of identification of 5 ng/ml. The full scan-HRMS does not monitor fragments < 50 ng/ml.
The LC-MS/MS method included an isotopically-labeled internal standard for zidovudine and monitors fragments at a limit of identification of 5 ng/ml. The full scan-HRMS does not monitor fragments < 50 ng/ml.
a. The LC-MS/MS method included an isotopically-labeled internal standard for zidovudine and monitors fragments at a limit of identification of 5 ng/ml. The full scan-HRMS does not monitor fragments <50 ng/ml.
Of note, for analytes in which there was not 100% agreement, this may be explained by the differing limits of identification for specific ARVs. For example, one specimen screened positive for NVP and one sample screened positive for RTV by Exactive-MS while both samples were negative for the respective drugs by LC-MS/MS, which is consistent with the lower limits of identification of the Exactive-MS method for NVP and RTV detection. Further, the agreement for ZDV identification was 89.1%, which was the lowest of the 8 analytes detected by either method. While the limit of identification of ZDV by Exactive-MS is 10 ng/ml, a fragment ion is not observed at concentrations <50 ng/ml. The LC-MS/MS method has a limit of identification of 5 ng/ml and includes a structural analog of ZDV (azidouridine), resulting in increased selectivity [17]. The increased selectivity and more sensitive limit of identification criteria for ZDV by the LC-MS/MS method likely explains the additional identification of ZDV in clinical plasma specimens.
Although several disparities between the Exactive-MS and LC-MS/MS methods could be explained by the limits of identification of the respective methods, there were two samples in which a lack of concordance could not be explained by assay limits of identification. Specifically, 2 specimens were screened as positive for 3TC and NVP by the LC-MS/MS methods, but not by Exactive-MS. This could be the result of a false positive by LC-MS/MS, or the inability of the samples to meet all acceptance criteria for compound identification. Upon further review of the specimens in question, it was noted that there was only a limited amount of sample available for testing, so a question of freeze-thaw stability and sample integrity may also explain the discrepancy, as the samples were analyzed by Exactive-MS several months after LC-MS/MS analysis. However, during this time, samples were maintained at -80°C for long-term storage.
While the Exactive-MS method offers the identification of a diverse set of compounds with high mass accuracy (±5 ppm difference from theoretical mass), and can operate in full-scan mode, the method has limitations. Technically, Exactive-MS is associated with slower scan speeds as compared to triple quadrupole mass spectrometers, making it more difficult to acquire ions in different scan modes [47]. Also, the Exactive-MS acquires all ions, and because it is not operated in SRM mode, and all ions are collected, strict adherence to identification criteria, including both precursor and fragment retention time, and mass accuracy, becomes paramount.
In clinical and research settings, self-report of adherence to antiretroviral regimens and off-study antiretroviral use may be unreliable. Other methods for adherence monitoring also have limitations [14, 15]. Direct detection of antiretroviral drugs in clinical samples or research specimens may provide a more accurate picture of antiretroviral drug use. Since routine monitoring of antiretroviral drugs via mass spectrometry is not performed to assess adherence, defined cut-off concentrations for adherence are not known. However, pharmacokinetic analyses show circulating plasma concentrations of antiretrovirals are dependent upon drug interactions as well as specific therapeutic dosing formulations and regimens. Further, defined definitions for adherence would require knowledge of time of dose administration as well as time of collection, parameters which are not typically known.
5.0 Conclusions
This manuscript describes the development, validation and application of a robust, selective Exactive-MS method for the qualitative monitoring of 15 antiretroviral agents in human plasma. The method requires minimal sample pre-treatment, and based on the high mass accuracy of the Exactive-MS, is selective and specific in the identification of a variety of PIs, NRTIs and NNRTIs. The method also shows agreement LC-MS/MS qualitative assays. Positive identification of an antiretroviral drug by the described Exactive-MS method could be reflex-tested for identified drugs using quantitative SRM-based LC-MS/MS methods, which would include the presence of an isotopically-labeled internal standard or structural analog. A qualitative method for the identification of antiretroviral drugs facilitates the monitoring of overall adherence to a therapeutic regimen, as well as potential off-study use. Quantitative determination of a target drugs occurs to assess pharmacokinetic parameters, including drug efficacy. This method could be used to monitor drug adherence in clinical and research settings, and also to detect off-study antiretroviral drug use in clinical trials. A major advantage of HRMS is that all ions are collected and monitored in a non-targeted fashion, facilitating retrospective analysis and post-hoc data querying. Post-targeted data analysis may have significant benefits in monitoring off-study antiretroviral drug use, as well as re-querying data for other substances. Thus, the Exactive-MS method offers robust and highly selective identification approaches for a diverse array of small molecules in a non-targeted way.
Supplementary Material
Highlights.
We use high-resolution mass spectrometry for antiretroviral drug identification.
We show 96.7% concordance between HRMS and reference methods.
The Exactive-MS method has limits of identification of 5-10 ng/ml for most drugs.
Acknowledgements
We thank Marta Kozak, PhD of Thermo Fisher Scientific (Thermo Fisher, Waltham, MA) for antiretroviral fragment prediction analysis using Mass Frontier 7.0. We also thank Veronica Gantert and Deborah Boblitz in the collection of data for this work. The authors also thank the HPTN 052 study team and study participants for providing plasma specimens used in this study. This research was supported by the HIV Prevention Trials Network, sponsored by the National Institute of Allergy and Infectious Diseases (NIAID), the National Institute of Mental Health (NMH), and the National Institute of Drug Abuse (NIDA), Office of AIDS Research, of the National Institutes of Health (NIH), Department of Health and Human Services (DHHS), grant UM1-AI068613. The following reagents were obtained through the NIH AIDS Reagent Program, Division of AIDS, NIAID, NIH: amprenavir, atazanavir, darunavir, efavirenz, emtricitabine, indinavir, lamivudine, lopinavir, nelfinavir, nevirapine, ritonavir, saquinavir, tenofovir, tipranavir and zidovudine.
Footnotes
Publisher's Disclaimer: This is a PDF file of an unedited manuscript that has been accepted for publication. As a service to our customers we are providing this early version of the manuscript. The manuscript will undergo copyediting, typesetting, and review of the resulting proof before it is published in its final citable form. Please note that during the production process errors may be discovered which could affect the content, and all legal disclaimers that apply to the journal pertain.
References
- 1.Global report: UNAIDS report on the global AIDS epidemic 2012. 2012 http://www.unaids.org/en/resources/publications/2012.
- 2.Food and Drug Administration (FDA) FDA-approved ARV drugs, February 2013. 2013 http://www.fda.gov/ForConsumers/byAudience/ForPatientAdvocates/HIVandAIDSActivities/ucm118915.htm.
- 3.Volberding PA, Deeks SG. Antiretroviral therapy and management of HIV infections. Lancet. 2010;376:49–62. doi: 10.1016/S0140-6736(10)60676-9. [DOI] [PubMed] [Google Scholar]
- 4.Sierra-Aragon S S, Walter H. Targets for inhibition of HIV replication: entry, enzyme action, release and maturation. Intervirology. 2012;55:84–97. doi: 10.1159/000331995. [DOI] [PubMed] [Google Scholar]
- 5.World Health Organization Antiretroviral therapy for HIV infection in adults and adolescents: Recommendations for a public health approach: 2010 revision. 20102010 http://www.who.int/hiv/pub/arv/adult2010/en/ [PubMed]
- 6.Schafer JJ, Squires KE. Integrase inhibitors: a novel class of antiretroviral agents. Ann Pharmacothera. 2010;44:145–156. doi: 10.1345/aph.1M309. [DOI] [PubMed] [Google Scholar]
- 7.Henrich TJ, Kuritzkes DR. HIV-1 entry inhibitors: recent development and clinical use. Curr Opin Virol. 2013;3:51–57. doi: 10.1016/j.coviro.2012.12.002. [DOI] [PMC free article] [PubMed] [Google Scholar]
- 8.Tang MW, Shafer RW. HIV-1 antiretroviral resistance: scientific principles and clinical applications. Drugs. 2012;72:e1–e25. doi: 10.2165/11633630-000000000-00000. [DOI] [PMC free article] [PubMed] [Google Scholar]
- 9.Buscher A, Hartman C, Kallen MA, Giordano TP. Impact of antiretroviral dosing frequency and pill burden on adherence among newly diagnosed, antiretroviral-naïve HIV patients. Int J STD AIDS. 2010;23:351–355. doi: 10.1258/ijsa.2011.011292. [DOI] [PMC free article] [PubMed] [Google Scholar]
- 10.Nachega JB, Uthman OA, Anderson J, Peltzer K, Wampold S, Cotton MF, et al. Adherence to antiretroviral therapy during and after pregnancy in low-income, middle-income and high-income countries, a systematic review and meta-analysis. AIDS. 2012;26:2039–2052. doi: 10.1097/QAD.0b013e328359590f. [DOI] [PMC free article] [PubMed] [Google Scholar]
- 11.Mnyani CN, McIntyre JA. Preventing mother-to-child transmission of HIV. British J Obstetr Gynecol. 2009;116:S71–S76. doi: 10.1111/j.1471-0528.2009.02312.x. [DOI] [PubMed] [Google Scholar]
- 12.Weber J, Tatoud R, Fidler S. Postexposure prophylaxis, preexposure prophylaxis or universal test and treat: the strategic use of antiretroviral drugs to prevent HIV acquisition and transmission. AIDS. 2010;24:S27–S39. doi: 10.1097/01.aids.0000390705.73759.2c. [DOI] [PubMed] [Google Scholar]
- 13.Cohen MS, Muessig KE, Smith MK, Powers KA, Kashuba ADM. Antiviral agents and HIV prevention: controversies, conflicts and consensus. AIDS. 2012;26:1585–1598. doi: 10.1097/QAD.0b013e3283543e83. [DOI] [PMC free article] [PubMed] [Google Scholar]
- 14.Williams AB, Amico KR, Bova C, Womack JA. A proposal for quality standards for measuring medication adherence in research. AIDS Behav. 2013;17:284–297. doi: 10.1007/s10461-012-0172-7. [DOI] [PMC free article] [PubMed] [Google Scholar]
- 15.Marcellin F, Spire B, Carrieri MP, Roux P. Assessing adherence to antiretroviral therapy in randomized HIV clinical trials: a review of currently used methods. Expert Rev Anti Infect Ther. 2013;11:239–250. doi: 10.1586/eri.13.8. [DOI] [PubMed] [Google Scholar]
- 16.Kahle E, Kashuba A, Baeten J, Delany S, Donnell D, John-Stewart G G. Unreported antiretroviral use by HIV-1 infected members of HIV-1 serodiscordant couples enrolling in an HIV-1 prevention clinical trial. International Microbicides Conference; Sydney, Australia. 15-18 April 2012; Abstract #347. [Google Scholar]
- 17.Fogel JM, Wang L, Parsons TL, Ou S-S, Piwowar-Manning E, Chen Y, et al. Undisclosed antiretroviral drug use in a multi-national clinical trial (HPTN 052), (2013) J Infect Dis. 2013;208:1624–1628. doi: 10.1093/infdis/jit390. [DOI] [PMC free article] [PubMed] [Google Scholar]
- 18.Cohen MS, Chen YQ, McCauley M, Gamble T, Hosseinipour MC, Kumarasamy N, et al. Prevention of HIV-1 infection with early antiretroviral therapy. N Engl J Med. 2011;365:493–505. doi: 10.1056/NEJMoa1105243. [DOI] [PMC free article] [PubMed] [Google Scholar]
- 19.Volosov A, Alexander C, Ting L, Soldin SJ. Simple rapid method for quantification of antiretrovirals by liquid chromatography-tandem mass spectrometry. Clin Biochem. 2002;35:99–103. doi: 10.1016/s0009-9120(02)00286-2. [DOI] [PubMed] [Google Scholar]
- 20.Gehrig AK, Mikus G, Haefeli WE, Burhenne J. Electrospray tandem mass spectroscopic characterisation of 18 antiretroviral drugs and simultaneous quantification of 12 antiretrovirals in plasma. Rapid Commun Mass Spectrom. 2007;21:2704–2716. doi: 10.1002/rcm.3138. [DOI] [PubMed] [Google Scholar]
- 21.Jung BH, Rezk NL, Bridges AS, Corbett AH, Kashuba AD. Simultaneous determination of 17 antiretroviral drugs in human plasma or quantitative analysis with liquid chromatography-tandem mass spectrometry. Biomed Chromatogr. 2007;21:1095–1104. doi: 10.1002/bmc.865. [DOI] [PubMed] [Google Scholar]
- 22.Reda AA, Biadgilign S. Determinants of Adherence to Antiretroviral Therapy among HIV-Infected Patients in Africa. AIDS Res Treat. 2012:574656. doi: 10.1155/2012/574656. [DOI] [PMC free article] [PubMed] [Google Scholar]
- 23.Acosta EP, Gerber JG, Kuritzkes DR. In: Antiretroviral Pharmacokinetics, Resistance Testing and Therapeutic Drug Monitoring. Libman H, Makadon HJ, editors. American College of Physicians (ACP) Therapy Series: HIV; 2006. [Google Scholar]
- 24.Garcia-Reyes JF, Hernando MD, Ferrer C, Molina-Diaz A, Fernandez-Alba AR. Large scale pesticide multiresidue methods in food combining liquid chromatography-time-of-flight mass spectrometry and tandem mass spectrometry. Anal Chem. 2007;79:7308–7323. doi: 10.1021/ac070855v. [DOI] [PubMed] [Google Scholar]
- 25.Mol HG, Zomer P, de Koning M. Qualitative aspects and validation of a screening method for pesticides in vegetables and fruits based on liquid chromatography coupled to full scan high resolution (Orbitrap) mass spectrometry. Anal Bioanal Chem. 2012;403:2891–2908. doi: 10.1007/s00216-012-6100-x. [DOI] [PMC free article] [PubMed] [Google Scholar]
- 26.Ojanpera I, Kolmonen M, Pelander A. Current use of high-resolution mass spectrometry in drug screening relevant to clinical and forensic toxicology and doping control. Anal Bioanal Chem. 2012;403:1203–1220. doi: 10.1007/s00216-012-5726-z. [DOI] [PubMed] [Google Scholar]
- 27.Meyer MR, Maurer HH. Current applications of high-resolution mass spectrometry in drug metabolism studies. Anal Bioanal Chem. 2012;403:1221–1231. doi: 10.1007/s00216-012-5807-z. [DOI] [PubMed] [Google Scholar]
- 28.Crews BO, Pesce AJ, West R, Nguyen H, Fitzgerald RL. Evaluation of high-resolution mass spectrometry for urine toxicology screening in a pain management setting. J Anal Toxicol. 2012;36:601–607. doi: 10.1093/jat/bks071. [DOI] [PubMed] [Google Scholar]
- 29.Makarov A. Electrostatic axially harmonic orbital trapping: a high-performance technique of mass analysis. Anal Chem. 2000;72:1156–1162. doi: 10.1021/ac991131p. [DOI] [PubMed] [Google Scholar]
- 30.Hu Q, Noll RJ, Li H, Makarov A, Hardman M, Graham Cooks R R. The Orbitrap: a new mass spectrometer. J Mass Spectrom. 2005;40:430–443. doi: 10.1002/jms.856. [DOI] [PubMed] [Google Scholar]
- 31.Henry H, Sobhi HR, Scheibner O, Bromirski M, Nimkar SB, Rochat B. Comparison between a high-resolution single-stage Orbitrap and a triple quadrupole mass spectrometer for quantitative analysis of drugs. Rapid Commun Mass Spectrom. 2012;26:499–509. doi: 10.1002/rcm.6121. [DOI] [PubMed] [Google Scholar]
- 32.Hernandez F, Sanchi JV, Ibanez M, Abad E, Portoles T, Mattioli L. Current use of high-resolution mass spectrometry in the environmental sciences. Anal Bioanal Chem. 2012;403:1251–1264. doi: 10.1007/s00216-012-5844-7. [DOI] [PubMed] [Google Scholar]
- 33.Grabenauer M, Krol WL, L Wiley J, Thomas BF. Analysis of synthetic cannabinoids using high-resolution mass spectrometry and mass defect filtering: implications for nontargeted screening of designer drugs. Anal Chem. 2012;84:5574–5581. doi: 10.1021/ac300509h. [DOI] [PMC free article] [PubMed] [Google Scholar]
- 34.Rosano TG, Wood M, Ihenetu K, Swift TA. Drug screening in medical examiner casework by High-Resolution Mass Spectrometry (UPLC-MSE-TOF) J Anal Toxicol. 2013;37:580–593. doi: 10.1093/jat/bkt071. [DOI] [PubMed] [Google Scholar]
- 35.Molato O, Lozano A, Mezcua M, Aguera A, Alba-Fernandez AR. Benefits and pitfalls of the application of screening methods for the analysis of pesticide residues in fruits and vegetables. J Chromatogr A. 2011;1218:7615–7626. doi: 10.1016/j.chroma.2011.06.110. [DOI] [PubMed] [Google Scholar]
- 36.Hogenboom AC, van Leerdam JA, de Voogt P. Accurate mass screening and identification of emerging contaminants in environmental samples by liquid chromatography-hybrid linear ion trap Orbitrap mass spectrometry. J Chromatogr A. 2009;1216:510–519. doi: 10.1016/j.chroma.2008.08.053. [DOI] [PubMed] [Google Scholar]
- 37.Bateman KP, Kellmann M, Muenster H, Papp R, Taylor L. Quantitative-qualitative data acquisition using a benchtop Orbitrap mass spectrometer. J Am Soc Mass Spectrom. 2009;20:1441–1450. doi: 10.1016/j.jasms.2009.03.002. [DOI] [PubMed] [Google Scholar]
- 38.Gangl E, Utkin I, Gerber N, Vouros P. Structural elucidation of metabolites of ritonavir and indinavir by liquid chromatography-mass spectrometry. J Chromatogr A. 2002;974:91–101. doi: 10.1016/s0021-9673(02)01243-8. [DOI] [PubMed] [Google Scholar]
- 39.Notari S, Mancone C, Tripodi M, Narciso P, Fasano M, Ascenzi P. Determination of anti-HIV drug concentration in human plasma by MALDI-TOF/TOF. J Chromatogr B Analyt Technol Biomed Life Sci. 2006;833:109–116. doi: 10.1016/j.jchromb.2006.02.010. [DOI] [PubMed] [Google Scholar]
- 40.Bedse G, Kumar V, Singh S. Study of forced decomposition behavior of lamivudine using LC, LC-MS/TOF and MS(n) J Pharm Biomed Anal. 2009;49:55–63. doi: 10.1016/j.jpba.2008.10.002. [DOI] [PubMed] [Google Scholar]
- 41.Nakatani-Freshwater T, Babayeva M, Dontabhaktuni A, Taft DR. Effects of trimethoprim on the clearance of apricitabine, a deoxycytidine analog reverse transcriptase inhibitor, and lamivudine in the isolated perfused rat kidney. J Pharmacol Exp Ther. 2006;319:941–947. doi: 10.1124/jpet.106.108522. [DOI] [PubMed] [Google Scholar]
- 42.Bousquet L, Pruvost A, Guyot AC, Farinotti R, Mabondzo A. Combination of tenofovir and emtricitabine plus efavirenz: in vitro modulation of ABC transporter and intracellular drug accumulation. Antimicrob Agents Chemother. 2009;53:896–902. doi: 10.1128/AAC.00733-08. [DOI] [PMC free article] [PubMed] [Google Scholar]
- 43.Nirogi R, Bhyrapuneni G, Kandikere V, Mudigonda K, Komarneni P, Aleti R, et al. Simultaneous quantification of a non-nucleoside reverse transcriptase inhibitor efavirenz, a nucleoside reverse transcriptase inhibitor emtricitabine and a nucleotide reverse transcriptase inhibitor tenofovir in plasma by liquid chromatography positive ion spray tandem mass spectrometry. Biomed Chromatogr. 2009;23:371–381. doi: 10.1002/bmc.1125. [DOI] [PubMed] [Google Scholar]
- 44.Grant M, Samuel R, Bettiker RL, Suh B. Antiretroviral therapy 2010 update: current practices and controversies. Arch Pharm Res. 2011;34:1045–1053. doi: 10.1007/s12272-011-0701-3. [DOI] [PubMed] [Google Scholar]
- 45.Barditch-Corvo P, Deeks SG, Collier A, Safrin S, Coakley DF, Miller M, et al. Phase I/II trial of the pharmacokinetics, safety and antiretroviral activity of tenofovir disoproxil fumarate in human immunodeficiency virus-infected adults. Antimicrob Agents Chemother. 2001;45:2733–2739. doi: 10.1128/AAC.45.10.2733-2739.2001. [DOI] [PMC free article] [PubMed] [Google Scholar]
- 46.Veldkamp AI, Harris M, Montaner JS, Moyle G, Gazzard B, Youle M, et al. The steady-state pharmacokinetics of efavirenz and nevirapine when used in combination in human immunodeficiency virus type 1-infected persons. J Infec Dis. 2001;184:37–42. doi: 10.1086/320998. [DOI] [PubMed] [Google Scholar]
- 47.Thevis M, Volmer DA. Recent instrumental progress in mass spectrometry: advancing resolution, accuracy and speed of drug detection. Drug Test Anal. 2012;4:242–245. doi: 10.1002/dta.344. [DOI] [PubMed] [Google Scholar]
Associated Data
This section collects any data citations, data availability statements, or supplementary materials included in this article.


