

Abstract
Down syndrome confers a 20-fold increased risk of B cell acute lymphoblastic leukemia (B-ALL)1 and polysomy 21 is the most frequent somatic aneuploidy amongst all B-ALLs2. Yet, the mechanistic links between chr.21 triplication and B-ALL remain undefined. Here we show that germline triplication of only 31 genes orthologous to human chr.21q22 confers murine progenitor B cell self-renewal in vitro, maturation defects in vivo, and B-ALL with either BCR-ABL or CRLF2 with activated JAK2. Chr.21q22 triplication suppresses H3K27me3 in progenitor B cells and B-ALLs, and “bivalent” genes with both H3K27me3 and H3K4me3 at their promoters in wild-type progenitor B cells are preferentially overexpressed in triplicated cells. Strikingly, human B-ALLs with polysomy 21 are distinguished by their overexpression of genes marked with H3K27me3 in multiple cell types. Finally, overexpression of HMGN1, a nucleosome remodeling protein encoded on chr.21q223–5, suppresses H3K27me3 and promotes both B cell proliferation in vitro and B-ALL in vivo.
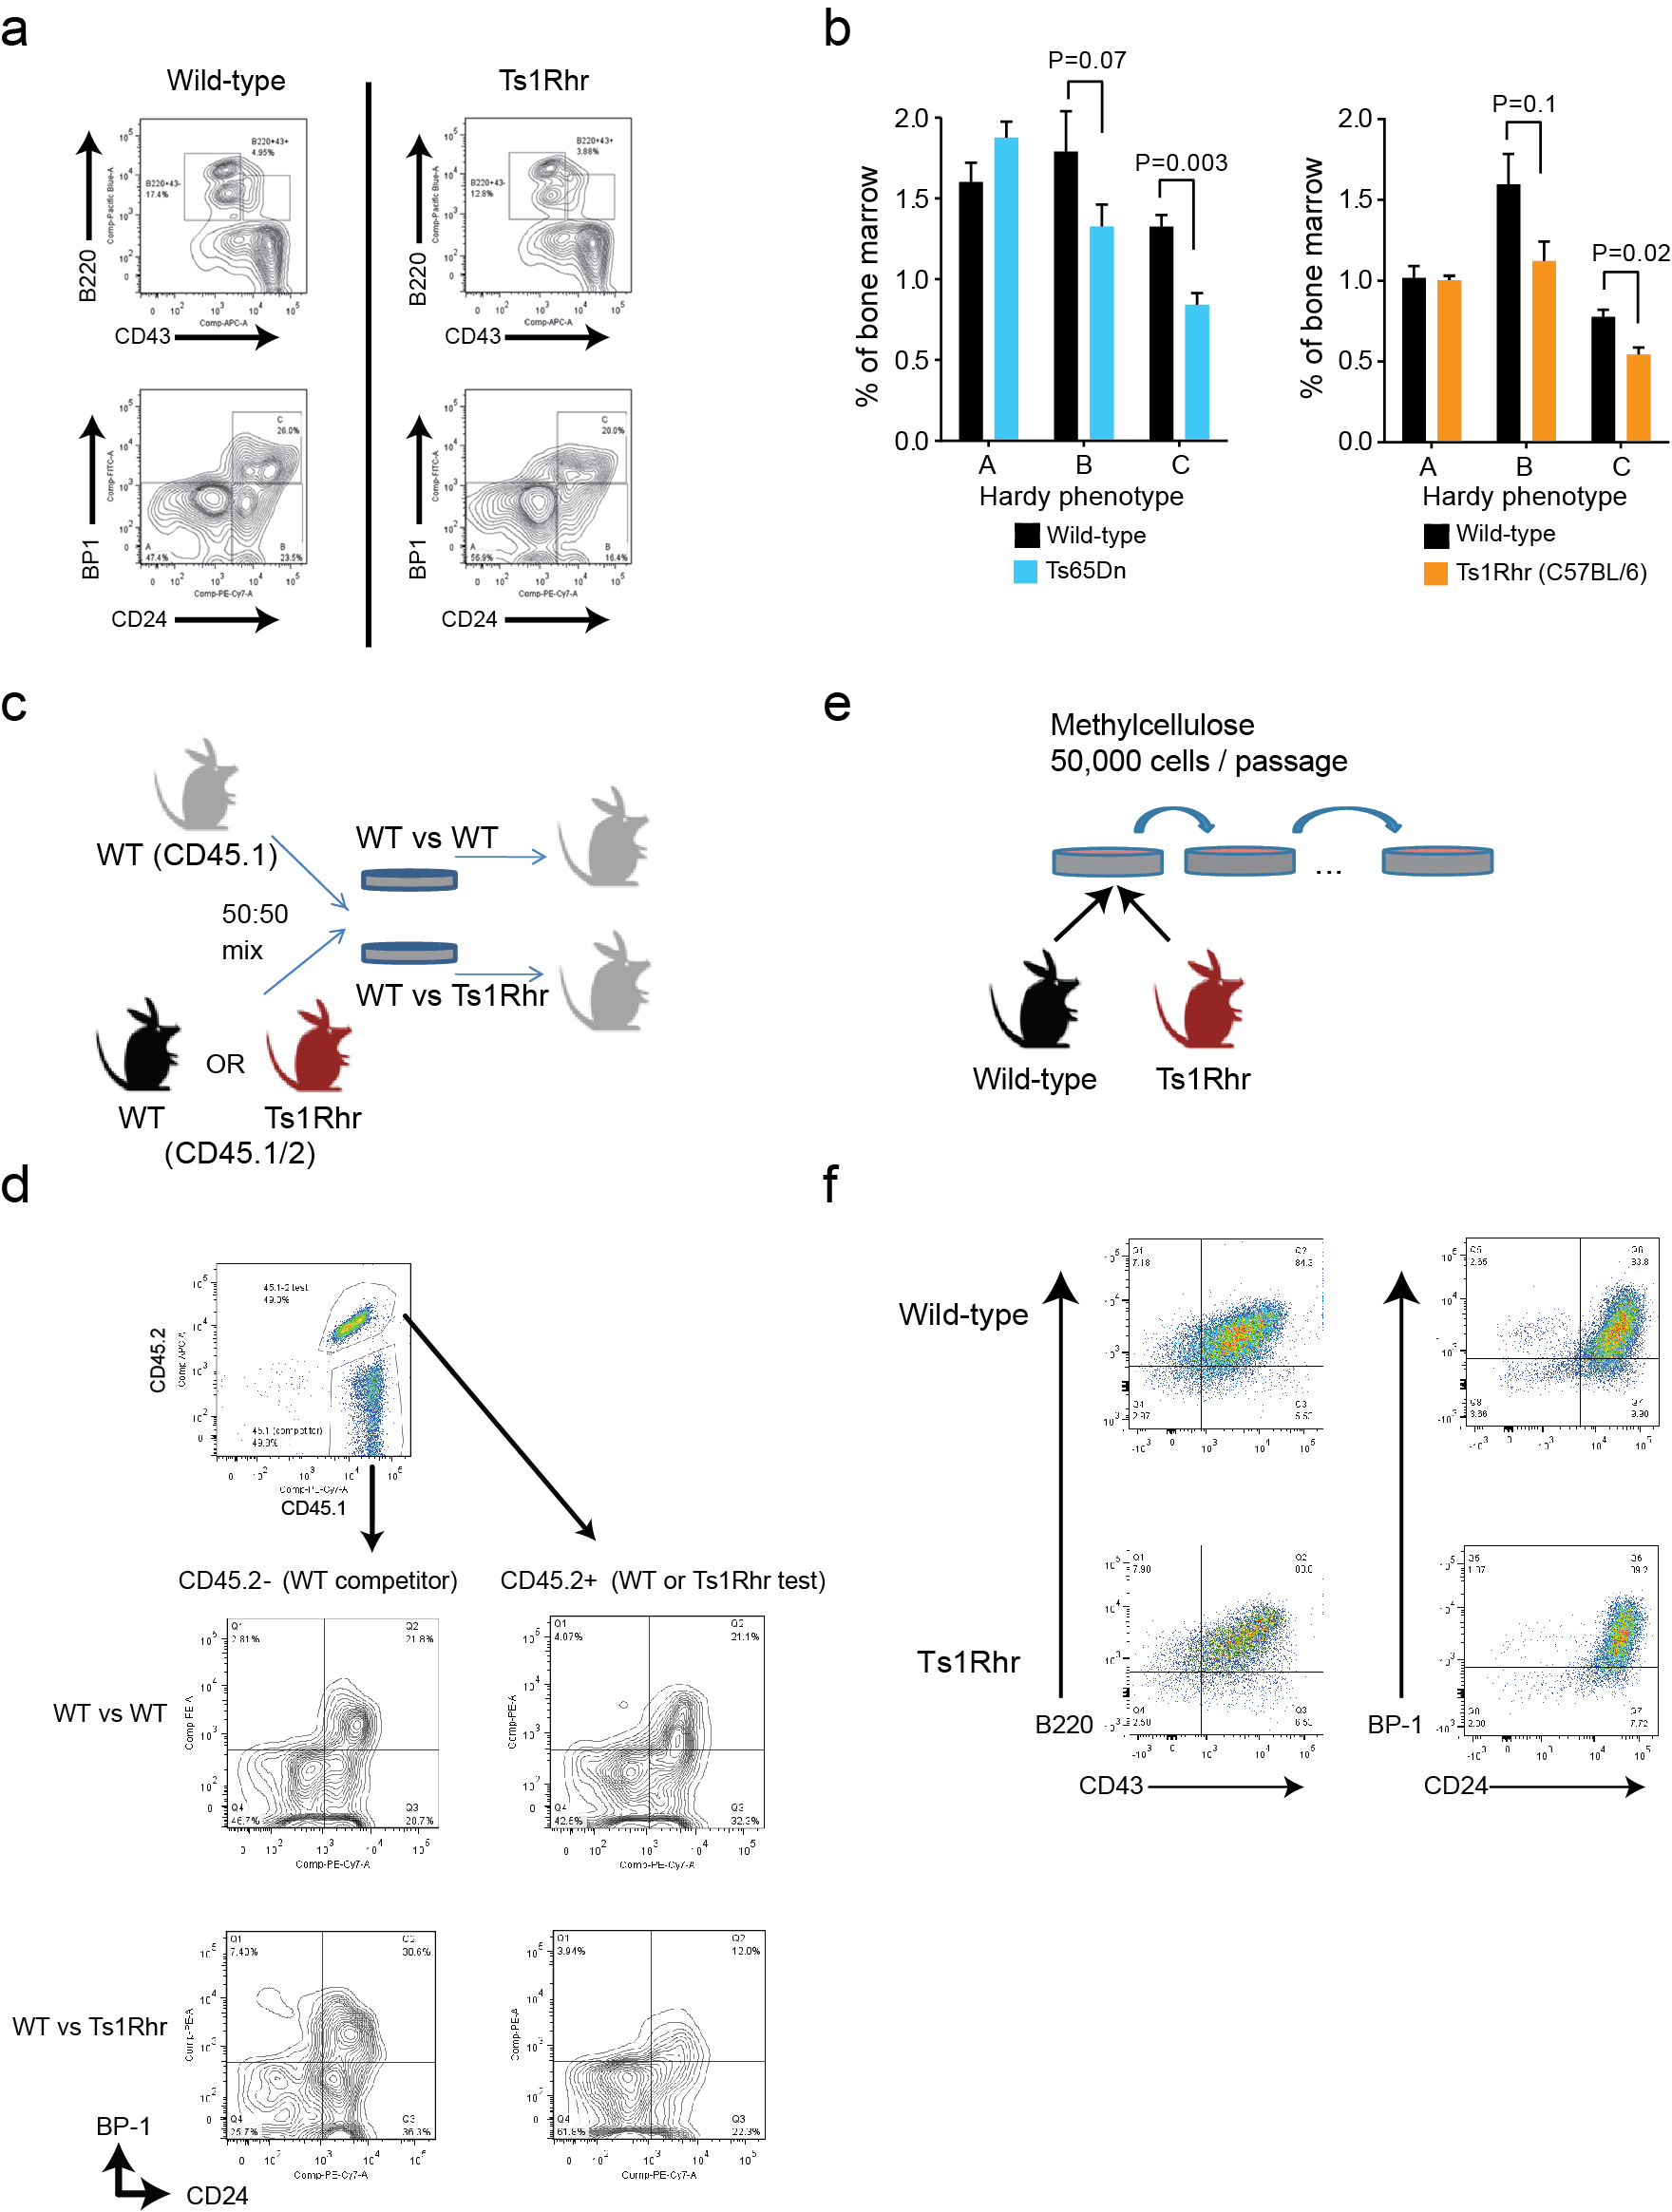
To directly interrogate the effects of polysomy 21, we assayed B cell development in Ts1Rhr mice (Fig. 1a), which harbor a triplication of 31 genes and one non-coding RNA on mouse chr.16 orthologous to a segment of human chr.21q226. The triplicated genes also overlap with a region of recurrent intrachromosomal amplification of chr.21q22 (iAMP21) in human B-ALL 7. Bone marrow from 6-week-old Ts1Rhr mice had fewer total progenitor (B220+CD43+) B and pro-B (Hardy B and C)8 cells than wild-type littermates, while the pre-pro-B (Hardy A) fraction was unaffected (Fig. 1b, Supplementary Fig. 1a). C57BL/6 Ts1Rhr, FVBxC57BL/6 F1 Ts1Rhr and Ts65Dn mice9, which harbor a larger triplication (Fig. 1a), all had similar reductions in pro-B cells (Supplementary Fig. 1b). This differentiation defect essentially phenocopies human fetal livers with trisomy 21, which have reduced pre-pro-B (CD34+CD19+CD10-) and pro-B cells (CD34+CD19+CD10+)10.
Figure 1. Segmental trisomy orthologous to human chr.21q22 promotes progenitor B cell transformation.

(a) Regions orthologous to human chromosome 21 that are triplicated in Ts1Rhr and Ts65Dn mice or amplified in iAMP21 B-ALL. (b) Progenitor B cells (B220+CD43+) and Hardy subfractions as percentages of bone marrow (BM) cells (n=5–7/group in 2 independent experiments). (c) Subfractions from mixed populations in recipient BM 16 weeks after competitive transplantation (n=5/group). (d) B cell colonies across 6 passages (n=3 biological replicates/genotype representative of 3 independent experiments, mean values shown, *P<0.05, **P<0.01), and bright field microscopy of 3 Ts1Rhr and 3 WT passage 2 cultures (scale bar = 4 mm). (e) Myeloid colonies across 4 passages (n=3 mice per genotype; NS, not significant). (f) Leukemia-free survival of recipient mice after transplantation of Eµ-CRLF2 (C2)/Eµ-JAK2 R683G (J2)/Pax5+/− (P5), with or without Ts1Rhr (Ts1) BM transduced with vector or dominant negative Ikaros (Ik6) (n=8–10 mice/group). (g) Leukemia-free survival of recipient mice after transplantation of BM transduced with BCR-ABL (n=10 mice/group).
We performed competitive transplantation using equal mixtures of congenic CD45.1 wild-type bone marrow and CD45.1/CD45.2 bone marrow from either Ts1Rhr or wild-type mice (Supplementary Fig. 1c). After 16 weeks, recipients of wild-type CD45.1 and CD45.1/45.2 bone marrow had equal representations of both populations in Hardy A, B and C fractions as well as whole bone marrow (Fig. 1c, Supplementary Fig. 1d). In contrast, mice that received wild-type CD45.1 mixed with Ts1Rhr CD45.1/45.2 recapitulated the Ts1Rhr defect, with significant reductions in CD45.1/45.2 Hardy B and C fractions (Fig.1c, Supplementary Fig. 1d). Thus, the differentiation effect is independent of non-hematopoietic cells.
To address whether chr.21q22 triplication directly confers transformed phenotypes in vitro, we generated progenitor B cell colonies from unselected Ts1Rhr and wild-type bone marrow in three-dimensional cultures with IL7 (Supplementary Figs. 1e–f). Wild-type bone marrow forms colonies (termed ‘passage 1’) that replate to form new colonies for 1–2 additional passages. In contrast, Ts1Rhr bone marrow generated more colonies in early passages and serially replated indefinitely (Fig. 1d), which indicates self-renewal capacity. There were no differences between Ts1Rhr and wild-type bone marrow in the number or repassaging potential of myeloid colonies (Fig. 1e).
Sixty percent of Down syndrome-associated B-ALLs harbor CRLF2 rearrangements that commonly co-occur with activating JAK2 mutations11–13. To model this, we generated Eµ-CRLF2 (hereafter ‘C2’) and Eµ-JAK2 R683G (‘J2’) transgenic mice, which restricts transgene expression to B cells. C2/J2 and C2/J2/Pax5+/− mice did not develop B-ALL by 18 months of age (data not shown). Transduction of C2/J2/Pax5+/− bone marrow with dominant-negative IKZF1 (Ik6)14 and transplantation into wild-type recipients resulted in CRLF2-positive B-ALL in all mice by 120 days (Supplementary Fig. 2a–b). Control mice lacking C2, J2 or Pax5 heterozygosity did not develop B-ALL with Ik6 (Supplementary Fig. 2b), establishing this transgenic combination as the first model of CRLF2/JAK2-driven B-ALL. Mice transplanted with Ts1Rhr/C2/J2/Pax5+/− bone marrow transduced with a lower titer of Ik6-encoding virus developed B-ALL with greater penetrance and reduced latency compared to C2/J2/Pax5+/− alone (Fig. 1f). The same genotypes (C2/J2/Pax5+/−/Ik6 with or without polysomy 21) occur in high-risk cases of human B-ALL15, supporting the validity of the model.
Although BCR-ABL-rearranged ALL is uncommon in children with Down syndrome, polysomy 21 is the most common somatic aneuploidy in these leukemias16. Ts1Rhr and wild-type bone marrow had similar transduction efficiencies with p210 BCR-ABL17 (Supplementary Fig. 2c) but mice (C57BL/6 and FVBxC57BL/6 F1 backgrounds) that received transduced Ts1Rhr bone marrow succumbed to B-ALL with shorter latency and increased penetrance (Fig. 1g, Supplementary Fig. 2d–f). Transplantation of BCR-ABL-transduced sorted Hardy B cells from Ts1Rhr or wild-type mice recapitulated the same effect (Supplementary Fig. 2g), indicating that chr.21q22 triplication confers leukemogenic effects that are progenitor B-cell autonomous.
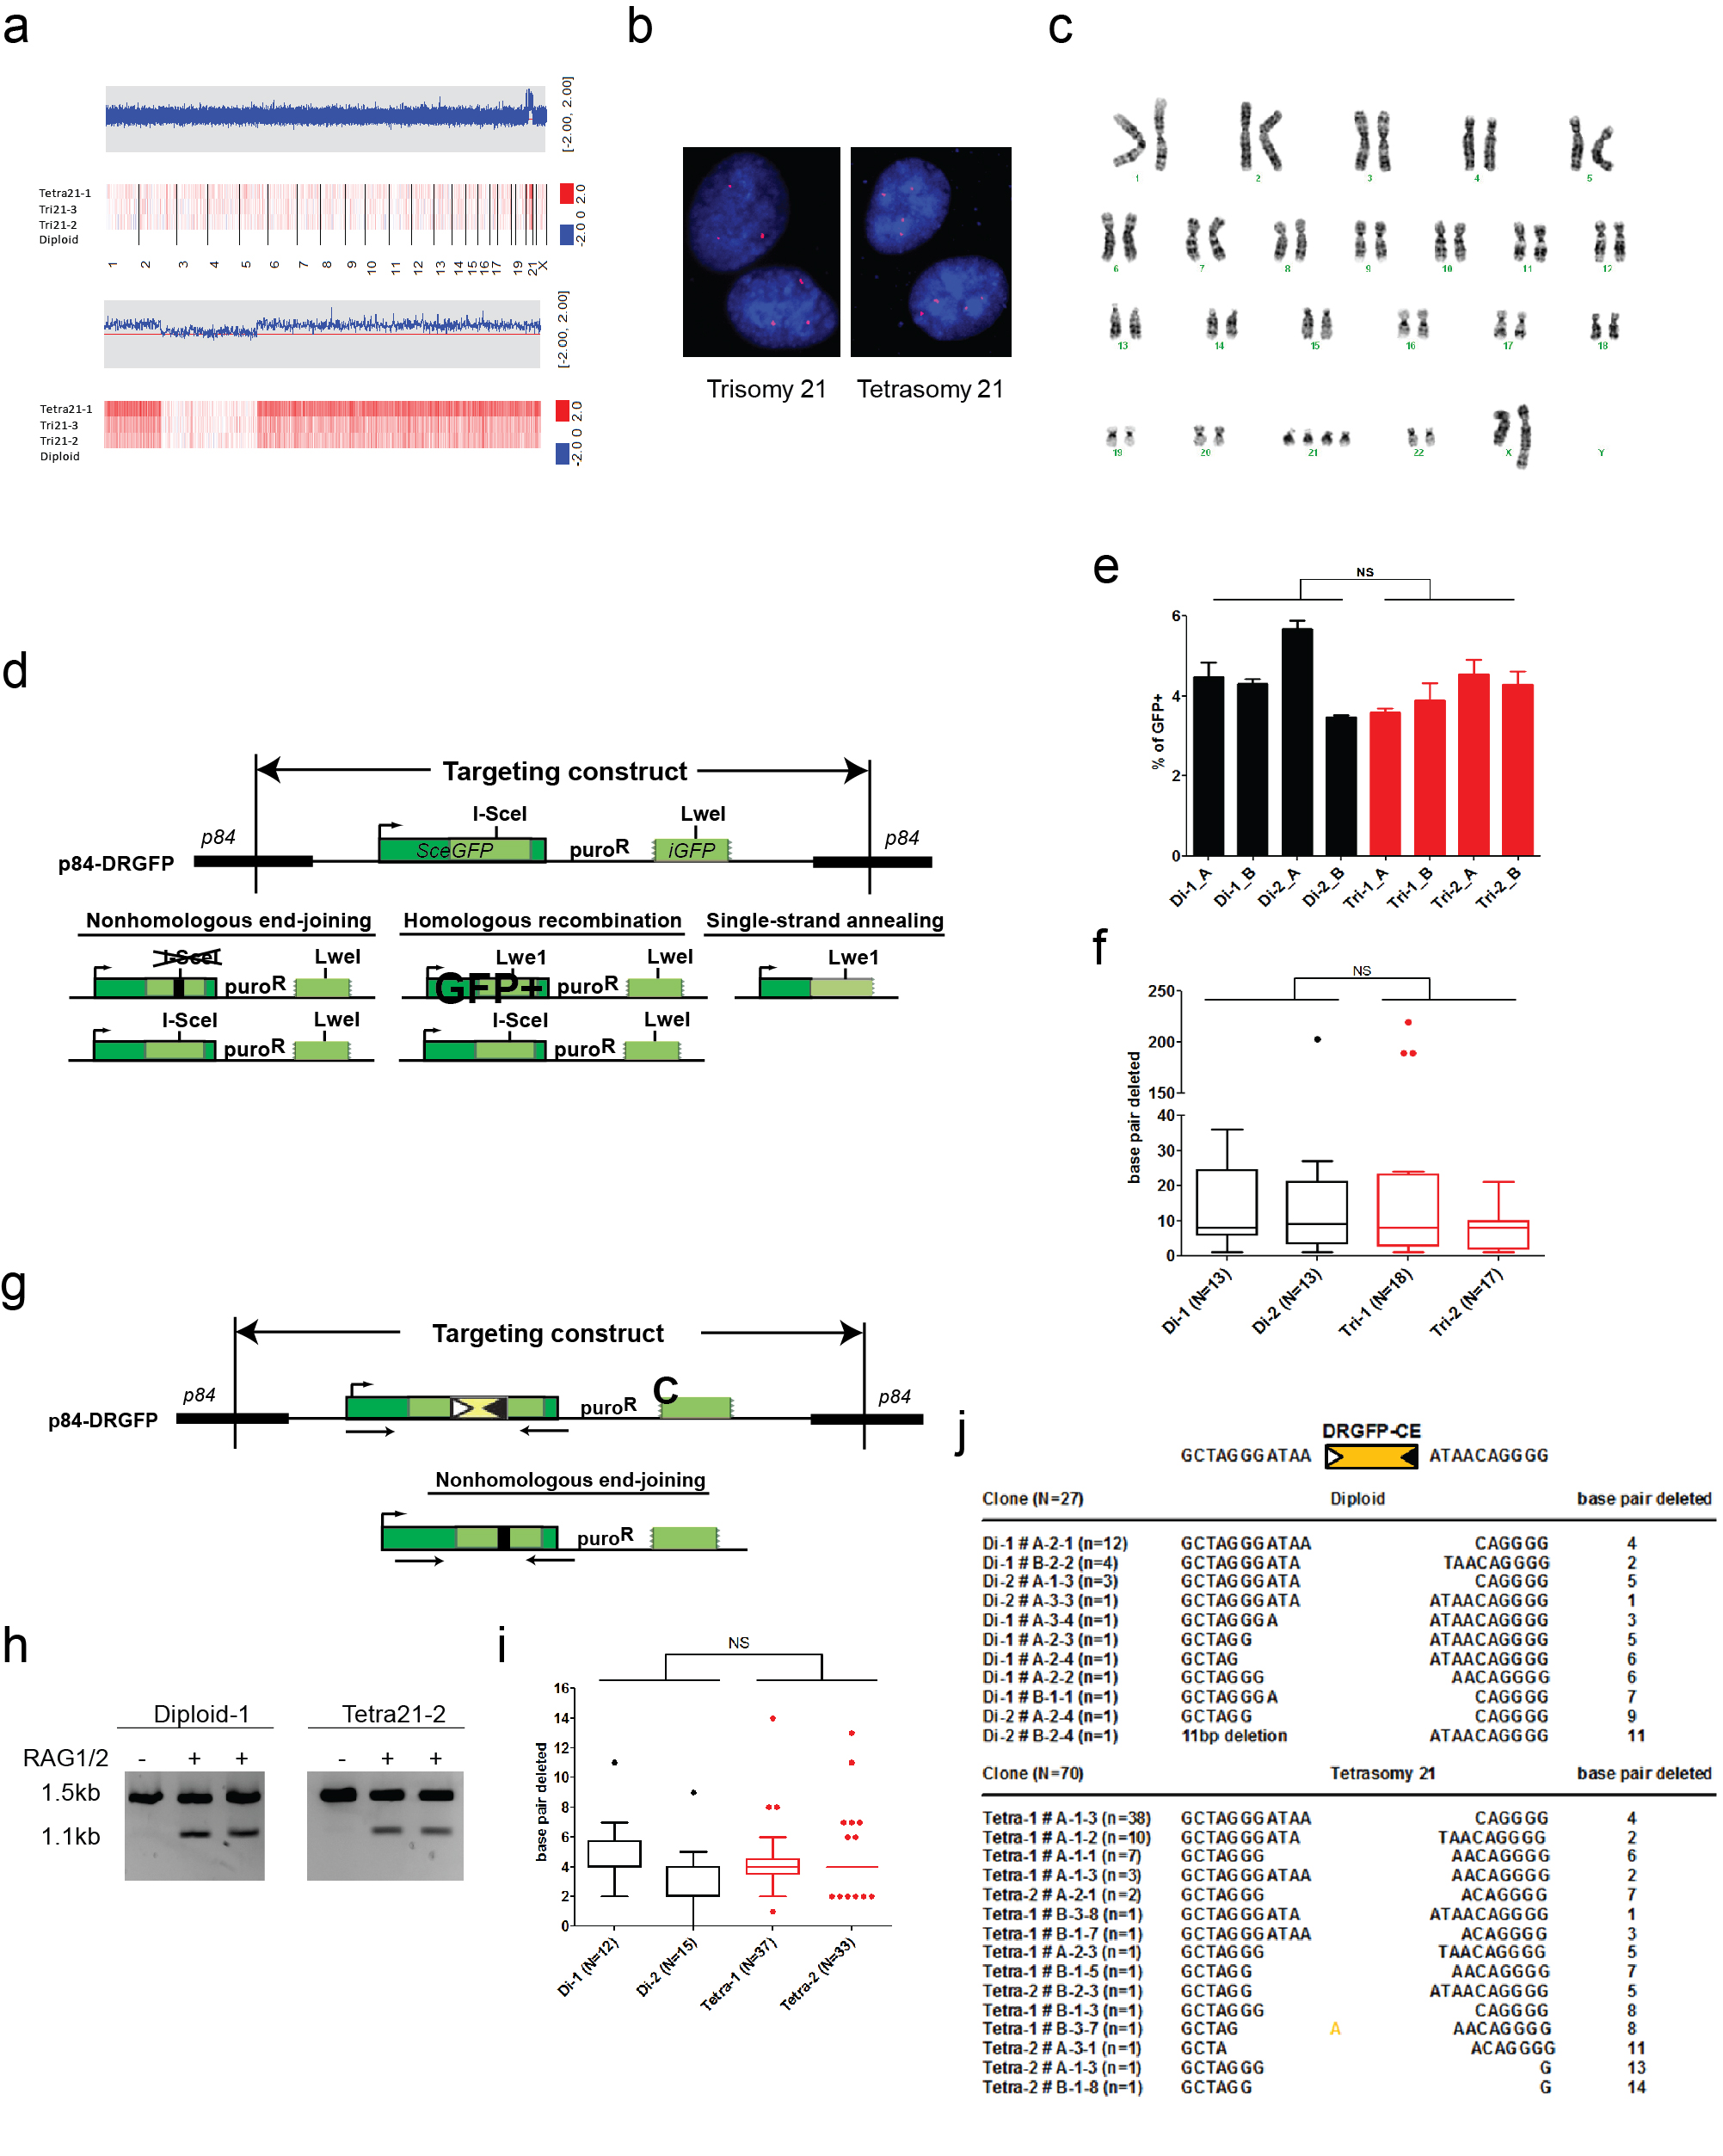
Previous reports suggested that polysomy 21 contributes to leukemogenesis by promoting aberrant DNA double-strand break repair (DSBR)18,19. To address this, we generated otherwise isogenic retinal pigment epithelial (RPE) cells with 3 or 4 copies of human chr.21 (Supplementary Fig. 3a–c). Using targeted DSBR reporters20,21, polysomy 21 had no effect on either homology-directed repair frequency or junction characteristics formed by nonhomologous end-joining, whether DSBs were induced by the I-SceI meganuclease or by the V(D)J recombinase (Supplementary Fig. 3d–j). Although a subtle defect or one specific to B cells remains possible, these results indicate in an isogenic system that polysomy 21 does not drastically affect DSBR phenotype.
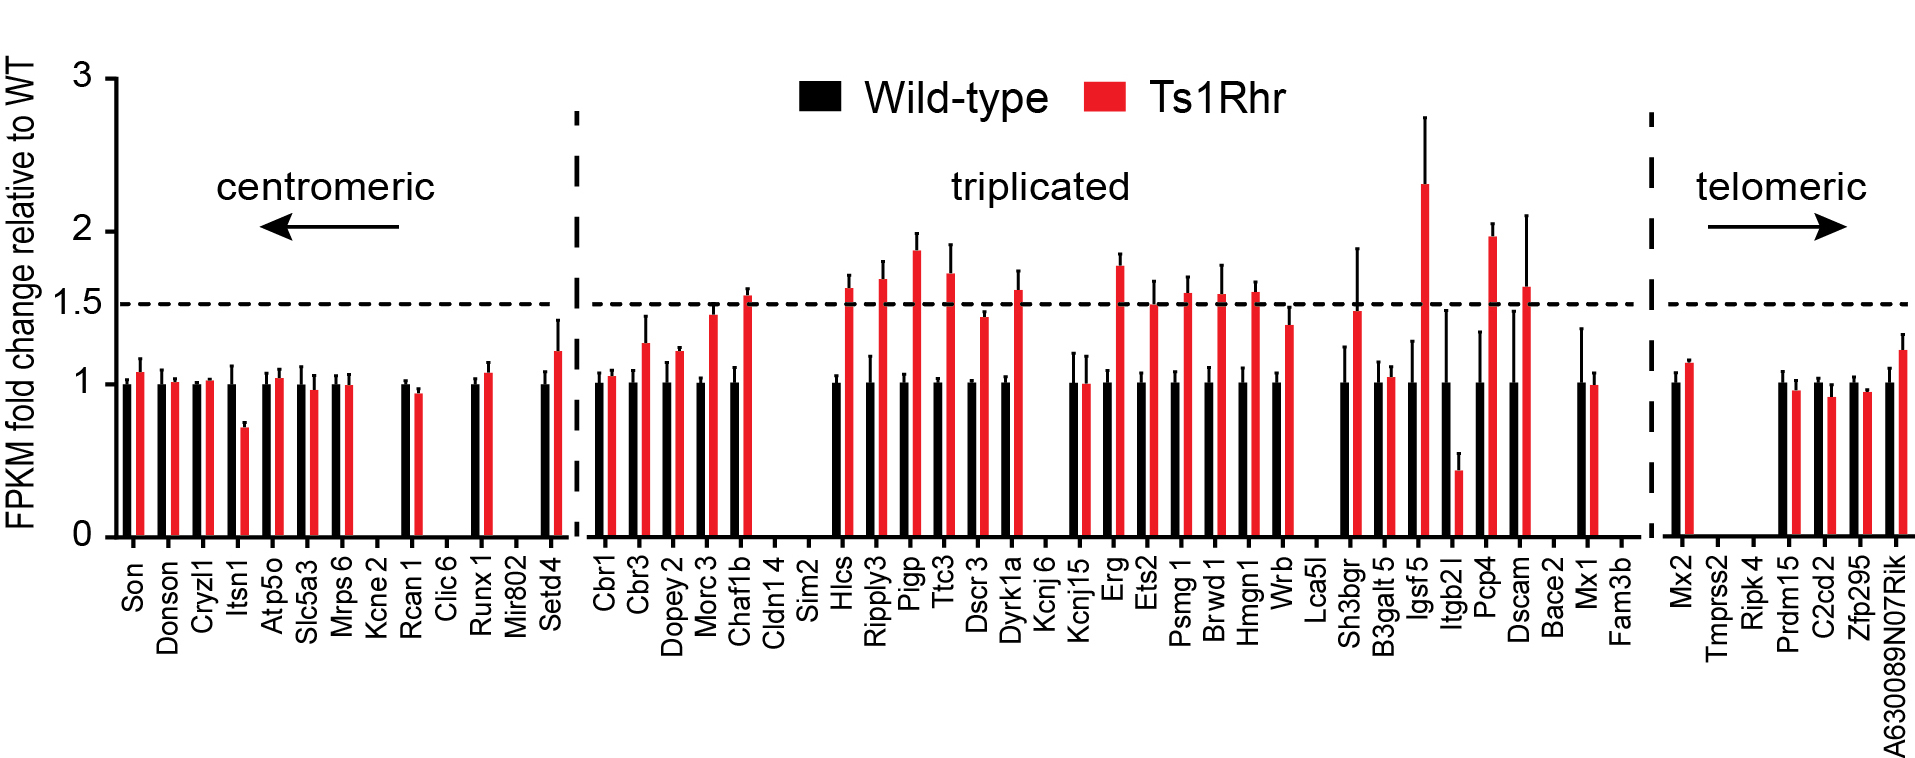
We next performed whole transcriptome sequencing (RNA-seq) of passage 1 B cells. As expected, triplicated loci in Ts1Rhr cells were expressed at approximately 1.5-fold higher levels compared to wild-type cells (Supplementary Fig. 4). We defined a transcriptional “Ts1Rhr gene set” of the 150 most differentially expressed genes compared to wild-type (Supplementary Table 1A–B). As expected, this signature was highly enriched by gene set enrichment analysis (GSEA)22 for human chr.21q22 genes but not other human chromosomal segments (Supplementary Table 1C)22. The Ts1Rhr B cell signature was enriched among human Down syndrome-ALLs by GSEA (Fig. 2a–b; FDR=0.019) in a dataset of pediatric B-ALLs (AIEOP)19. By hierarchical clustering, we defined a “core Ts1Rhr set” of 50 genes (Supplementary Table 1A, Fig. 2a) that contained none of the triplicated genes in Ts1Rhr cells but was highly enriched among Down syndrome-ALLs in both the AIEOP dataset (Fig. 2c; FDR=0.001) and an independent validation dataset (ICH) (Fig. 2c; FDR=0.001).
Figure 2. Polysomy 21 B-ALL is associated with the overexpression of PRC2 targets.

(a) Heat map of human genes orthologous to the 150 most upregulated genes from Ts1Rhr B cells in primary human pediatric B-ALLs (“DS-ALL” represents Down syndrome-associated ALL). Unsupervised hierarchical clustering by gene revealed the “core Ts1Rhr” gene set (boxed). (b) GSEA plots for the full and core Ts1Rhr gene sets in the AIEOP data set. ES, enrichment score. (c) GSEA plot of the core Ts1Rhr gene set in an independent ICH validation cohort. (d) Network enrichment map of MSigDB gene sets enriched (FDR<0.05) in the Ts1Rhr expression signature. (e) Unsupervised hierarchical clustering of H3K27me3-marked genes from the MIKKELSEN_MEF_H3K27me3 gene set in the AIEOP pediatric B-ALL cohort (karyotype shown). (f) GSEA plots of the top 100 genes from three PRC2/H3K27me3 gene sets as defined in the AIEOP patient cohort in the ICH validation cohort. (g) Quantitative histone MS for H3K27-K36 peptides (*P<0.05, n=3 samples per group per genotype).
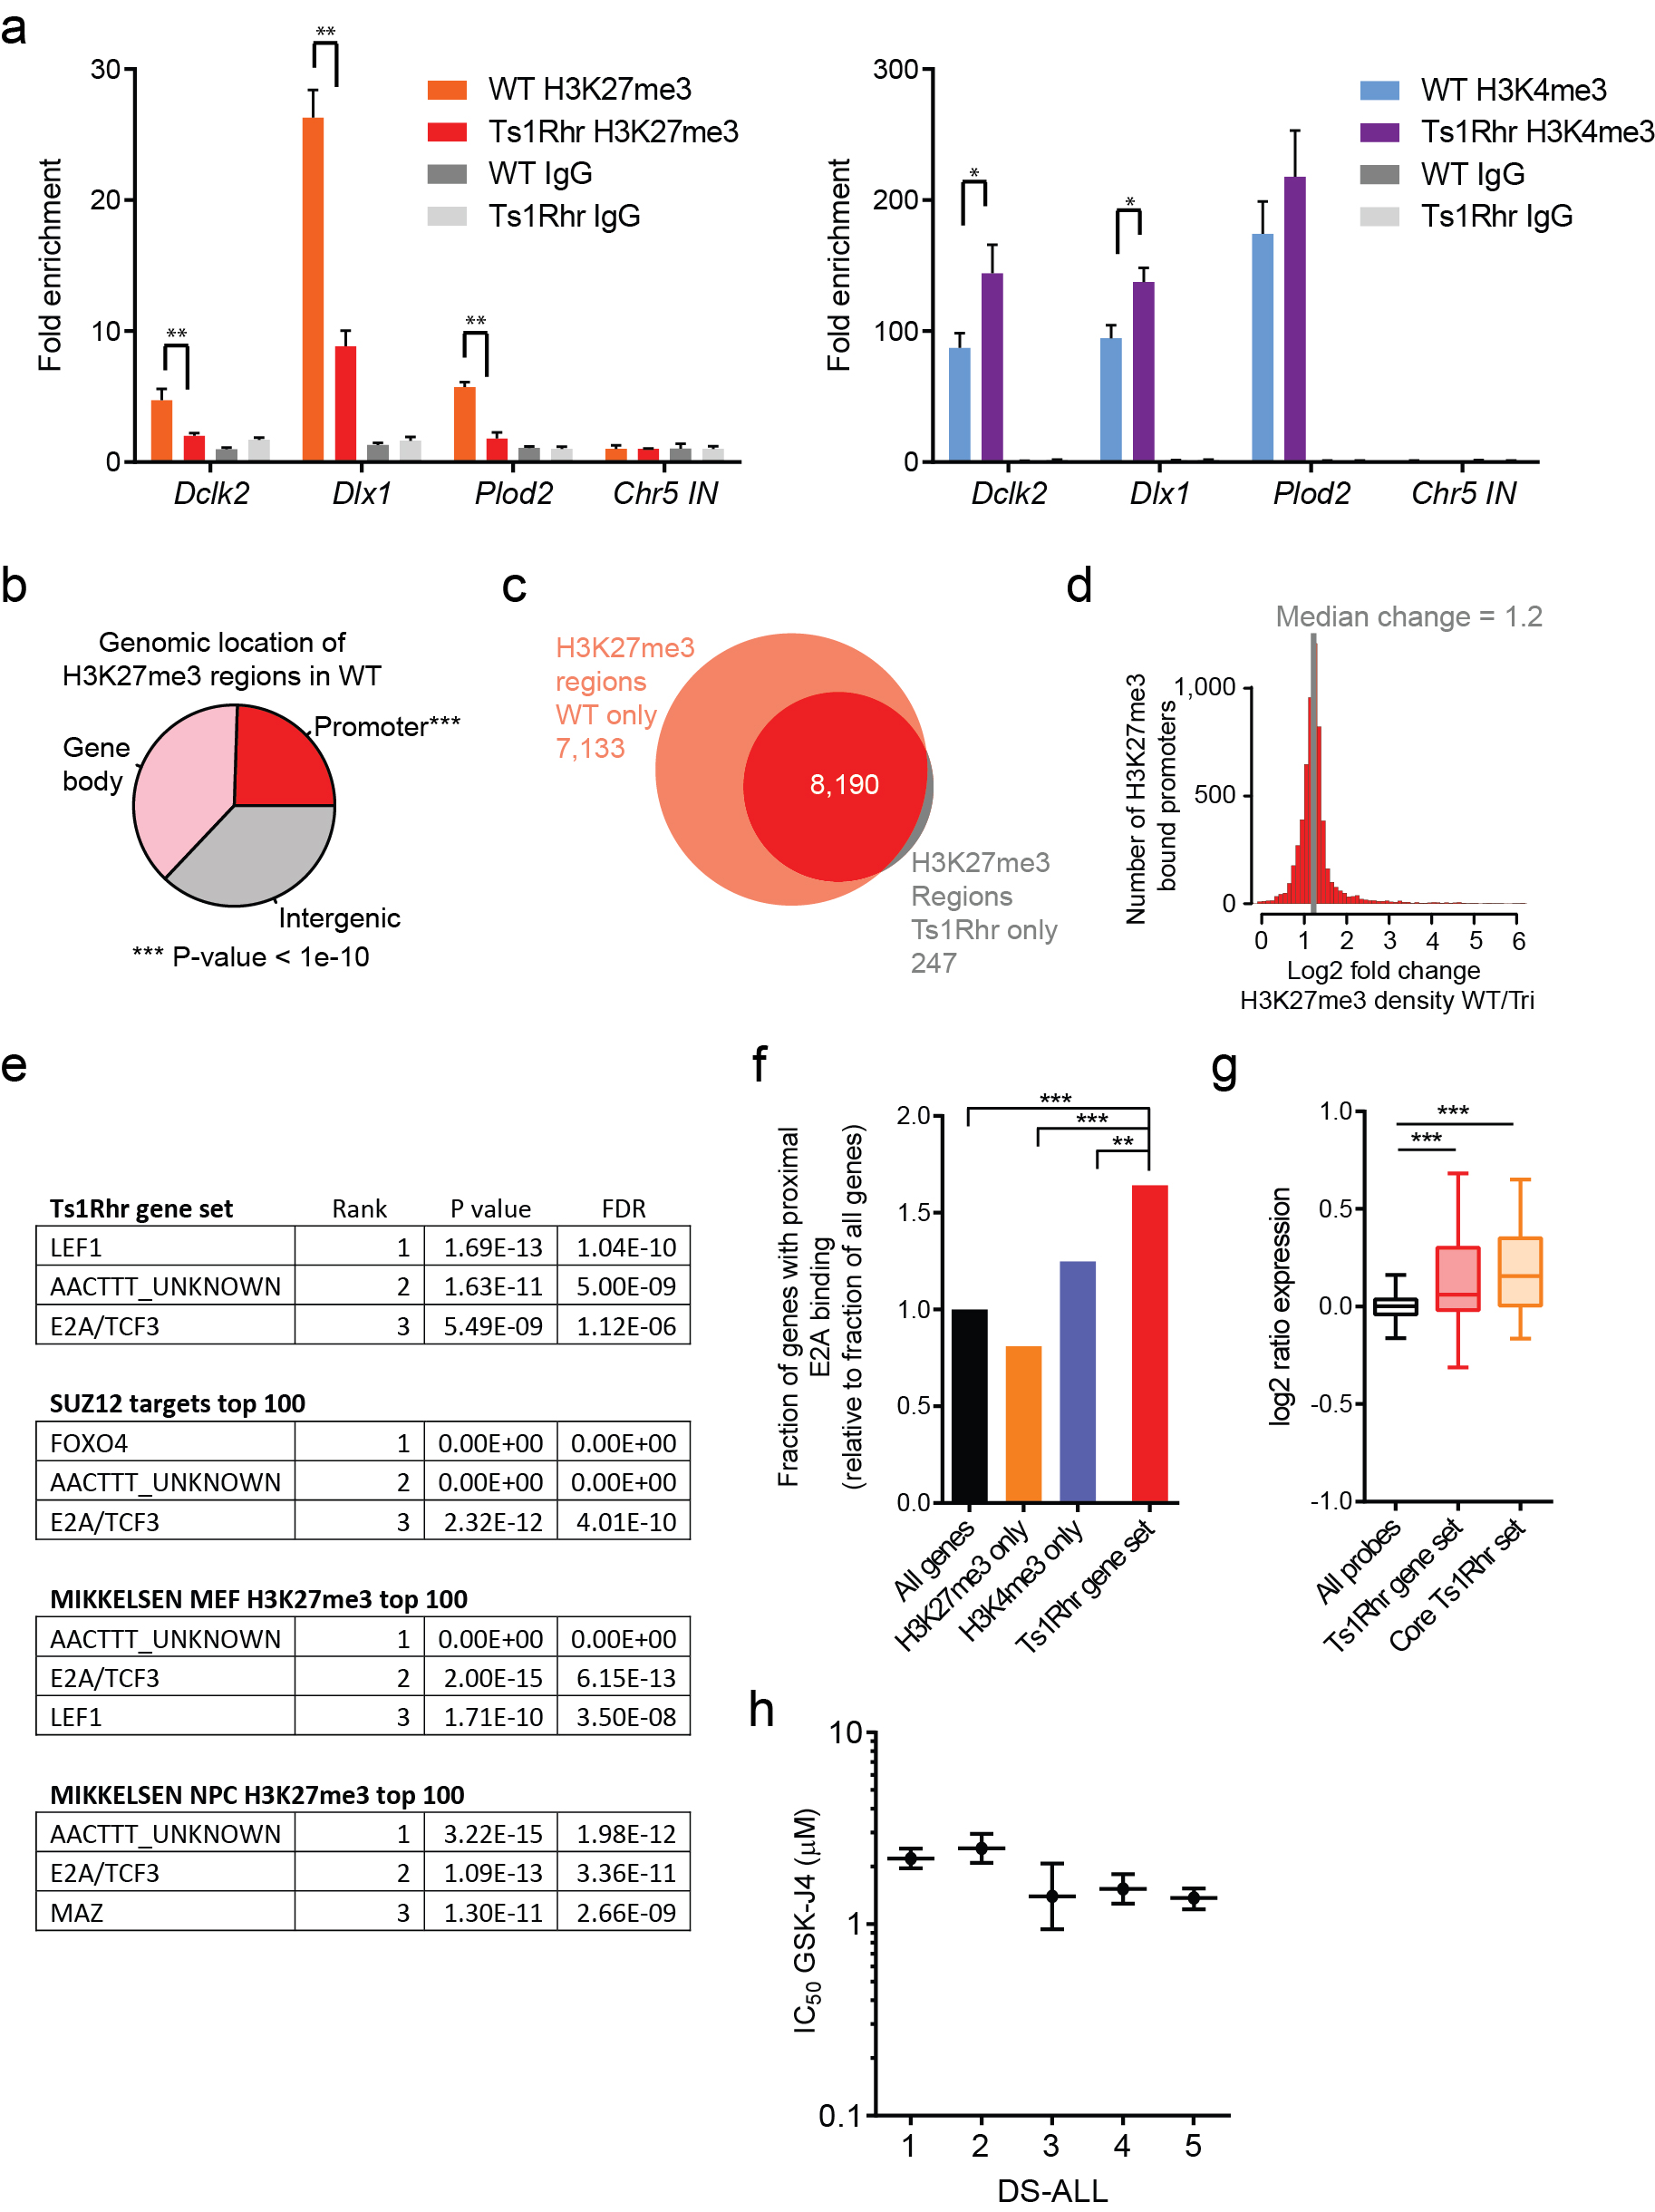
To identify pathways perturbed by chr.21q22 triplication, we queried the Ts1Rhr gene set against >3000 functionally defined gene sets in the MSigDB “c2” chemical and genetic perturbations and “c6” oncogenic signatures repositories.22 Arranging the significant gene sets in a network enrichment map23 defined 4 clusters (Fig. 2d). The most highly enriched cluster consisted of polycomb repressor complex 2 (PRC2) targets and sites of tri-methylated histone H3K27 (H3K27me3), the repressive mark added by PRC2, that were defined across multiple lineages (Supplementary Table 1D–E). The additional clusters consisted of gene sets that distinguish either stem cells from lineage-matched differentiated cells, cancer cells from nonmalignant cells, or less differentiated from more differentiated lymphoid cells (Supplementary Table 1D).
We next asked whether differential expression of PRC2/H3K27me3-classified genes would distinguish Down syndrome-ALLs from other B-ALLs. A previous effort using genome-wide expression in the AIEOP cohort failed to define a transcriptional signature specific to Down syndrome-ALL19. Strikingly, expression of H3K27me3 targets defined in murine embryonic fibroblasts24 distinguished Down syndrome-ALLs from non-Down syndrome-ALLs (Fig. 2e). To validate these findings, we determined the 100 most differentially expressed genes between Down syndrome-ALLs and non-Down syndrome-ALLs in the AIEOP cohort across three different PRC2/H3K27me3 signatures (Supplementary Fig. S5a, Supplementary Table 1F)24,25. All three signatures were significantly enriched (FDR≤0.001) among Down syndrome-ALLs in the ICH validation cohort (Fig. 2f). In a third cohort of non-Down syndrome-ALLs (AIEOP-2), leukemias with either polysomy 21 or iAMP(21) clustered based on expression of PRC2 targets (Supplementary Fig. 5b, P=0.001 by Fisher’s exact test), and the Ts1Rhr and H3K27me3 gene sets were enriched among cases with polysomy 21 or iAMP(21) by GSEA (Supplementary Fig. 5c).
Genes from PRC2/H3K27me3 gene sets that distinguish Down syndrome-ALLs are predominantly overexpressed in Down syndrome-ALL (Fig. 2e, Supplementary Fig. 5a), suggesting that Down syndrome-ALL is associated with PRC2 target de-repression through reduced H3K27me3. Histone H3 mass spectrometry confirmed a global reduction in H3K27me3 peptides in passage 1 Ts1Rhr B cells compared to wild-type cells (Fig. 2g). BCR-ABL B-ALLs from Ts1Rhr bone marrow also had reduced H3K27me3 by both mass spectrometry and immunoblotting (Supplementary Fig. 5d–e). Thus, triplication of only 31 genes orthologous to chr.21q22 directly suppresses H3K27me3.
ChIP-seq of passage 1 Ts1Rhr B cells demonstrated a genome-wide reduction of H3K27me3 at regions enriched for this mark in wild-type cells (Fig. 3a–b) that was confirmed at multiple loci by ChIP-qPCR (Supplementary Fig. 6a). Within Ts1Rhr B cells, H3K27me3 was found almost exclusively at regions enriched for H3K27me3 in wild-type cells, suggesting little or no redistribution but rather a global reduction in H3K27me3 density (Supplementary Fig. 6b–d). As expected, reciprocal changes in activating (H3K4me3, H3K27ac) and repressive (H3K27me3) marks were observed at promoters of genes differentially expressed in Ts1Rhr B cells (Fig. 3c). However, genes “bivalently marked” with both H3K27me3 and H3K4me3 in wild-type cells were highly enriched among those overexpressed in Ts1Rhr B cells (Fig. 3d; P<0.0001).
Figure 3. Ts1Rhr B cells have reduced H3K27me3 that results in overexpression of bivalently marked genes.

(a) Gene tracks showing occupancy of histone marks at the Plod2 promoter (one of the 50 core Ts1Rhr genes) in reads per million per base pair (rpm/bp). (b) Levels of H3K27me3 in Ts1Rhr and wild-type B cells at regions enriched for H3K27me3 in wild-type cells (***P<1e-16). (c) Histone marks at the promoters of genes that are upregulated or downregulated in Ts1Rhr vs. wild-type cells (**P< 1e-5). (d) Chromatin marks in wild-type B cells present at promoters of all genes (left) or genes that are upregulated in Ts1Rhr B cells (right, ***P<0.0001 compared to all genes by Chi-square with Yates’ correction). (e) Colony counts in the presence of DMSO or GSK-J4 (n=3–6 biological replicates per genotype, *P<0.05 compared to DMSO for same genotype). (f) Colony counts in the presence of GSK-126 or after withdrawal at passage 5 (*P<0.05 compared to GSK-126 for same genotype, #P<0.05 compared to other genotype or no withdrawal). Arrow indicates GSK-126 withdrawal. (g) Western blotting of passage 2 colonies after 14 total days in culture with DMSO, 1 µM GSK-J4, or 1 µM GSK-126. (h) Western blotting of colonies one passage (7 days) after continuation (+) or removal (−) of GSK-126.
Bivalent marks may indicate genes that are modulated during lineage-specific differentiation26. Thus, the global loss of H3K27me3 from chr.21q22 triplication may selectively drive a progenitor B cell-specific developmental program. In support of this, the Ts1Rhr and PRC2/H3K27me3 gene sets were highly enriched for predicted binding sites of the master B cell transcription factors E2A/TCF3 and LEF1 (Supplementary Fig. 6e)24,25. Genes within the Ts1Rhr gene set had increased proximal occupancy by E2A/TCF3 (Supplementary Fig. 6f), based on a previous dataset from wild-type and E2A-deficient murine B cell progenitors24. In addition, the expression of genes within both the Ts1Rhr gene set and the core Ts1Rhr set was preferentially increased in the presence of E2A/TCF3 (Supplementary Fig. 6g).
We hypothesized that pharmacologic restoration of H3K27me3 with GSK-J427, a selective inhibitor of H3K27 demethylases, would block Ts1Rhr B cell repassaging. GSK-J4 increased H3K27me3 in Ts1Rhr B cells, decreased colony-forming activity, and blocked indefinite repassaging (Fig. 3e,g). Previous studies demonstrated that 10µM GSK-J4 reduces lipopolysaccharide-induced proinflammatory cytokine production by human primary macrophages27. IC50 values for GSK-J4 across a panel of Down syndrome-ALLs ranged from 1.4–2.5µM (Supplementary Fig. 6h). Treatment with GSK-12628, a selective inhibitor of the PRC2 catalytic subunit EZH2, decreased H3K27me3 and was sufficient to confer indefinite repassaging in wild-type B cells that was reversible upon drug withdrawal (Fig. 3f–h).
Among the 31 triplicated genes in Ts1Rhr cells is Hmgn1, which encodes a nucleosome binding protein that modulates transcription and promotes chromatin decompaction3,5. Modest increases in HMGN1 induce changes in histone H3 modifications and gene expression4,29. Overexpression of HMGN1 in murine Ba/F3 B cells suppressed H3K27me3 in a dose-dependent fashion (Fig. 4a, Supplementary Fig. 7a). By RNA-seq, Hmgn1 was one of only seven triplicated genes that maintained >70% of its passage 1 expression level at passages 3 and 6 in all Ts1Rhr replicates (Supplementary Fig. 7b), suggesting it may be necessary for serial repassaging. To address this, we transduced 5 shRNAs targeting each of the 31 triplicated genes and controls individually into Ts1Rhr and wild-type passage 1 B cells (Supplementary Fig. 7c). Transduced cells were pooled and serially passaged.
Figure 4. HMGN1 overexpression decreases H3K27me3 and promotes transformed B cell phenotypes.

(a) Western blotting of Ba/F3 cells transduced with empty virus or murine HMGN1 (n=3 independent biological replicates). (b) Relative shRNA representation over passages 1–3. Each line represents an individual shRNA (n=155 total). The five shRNAs targeting Hmgn1 are indicated. (c) GSEA plots for the full and core Ts1Rhr gene sets in HMGN1_OE transgenic B cells. (d) B cell colonies during repassaging of WT and HMGN1_OE BM (n=4–5 biological replicates per genotype from two independent experiments, *P<0.05). (e) Leukemia-free survival of recipient mice after transplantation of wild-type or HMGN1_OE bone marrow transduced with BCR-ABL (aggregate of three independent experiments [Supplementary Fig. 8], n=20 [WT] or n=28 [HMGN1_OE] per group, curves compared by log-rank test).
As expected, positive control shRNAs were equally depleted at later passages from Ts1Rhr and wild-type backgrounds (Supplementary Fig. 7d, Supplementary Table 1G). Among shRNAs against triplicated genes, two of the top four that most selectively depleted Ts1Rhr B cells targeted Hmgn1 (Fig. 4b, Supplementary Table 1H). The remaining three shRNAs targeting Hmgn1 also preferentially depleted Ts1Rhr B cells. By passage 6, all 5 shRNAs against Hmgn1 were depleted >99% averaged across replicates. All five shRNAs also reduced HMGN1 protein in Ba/F3 cells (Supplementary Fig. 7e).
Finally, we analyzed mice with transgenic overexpression of human HMGN1 (HMGN1_OE) at levels comparable to mouse HMGN1 (Supplementary Fig. 7f)30. HMGN1_OE passage 1 B cells had a gene expression signature highly enriched for the Ts1Rhr and core Ts1Rhr gene sets (Fig. 4c). Compared to control bone marrow, HMGN1_OE bone marrow had reduced Hardy C cells in vivo (Supplementary Fig. 7g), generated more B cell colonies in passages 1–4 in vitro (Fig. 4d), and resulted in greater penetrance and shorter latency of BCR-ABL-induced B-ALL (Fig. 4e). Thus, HMGN1 overexpression recapitulates many transcriptional and phenotypic alterations observed from triplication of all 31 Ts1Rhr genes.
In conclusion, we have shown that triplication of chr.21q22 genes confers cell autonomous differentiation and transformation phenotypes in progenitor B cells. By first delineating these biologic consequences of chr.21q22 triplication, we were able to more effectively interrogate human B-ALL datasets and demonstrate that Down syndrome-ALLs are distinguished by the overexpression of H3K27me3-marked genes. Our data also highlight the therapeutic potential of H3K27 demethylase inhibitors for B-ALLs with extra copies of chr.21q22. At the same time, EZH2 inhibitors may be useful for in vitro or in vivo expansion of precursor B cells. Finally, we provide evidence that overexpression of HMGN1 suppresses global H3K27me3 and promotes B-ALL in vivo. Further studies are needed to determine how HMGN1 modulates transcription at differentially expressed loci in cells with polysomy 21 as well as the contributions from other triplicated chr.21q22 loci.
GEO Datasets
RNA-seq, ChIP-seq, and microarray expression data is available through GEO (GSE48555).
Online Methods
Mice
All animal experiments were performed with approval of the DFCI IACUC. All experiments were performed in an FVB×C57BL/6 F1 background, unless otherwise specified. Ts1Rhr (B6.129S6-Dp(16Cbr1-ORF9)1Rhr/J; #005838) and Ts65Dn (B6EiC3Sn.BLiA-Ts(1716)65Dn/DnJ; #005252) mice were from Jackson Laboratories. HMGN1_OE mice were previously described.30 Pax5+/− mice31 backcrossed to C57BL/6 were obtained from M. Busslinger. Eµ-CRLF2 and Eµ-JAK2 R683G were generated by subcloing cDNAs expressing human CRLF2 or mouse JAK2 R683G11,13 downstream of the immunoglobulin heavy chain enhancer (Eµ) and generating transgenic founders in FVB fertilized eggs as previously described.32. Controls for Ts1Rhr were wild-type littermates from crosses with either C57BL/6 (Jackson; #000664) or FVB (Jackson; #001800) mice as indicated. Controls for Ts65Dn were littermates from the colony (B6EiC3Sn.BLiAF1/J; Jackson #003647). HMGN1_OE mice30 had been backcrossed >10 generations to C57BL/6.33 Controls for HMGN1_OE were wild-type littermates after crossing with FVB mice. Donors for competitive transplantation were congenic CD45.1+ B6.SJL-Ptprca Pepcb/BoyJ (Jackson; stock #002014) crossed with FVB (CD45.1), C57BL/6×FVB F1 (CD45.1/2), or Ts1Rhr (C57BL/6) crossed with FVB F1 (CD45.1/2). Recipients for competitive transplant, and BCR/ABL and Ik6 bone marrow transplants were C57BL/6xFVB F1 female mice. No randomization was performed for experiments involving mice or samples collected from animals.
Antibodies
Western blotting antibodies were HMGN1 (Aviva Systems Biology, #ARP38532_P050), HMGN1 (Abcam, #ab5212), mouse HMGN1 (affinity purified rabbit polyclonal)34,35, H3K27me3 (Cell Signaling Technologies, #9733, rabbit polyclonal), total H3 (Cell Signaling Technologies, #9715, rabbit polyclonal), and α-tubulin (Sigma, #T9026, mouse monoclonal). Flow cytometry antibodies were B220-Pacific Blue (BD Pharmingen, #558108, clone RA3-6B2), CD43-APC (BD, #560663, clone S7) or CD43-FITC (BD, #561856, clone S7), CD24-PE-Cy7 (BD, #560536, clone M1/69), BP1-PE (eBiosciences, 12-5891, clone 6C3) or BP1-FITC (eBiosciences, 11-5891, clone 6C3), CD45.1-PE-Cy7 (eBiosciences, 25-0453, clone A20), and CD45.2-APC (eBiosciences, 17-0454, clone 104). ChIP-seq antibodies were H3K27me3 (Cell Signaling Technologies, #9733), H3K4me3 (Abcam, #ab8580), and H3K27ac (Abcam, #ab4729).
Flow cytometry for bone marrow B cells
Whole bone marrow was harvested from femurs and tibias of 6–8-week-old mice. After red blood cell lysis (Qiagen, #158904), B cell progenitors were stained using antibodies and flow cytometry was performed as previously described.8 Analysis was performed on a BD FACSCanto II.
Competitive bone marrow transplantation
Whole bone marrow was pooled from femurs and tibias of 8-week-old donor mice. Donor cells were wild-type or Ts1Rhr CD45.1+/CD45.2+ C57BL/6xFVB F1 (test) and CD45.1+ B6.SJLxFVB F1 (competitor), and were mixed 1:1. Recipients were lethally irradiated (550 cGy x2, >4 h apart). B6.SJLxFVB F1 mice received 106 total cells via lateral tail vein injection. Bone marrow was harvested 16 weeks after transplantation and analyzed by flow cytometry.
Methylcellulose colony forming assays
Whole bone marrow was harvested from 6–8-week-old mice, and red blood cells were lysed. Cells were plated in B cell (Methocult M3630, Stem Cell Technologies) or myeloid (Methocult M3434) methylcelluose media in gridded 35 mm dishes. Myeloid colonies were plated at 2×10⁴ cells/ml per passage. B cell colonies were plated at 2×10⁵ cells/ml in passage 1, and at 5×10⁴ cells/ml per subsequent passage. Colonies were counted at 7 days, and colonies were then pooled and replated in the same manner.
BMT models
For BCR-ABL transplantations17, 105 transduced cells were transplanted with 106 wild-type untransduced bone marrow cells for radioprotection. For generation of BCR-ABL B-ALLs derived from Hardy B cells, 5×10⁴ Hardy B cells from 6 week-old mice were sorted on a BD FACSAria II SORP, spinoculation was performed as above, and 103 cells were transplanted into lethally irradiated wild-type recipients with 106 bone marrow cells for radioprotection. Dominant negative Ikaros experiments were performed similarly, except 106 cells spinfected with an MSCV retrovirus expressing GFP alone, or coexpressing GFP and Ik614,36, were transplanted. Mice were followed daily for clinical signs of leukemia and were sacrificed when moribund. Investigators were not blinded to the experimental groups. 10 mice were used per arm for 80% power to detect a 60% difference in survival at a specific time point with alpha of 0.05. No animals were excluded from analysis.
Cell culture
Ba/F3 experiments were performed as previously described.13 shRNAs targeting Hmgn1 are described below (competitive shRNA assay), and cDNA expressing HMGN1 was previously described.29 One week after selection in puromycin, retroviral cDNA or lentiviral shRNA-transduced cells were harvested for western blotting. hTERT-RPE1 cells were cultured in DMEM/F-12. Mouse A9 cells containing a single human chromosome 21 tagged with a neomycin resistance gene (a gift from Dr. M. Oshimura, Tottori University, Japan) were cultured in DMEM. All medium was supplemented with 10% FBS, 100 IU/ml penicillin, and 100 µg/ml streptomycin.
Immunoblotting and quantitation
Western blotting was performed as previously described.13 Image J (http://imagej.nih.gov/ij) was used for quantitation of immunoblots, with band intensity normalized to total H3.
Microcell-mediated chromosome transfer (MMCT)
MMCT was performed as previously described37 with modifications. A9 cells were cultured to ~70% confluence, and treated with 75 ng/ml colcemid for 48 hours. Cells were collected and resuspended in 1:1 DMEM: Percoll (GE Healthcare Biosciences) with 10 µg/ml Cytochalasin B (Sigma-Aldrich), and spun at 17,000 rpm for 75 minutes in a Beckman JA17 rotor. Supernatant was collected and filtered through 10 and 5 µm filters. Approximately 2×10⁶ RPE1 cells were collected and mixed with filtered microcells, treated with 100 µg/ml PHA-P (Sigma-Aldrich) for 30 minutes, and fused by PEG 1500 (Sigma-Aldrich) in solution. Hybrid cells were plated and cultured for 48 hours, and selected with 500 µg/ml Geneticin (Life Technologies) for 12–14 days. Standard G-band analysis was performed at Karyologic, Inc. SNP array was performed at the DFCI microarray core, using the Human Mapping 250k-Nsp platform. Fluorescent in situ hybridization was performed with the Vysis LSI 21 SpectrumOrange probe (Abbott Molecular) according to the manufacturer’s instructions.
DR-GFP and DR-GFP-CE reporter targeting
Generating and screening of targeted clones were performed as described38, with the following modifications. 106 RPE1 cells with 2, 3, or 4 copies of chromosome 21 were nucleofected with 2 µg pAAVS1-DRGFP or pAAVS1-DRGFPCE plasmid together with 2 µg pZFN-AAVS1, using program X-001 of the Amaxa nucleofector II (Lonza). Targeting of individual clones was confirmed by PCR using the Accuprime GC-rich DNA polymerase (Life Technologies). The presence of a single integrant was determined by qPCR (data not shown).
DNA repair assays using DR-GFP reporter cell lines
Assays for homologous recombination and imprecise non-homologous end-joining were performed as previously described39 with the following modifications. Transfections were performed with the Neon transfection system (Life Technologies) using 1600V, 20ms, and 1 pulse. 4×10⁵ DR-GFP cells were transfected with 10 µg I-SceI expression vector (pCBASce) or empty vector (pCAGGS) and plated in 6-well plates. pmCherry-C1 vector (Clonetech) was transfected in parallel to confirm equal transfection efficiency. Cells were cultured for 7 days and analyzed by FACS using FACSCalibur (BD Biosciences) for homology-directed repair. The remaining cells were used to extract genomic DNA. 1 µg DNA was digested with 20U I-SceI (Roche) overnight, purified, and amplified with a two-step PCR protocol. Accuprime GC-rich polymerase was used for the first step PCR (20 cycles), and Taq polymerase (Qiagen) was used for the second step PCR (20 cycles). PCR products were cloned with the TOPO TA cloning kit for sequencing (Life Technologies). For DR-GFP-CE, pCAGGS-RAG1 and pCAGGS-RAG2 vectors were co-transfected. 1 µg genomic DNA was digested with 10U MfeI and 10U NdeI (NEB) overnight to exclude templates that had not been cleaved by RAG-1 and RAG-2 before PCR amplification. Primer sequences are available in Supplementary Table 2.
Competitive shRNA assay in primary B cells
shRNAs targeting triplicated Ts1Rhr genes and controls were obtained from The RNAi Consortium (http://www.broadinstitute.org/rnai/trc) as pLKO lentiviral supernatants40 (n=185, see Table S1 for clone ID# and target sequences). Wild-type or Ts1Rhr passage 1 B cell colonies were collected and plated at 5×10⁴ cells per well of a 96 well plate in 100 µl of RPMI with 20% FBS, and 10 ng/mL each of murine IL7, stem cell factor, and FLT3 ligand (all from R&D Systems), with 8 µg/ml polybrene. 10 µl of lentiviral supernatant was added and the plate was centrifuged at 1000xg for 30 minutes, and then placed in a 37°C incubator for 24 hours. Wells were pooled, 106 cells were saved for input shRNA analysis, and 2×10⁶ cells were plated in 6 ml M3630 methylcellulose with 0.05 µg/ml puromycin in a 10 cm non-tissue culture treated dish. At this density of plating, after 7 days of growth there were at least 4×10⁴ colonies per plate which would represent >200 colonies per individual shRNA on average. After each passage, genomic DNA was harvested from 106 cells (Qiagen QIAmp kit), and 2×10⁶ cells were replated in the same manner. Repassaging continued until cultures stopped forming new colonies (3–4 passages for wild-type) or until 6 passages were completed. The entire assay was repeated in n=3 (wild-type) and n=4 (Ts1Rhr) independent biological replicates.
The shRNA encoded in the genomic DNA was amplified using two rounds of PCR. Primary PCR reactions were performed using up to 10 µg of genomic DNA in 100 µl reactions consisting of 10 µl buffer, 8 µl dNTPs (2.5 mM each), 10 µl of 5 µM primary PCR primer mix (see below) and 1.5 µl Takara exTaq. For the secondary PCR amplification the reaction was performed as previously described 40 using modified forward primers, which incorporated Illumina adapters and 6-nucleotide barcodes. Secondary PCR reactions were pooled and run on a 2% agarose gel. The bands were normalized and pooled based on relative intensity. Equal amount of sample was run on a 2% agarose gel and gel purified. Samples were sequenced using a custom sequencing primer on an Illumina Hi-Seq and quantitated as previously described.40 Primary, secondary, and sequencing primers are listed in Supplementary Table 2.
RNA sequencing and data processing
Total RNA was harvested from B cell colonies (n=3 independent biologic replicates per genotype per passage). RNA sequencing was performed at the DFCI Center for Cancer Computational Biology. Quality control of total RNA was performed using the RNA Qubit Assay (Invitrogen) and the Bioanalyzer RNA Nano 6000 Chip Kit (Agilent). At least 100 ng of total RNA and a Bioanalyzer RNA Integrity Number of >7.0 were required. Library construction was performed using TruSeq RNA Library Prep Kit (Illumina). Final library quality control was performed using the DNA High Sensitivity Qubit Kit (Invitrogen), the Bioanalyzer High Sensitivity Chip Kit (Agilent) and the 7900HT Fast qPCR machine (Applied Biosystems). qPCR was performed using the Illumina Universal Library Quantification Kit from KAPA Biosystems. RNASeq libraries were normalized to 2 nM, pooled for multiplexing in equal volumes, and sequenced at 10 pM on the Illumina HiSeq 2000. Sequencing was performed as 2×50 paired-end reads using the 100 cycles per lane Sanger/Illumina 1.9 deep sequencing protocol. The raw sequence data were subjected to data quality control checks based on per base sequence quality scores, per sequence quality scores, per sequence GC content, sequence length distribution, and overrepresented sequences, which are implemented in the FastQC tool: (http://www.bioinformatics.babraham.ac.uk/projects/fastqc/). Reads that passed quality control filters were aligned against the mouse reference genome by using the ultra high-throughput long read aligner Bowtie241 available through TopHat 2.0.7 (http://tophat.cbcb.umd.edu).42 Mapping results were further analyzed with TopHat to identify splice junctions between exons. Genomic annotations in gene transfer format (GTF) were obtained from Ensembl mouse genome GRCm38: (http://useast.ensembl.org/Mus_musculus/Info). Gene-level expression measurements for 23,021 Ensembl mouse genes were reported in fragments per kilobase per million reads (FPKM) by Cufflinks 2.0.0 (http://cufflinks.cbcb.umd.edu/).43 An FPKM filtering cutoff of 0.1 in at least one sample was used to determine expressed transcripts.
Differential analysis for RNA-Seq transcript expression
Differential analysis was performed by applying the EdgeR method44 implemented in Bioconductor v2.11 (http://www.bioconductor.org/). EdgeR uses empirical Bayes estimation and exact tests based on the negative binomial distribution model of the genome-scale count data. EdgeR estimates the gene-wise dispersions by conditional maximum likelihood, conditioning on the total count for that gene. The gene-wise dispersion is “normalized” by shrinking towards a consensus value based on an empirical Bayes procedure.45 The differential expression is estimated separately for each gene based on an exact test analogous to Fisher’s exact test adopted for over-dispersed data.46
Gene expression profiling (GEP) and Gene Set Enrichment Analysis (GSEA)
The series matrix files for two DS-ALL datasets (AIEOP and ICH) and for were downloaded from GEO (GSE17459)19, as were the Rag1−/− and E2A/Tcf3−/− B cell progenitors (GSE21978).47 RNA from HMGN1 transgenic (HMGN1_OE) or wild-type littermate B cell colonies was processed and hybridized to Affymetrix Mouse Gene 2.0 ST array at the DFCI Microarray Core per the manufacturer’s instructions. Raw probe-level data from the AIEOP-2 non-DS-ALL cohort and the mouse HMGN1_OE GEP were summarized using the Robust Multiarray Average (RMA)48 and Brainarray custom chip identification files based on Entrez IDs (Version 17)49 using the ExpressionFileCreator module in Gene Pattern.50 For GSEA the expression file was converted to human gene orthologs using BioMart.51 GSEA of the Ts1Rhr, the core Ts1Rhr, and the PRC2 gene sets was performed as previously described using GSEA v2.0.10 (http://www.broadinstitute.org/gsea/).22 The Ts1Rhr gene set was tested for its enrichment in the c1 (positional), c2.cgp (chemical and genetic perturbation), c3.tft (transcription factor targets), and c6 (oncogenic signatures) gene sets deposited in the Molecular Signature Database MSigDB v3.1 (Broad Institute; http://www.broadinstitute.org/gsea/msigdb). The analysis was performed by applying the 2-tailed Fisher test method, as implemented in the Investigate_GeneSets module at MSigDB. To define the Ts1Rhr B cell gene set, the top 150 most differentially expressed protein coding genes with an adjusted p-value below 0.25 were selected. Hierarchical clustering of this signature in DS-ALL vs non-DS-ALL revealed a subset of genes most contributing to the distinguishing phenotype and this branch defined the “Core” Ts1Rhr gene set. Full gene sets for BENPORATH_SUZ12_TARGETS, MIKKELSEN_MEF_HCP_WITH_H3K27ME3, and MIKKELSEN_MEF_NPC_WITH_H3K27ME3 were obtained from MSigDB v3.1. The 100 most differentially expressed genes between the DS-ALLs and the non-DS-ALLs were determined using the MarkerSelectionModule in Gene Pattern. For E2A target gene expression, we compared RAG1−/− proB cells to E2A−/− preproB cells to generate probesets with >1.5-fold change and P<0.05 between conditions, exactly as had been done by the authors.47 The Ts1Rhr and core gene sets were compared to all probesets for their relative expression in E2A wild-type (RAG1−/− proB) vs E2A−/− cells.
Network enrichment mapping
The gene sets with significant enrichment in genes up-regulated in Ts1Rhr by GSEA were selected based on the maximum cut-off value 0.05 for P-value and FDR, and visualized with Enrichment Map software.23 This software organizes the significant gene sets into a network, where nodes correspond to gene sets and the edges reflect significant overlap between the nodes according to a Fisher’s test. The size of the nodes is proportional to the number of genes in the gene set. The hubs correspond to collections of genes sets with significant pair-wise overlap which have a unifying functional description according to GO biological processes. The node color is associated to the functional description of the hub. The clusters provided by the Enrichment Map are described in Table S1D.
Visualization of gene expression and mass spectrometry data
RNASeq-derived expression data from Ts1Rhr and wild-type B cells, B-ALL gene expression data, and histone mass spectrometry data were visualized as heat maps using GENE-E (Broad Institute; http://www.broadinstitute.org/cancer/software/GENE-E/).
Column purification of mouse B-ALLs
For western blotting of mouse B-ALLs we enriched cryopreserved B-ALL splenocytes using anti-CD19 antibody conjugated to magnetic microbeads (#130-052-201) and an MS MACS column (#130-042-201), both from Miltenyi Biotec.
Histone mass spectrometry
Mass spectrometry for global Histone H3 post-translational modifications was performed as previously described,52 using wild-type or Ts1Rhr passage 1 B cells and BCR-ABL B-ALLs. H3K27 modifications are presented in conjunction with H3K36, as both are present in the same measured peptides because of their close proximity. Significance calculated as difference from log2 ratio of zero by t test.
Drug treatment
GSK-J4 (#M60063-2) and GSK-126 (#M60071-2) were purchased from Xcessbio. For methylcellulose experiments, at each passage DMSO, GSK-J4, or GSK-126 were added to cultures a final concentration of 1 µM. DS-ALLs (deidentified specimens obtained with informed consent under DFCI IRB protocol 05-001) were treated in vitro in quadruplicate with GSK-J4 at two-fold dilutions from 40 nM to 10 µM in RPMI with 20% calf serum supplemented with 10 ng/mL IL3, IL7, SCF, FLT3 ligand, and 50 µM beta-mercaptoethanol. After 3 days, viability was measured using CellTiter-Glo reagent and normalized to DMSO control (Promega).
ChIP analyses
B cell colonies (>5,000 colonies per genotype) from 3 wild-type and 3 Ts1Rhr animals were pooled after 7 days in methylcellulose culture. ChIP was performed as previously described.53 Libraries for sequencing were prepared following the Illumina TruSeq DNA Sample Preparation v2 kit protocol. After end-repair and A-tailing, immunoprecipitated DNA (10–50 ng) or whole cell extract DNA (50 ng) was ligated to a 1:50 dilution of Illumina Adaptor Oligo Mix assigning one of 24 unique indexes in the kit to each sample. Following ligation, libraries were amplified by 18 cycles of PCR using the HiFi NGS Library Amplification kit from KAPA Biosystems. Amplified libraries were then size-selected using a 2% gel cassette in the Pippin Prep system from Sage Science set to capture fragments between 200 and 400 bp. Libraries were quantified by qPCR using the KAPA Biosystems Illumina Library Quantification kit according to kit protocols. Libraries with distinct TruSeq indexes were multiplexed by mixing at equimolar ratios and running together in a lane on the Illumina HiSeq 2000 for 40 bases in single read mode. Alignment to mouse genome assembly NCBI37/mm9 and normalization were performed as previously described.54 Regions of modified histones enriched in wild type and Ts1Rhr cells were identified using MACS peak calling algorithm at a P-value of 1e-9.55 Location analysis of ChIP-target enriched regions was performed using the CEAS software suite developed by the Liu lab at DFCI.56 Promoters states were classified by the presence of H3K4me3, H3K27me3, or both (bivalent) ChIP-seq enriched regions in the +/− 1kb region relative to the transcriptional start site (TSS). ChIP-qPCR was performed on two independent sets of pooled B cell colonies from 3 wild-type and 3 Ts1Rhr mice (primers available upon request). For analysis of upregulated genes in Ts1Rhr B cells, we excluded the 31 triplicated genes in Ts1Rhr mice. Data are presented as boxplots designating median (black line), 1 SD (box), and 2 SD (whiskers). E2A ChIP-Seq data from Rag1−/− proB cells were obtained from GEO (GSE21978)47 and mapped to the genome as above. We defined regions of enriched E2A genomic occupancy using the MACS algorithm as above. Genes were considered associated with E2A if their gene body overlapped an E2A enriched region, or if their TSS was within 50kb of an E2A enriched region, as was performed previously.57
Statistical analyses
Pairwise comparisons are represented as means +/− SEM by two-tailed Student t test, except where otherwise specified. Categorical variables were compared using a Fisher’s exact test. Kaplan-Meier survival curves were compared using the log-rank test.
Supplementary Material
Acknowledgments
The authors thank Nadja Kopp and Amy Schlauch for technical assistance. This research was supported by the Conquer Cancer Foundation (A.A.L), Lauri Strauss Leukemia Foundation (A.A.L.), and Leukemia & Lymphoma Society (A.A.L.), the Alex Lemonade Stand Foundation Innovation Award (H.L. and D.P.), the US Department of Defense (C.Y.L), the Israel Science Foundation (S.I.), the US Israel Binational Foundation (J.D.C. and S.I.), the Stellato Fund (D.M.W.), NIH/NCI R01 awards CA15198-01 and CA172387-A01 (D.M.W.), and a Translational Research Award from the Leukemia and Lymphoma Society (J.D.C. and D.M.W.).
Footnotes
Author Contributions
A.A.L, T.T., H.L., D.vB., T.A.D, S-C.W., H.L., A.Y., S.M., J.E.T., J.D.J., and G.teK. designed and performed experiments. A.A.L., B.C., C.L., G.A., T.J.S., K.S., K.E.S., D.N, J.D.J., S.I., J.D.C., D.P., and D.M.W. analyzed data. A.S., J.E.B., W.C.H., J.D.J. developed analytical tools. M.B., M.H., L.B.S., S.E.S., and D.P. provided essential reagents. A.A.L. and D.M.W. wrote the paper.
Disclosure: The authors have no competing financial interests to disclose and the material has not been published or presented elsewhere.
References
- 1.Rabin KR, Whitlock JA. Malignancy in Children with Trisomy 21. Oncologist. 2009 doi: 10.1634/theoncologist.2008-0217. [DOI] [PMC free article] [PubMed] [Google Scholar]
- 2.Heerema NA, Raimondi SC, Anderson JR, et al. Specific extra chromosomes occur in a modal number dependent pattern in pediatric acute lymphoblastic leukemia. Genes Chromosomes Cancer. 2007;46:684–693. doi: 10.1002/gcc.20451. [DOI] [PubMed] [Google Scholar]
- 3.Catez F, Brown DT, Misteli T, Bustin M. Competition between histone H1 and HMGN proteins for chromatin binding sites. EMBO Rep. 2002;3:760–766. doi: 10.1093/embo-reports/kvf156. [DOI] [PMC free article] [PubMed] [Google Scholar]
- 4.Lim JH, West KL, Rubinstein Y, Bergel M, Postnikov YV, Bustin M. Chromosomal protein HMGN1 enhances the acetylation of lysine 14 in histone H3. Embo J. 2005;24:3038–3048. doi: 10.1038/sj.emboj.7600768. [DOI] [PMC free article] [PubMed] [Google Scholar]
- 5.Rattner BP, Yusufzai T, Kadonaga JT. HMGN proteins act in opposition to ATP-dependent chromatin remodeling factors to restrict nucleosome mobility. Molecular cell. 2009;34:620–626. doi: 10.1016/j.molcel.2009.04.014. [DOI] [PMC free article] [PubMed] [Google Scholar]
- 6.Olson LE, Richtsmeier JT, Leszl J, Reeves RH. A chromosome 21 critical region does not cause specific Down syndrome phenotypes. Science. 2004;306:687–690. doi: 10.1126/science.1098992. [DOI] [PMC free article] [PubMed] [Google Scholar]
- 7.Moorman AV, Ensor HM, Richards SM, et al. Prognostic effect of chromosomal abnormalities in childhood B-cell precursor acute lymphoblastic leukaemia: results from the UK Medical Research Council ALL97/99 randomised trial. Lancet Oncol. 2010;11:429–438. doi: 10.1016/S1470-2045(10)70066-8. [DOI] [PubMed] [Google Scholar]
- 8.Hardy RR, Carmack CE, Shinton SA, Kemp JD, Hayakawa K. Resolution and characterization of pro-B and pre-pro-B cell stages in normal mouse bone marrow. J Exp Med. 1991;173:1213–1225. doi: 10.1084/jem.173.5.1213. [DOI] [PMC free article] [PubMed] [Google Scholar]
- 9.Reeves RH, Irving NG, Moran TH, et al. A mouse model for Down syndrome exhibits learning and behaviour deficits. Nat Genet. 1995;11:177–184. doi: 10.1038/ng1095-177. [DOI] [PubMed] [Google Scholar]
- 10.Roy A, Cowan G, Mead AJ, et al. Perturbation of fetal liver hematopoietic stem and progenitor cell development by trisomy 21. Proceedings of the National Academy of Sciences of the United States of America. 2012;109:17579–17584. doi: 10.1073/pnas.1211405109. [DOI] [PMC free article] [PubMed] [Google Scholar]
- 11.Mullighan CG, Collins-Underwood JR, Phillips LA, et al. Rearrangement of CRLF2 in B-progenitor- and Down syndrome-associated acute lymphoblastic leukemia. Nat Genet. 2009;41:1243–1246. doi: 10.1038/ng.469. [DOI] [PMC free article] [PubMed] [Google Scholar]
- 12.Russell LJ, Capasso M, Vater I, et al. Deregulated expression of cytokine receptor gene, CRLF2, is involved in lymphoid transformation in B-cell precursor acute lymphoblastic leukemia. Blood. 2009;114:2688–2698. doi: 10.1182/blood-2009-03-208397. [DOI] [PubMed] [Google Scholar]
- 13.Yoda A, Yoda Y, Chiaretti S, et al. Functional screening identifies CRLF2 in precursor B-cell acute lymphoblastic leukemia. Proc Natl Acad Sci U S A. 2010;107:252–257. doi: 10.1073/pnas.0911726107. [DOI] [PMC free article] [PubMed] [Google Scholar]
- 14.Iacobucci I, Lonetti A, Messa F, et al. Expression of spliced oncogenic Ikaros isoforms in Philadelphia-positive acute lymphoblastic leukemia patients treated with tyrosine kinase inhibitors: implications for a new mechanism of resistance. Blood. 2008;112:3847–3855. doi: 10.1182/blood-2007-09-112631. [DOI] [PubMed] [Google Scholar]
- 15.Mullighan CG, Zhang J, Harvey RC, et al. JAK mutations in high-risk childhood acute lymphoblastic leukemia. Proceedings of the National Academy of Sciences of the United States of America. 2009;106:9414–9418. doi: 10.1073/pnas.0811761106. [DOI] [PMC free article] [PubMed] [Google Scholar]
- 16.Wetzler M, Dodge RK, Mrozek K, et al. Additional cytogenetic abnormalities in adults with Philadelphia chromosome-positive acute lymphoblastic leukaemia: a study of the Cancer and Leukaemia Group B. British journal of haematology. 2004;124:275–288. doi: 10.1046/j.1365-2141.2003.04736.x. [DOI] [PubMed] [Google Scholar]
- 17.Krause DS, Lazarides K, von Andrian UH, Van Etten RA. Requirement for CD44 in homing and engraftment of BCR-ABL-expressing leukemic stem cells. Nat Med. 2006;12:1175–1180. doi: 10.1038/nm1489. [DOI] [PubMed] [Google Scholar]
- 18.Cabelof DC, Patel HV, Chen Q, et al. Mutational spectrum at GATA1 provides insights into mutagenesis and leukemogenesis in Down syndrome. Blood. 2009;114:2753–2763. doi: 10.1182/blood-2008-11-190330. [DOI] [PMC free article] [PubMed] [Google Scholar]
- 19.Hertzberg L, Vendramini E, Ganmore I, et al. Down syndrome acute lymphoblastic leukemia, a highly heterogeneous disease in which aberrant expression of CRLF2 is associated with mutated JAK2: a report from the International BFM Study Group. Blood. 2010;115:1006–1017. doi: 10.1182/blood-2009-08-235408. [DOI] [PubMed] [Google Scholar]
- 20.Smith JR, Maguire S, Davis LA, et al. Robust, Persistent Transgene Expression in Human Embryonic Stem Cells Is Achieved with AAVS1-Targeted Integration. Stem Cells. 2008;26:496–504. doi: 10.1634/stemcells.2007-0039. [DOI] [PubMed] [Google Scholar]
- 21.Weinstock DM, Jasin M. Alternative pathways for the repair of RAG-induced DNA breaks. Mol Cell Biol. 2006;26:131–139. doi: 10.1128/MCB.26.1.131-139.2006. [DOI] [PMC free article] [PubMed] [Google Scholar]
- 22.Subramanian A, Tamayo P, Mootha VK, et al. Gene set enrichment analysis: a knowledge-based approach for interpreting genome-wide expression profiles. Proc Natl Acad Sci U S A. 2005;102:15545–15550. doi: 10.1073/pnas.0506580102. [DOI] [PMC free article] [PubMed] [Google Scholar]
- 23.Merico D, Isserlin R, Stueker O, Emili A, Bader GD. Enrichment map: a network-based method for gene-set enrichment visualization and interpretation. PloS one. 2010;5:e13984. doi: 10.1371/journal.pone.0013984. [DOI] [PMC free article] [PubMed] [Google Scholar]
- 24.Mikkelsen TS, Ku M, Jaffe DB, et al. Genome-wide maps of chromatin state in pluripotent and lineage-committed cells. Nature. 2007;448:553–560. doi: 10.1038/nature06008. [DOI] [PMC free article] [PubMed] [Google Scholar]
- 25.Ben-Porath I, Thomson MW, Carey VJ, et al. An embryonic stem cell-like gene expression signature in poorly differentiated aggressive human tumors. Nat Genet. 2008;40:499–507. doi: 10.1038/ng.127. [DOI] [PMC free article] [PubMed] [Google Scholar]
- 26.Bernstein BE, Mikkelsen TS, Xie X, et al. A bivalent chromatin structure marks key developmental genes in embryonic stem cells. Cell. 2006;125:315–326. doi: 10.1016/j.cell.2006.02.041. [DOI] [PubMed] [Google Scholar]
- 27.Kruidenier L, Chung CW, Cheng Z, et al. A selective jumonji H3K27 demethylase inhibitor modulates the proinflammatory macrophage response. Nature. 2012;488:404–408. doi: 10.1038/nature11262. [DOI] [PMC free article] [PubMed] [Google Scholar]
- 28.McCabe MT, Ott HM, Ganji G, et al. EZH2 inhibition as a therapeutic strategy for lymphoma with EZH2-activating mutations. Nature. 2012 doi: 10.1038/nature11606. [DOI] [PubMed] [Google Scholar]
- 29.Rochman M, Taher L, Kurahashi T, et al. Effects of HMGN variants on the cellular transcription profile. Nucleic acids research. 2011;39:4076–4087. doi: 10.1093/nar/gkq1343. [DOI] [PMC free article] [PubMed] [Google Scholar]
- 30.Bustin M, Alfonso PJ, Pash JM, Ward JM, Gearhart JD, Reeves RH. Characterization of transgenic mice with an increased content of chromosomal protein HMG-14 in their chromatin. DNA and cell biology. 1995;14:997–1005. doi: 10.1089/dna.1995.14.997. [DOI] [PubMed] [Google Scholar]
- 31.Urbanek P, Wang ZQ, Fetka I, Wagner EF, Busslinger M. Complete block of early B cell differentiation and altered patterning of the posterior midbrain in mice lacking Pax5/BSAP. Cell. 1994;79:901–912. doi: 10.1016/0092-8674(94)90079-5. [DOI] [PubMed] [Google Scholar]
- 32.Dildrop R, Ma A, Zimmerman K, et al. IgH enhancer-mediated deregulation of N-myc gene expression in transgenic mice: generation of lymphoid neoplasias that lack c-myc expression. The EMBO journal. 1989;8:1121–1128. doi: 10.1002/j.1460-2075.1989.tb03482.x. [DOI] [PMC free article] [PubMed] [Google Scholar]
- 33.Abuhatzira L, Shamir A, Schones DE, Schaffer AA, Bustin M. The chromatin-binding protein HMGN1 regulates the expression of methyl CpG-binding protein 2 (MECP2) and affects the behavior of mice. J Biol Chem. 2011;286:42051–42062. doi: 10.1074/jbc.M111.300541. [DOI] [PMC free article] [PubMed] [Google Scholar]
- 34.Birger Y, West KL, Postnikov YV, et al. Chromosomal protein HMGN1 enhances the rate of DNA repair in chromatin. Embo J. 2003;22:1665–1675. doi: 10.1093/emboj/cdg142. [DOI] [PMC free article] [PubMed] [Google Scholar]
- 35.Bustin M, Crippa MP, Pash JM. Immunochemical analysis of the exposure of high mobility group protein 14 and 17 surfaces in chromatin. J Biol Chem. 1990;265:20077–20080. [PubMed] [Google Scholar]
- 36.Trageser D, Iacobucci I, Nahar R, et al. Pre-B cell receptor-mediated cell cycle arrest in Philadelphia chromosome-positive acute lymphoblastic leukemia requires IKAROS function. J Exp Med. 2009;206:1739–1753. doi: 10.1084/jem.20090004. [DOI] [PMC free article] [PubMed] [Google Scholar]
- 37.Yang A, Reeves RH. Increased survival following tumorigenesis in Ts65Dn mice that model Down syndrome. Cancer Res. 2011;71:3573–3581. doi: 10.1158/0008-5472.CAN-10-4489. [DOI] [PMC free article] [PubMed] [Google Scholar]
- 38.Fung H, Weinstock DM. Repair at single targeted DNA double-strand breaks in pluripotent and differentiated human cells. PLoS One. 2011;6:e20514. doi: 10.1371/journal.pone.0020514. [DOI] [PMC free article] [PubMed] [Google Scholar]
- 39.Weinstock DM, Nakanishi K, Helgadottir HR, Jasin M. Assaying double-strand break repair pathway choice in mammalian cells using a targeted endonuclease or the RAG recombinase. Methods Enzymol. 2006;409:524–540. doi: 10.1016/S0076-6879(05)09031-2. [DOI] [PMC free article] [PubMed] [Google Scholar]
- 40.Ashton JM, Balys M, Neering SJ, et al. Gene sets identified with oncogene cooperativity analysis regulate in vivo growth and survival of leukemia stem cells. Cell stem cell. 2012;11:359–372. doi: 10.1016/j.stem.2012.05.024. [DOI] [PMC free article] [PubMed] [Google Scholar]
- 41.Langmead B, Salzberg SL. Fast gapped-read alignment with Bowtie 2. Nature methods. 2012;9:357–359. doi: 10.1038/nmeth.1923. [DOI] [PMC free article] [PubMed] [Google Scholar]
- 42.Trapnell C, Roberts A, Goff L, et al. Differential gene and transcript expression analysis of RNA-seq experiments with TopHat and Cufflinks. Nature protocols. 2012;7:562–578. doi: 10.1038/nprot.2012.016. [DOI] [PMC free article] [PubMed] [Google Scholar]
- 43.Trapnell C, Williams BA, Pertea G, et al. Transcript assembly and quantification by RNA-Seq reveals unannotated transcripts and isoform switching during cell differentiation. Nature biotechnology. 2010;28:511–515. doi: 10.1038/nbt.1621. [DOI] [PMC free article] [PubMed] [Google Scholar]
- 44.Robinson MD, McCarthy DJ, Smyth GK. edgeR: a Bioconductor package for differential expression analysis of digital gene expression data. Bioinformatics. 2010;26:139–140. doi: 10.1093/bioinformatics/btp616. [DOI] [PMC free article] [PubMed] [Google Scholar]
- 45.Robinson MD, Smyth GK. Moderated statistical tests for assessing differences in tag abundance. Bioinformatics. 2007;23:2881–2887. doi: 10.1093/bioinformatics/btm453. [DOI] [PubMed] [Google Scholar]
- 46.Robinson MD, Smyth GK. Small-sample estimation of negative binomial dispersion, with applications to SAGE data. Biostatistics. 2008;9:321–332. doi: 10.1093/biostatistics/kxm030. [DOI] [PubMed] [Google Scholar]
- 47.Lin YC, Jhunjhunwala S, Benner C, et al. A global network of transcription factors, involving E2A, EBF1 and Foxo1, that orchestrates B cell fate. Nature immunology. 2010;11:635–643. doi: 10.1038/ni.1891. [DOI] [PMC free article] [PubMed] [Google Scholar]
- 48.Irizarry RA, Bolstad BM, Collin F, Cope LM, Hobbs B, Speed TP. Summaries of Affymetrix GeneChip probe level data. Nucleic acids research. 2003;31:e15. doi: 10.1093/nar/gng015. [DOI] [PMC free article] [PubMed] [Google Scholar]
- 49.Dai M, Wang P, Boyd AD, et al. Evolving gene/transcript definitions significantly alter the interpretation of GeneChip data. Nucleic acids research. 2005;33:e175. doi: 10.1093/nar/gni179. [DOI] [PMC free article] [PubMed] [Google Scholar]
- 50.Reich M, Liefeld T, Gould J, Lerner J, Tamayo P, Mesirov JP. GenePattern 2.0. Nat Genet. 2006;38:500–501. doi: 10.1038/ng0506-500. [DOI] [PubMed] [Google Scholar]
- 51.Kinsella RJ, Kahari A, Haider S, et al. Ensembl BioMarts: a hub for data retrieval across taxonomic space. Database : the journal of biological databases and curation. 2011;2011:bar030. doi: 10.1093/database/bar030. [DOI] [PMC free article] [PubMed] [Google Scholar]
- 52.Peach SE, Rudomin EL, Udeshi ND, Carr SA, Jaffe JD. Quantitative assessment of chromatin immunoprecipitation grade antibodies directed against histone modifications reveals patterns of co-occurring marks on histone protein molecules. Molecular & cellular proteomics : MCP. 2012;11:128–137. doi: 10.1074/mcp.M111.015941. [DOI] [PMC free article] [PubMed] [Google Scholar]
- 53.Verzi MP, Shin H, He HH, et al. Differentiation-specific histone modifications reveal dynamic chromatin interactions and partners for the intestinal transcription factor CDX2. Developmental cell. 2010;19:713–726. doi: 10.1016/j.devcel.2010.10.006. [DOI] [PMC free article] [PubMed] [Google Scholar]
- 54.Lin CY, Loven J, Rahl PB, et al. Transcriptional amplification in tumor cells with elevated c-Myc. Cell. 2012;151:56–67. doi: 10.1016/j.cell.2012.08.026. [DOI] [PMC free article] [PubMed] [Google Scholar]
- 55.Zhang Y, Liu T, Meyer CA, et al. Model-based analysis of ChIP-Seq (MACS) . Genome Biol. 2008;9:R137. doi: 10.1186/gb-2008-9-9-r137. [DOI] [PMC free article] [PubMed] [Google Scholar]
- 56.Shin H, Liu T, Manrai AK, Liu XS. CEAS: cis-regulatory element annotation system. Bioinformatics. 2009;25:2605–2606. doi: 10.1093/bioinformatics/btp479. [DOI] [PubMed] [Google Scholar]
- 57.Loven J, Hoke HA, Lin CY, et al. Selective inhibition of tumor oncogenes by disruption of super-enhancers. Cell. 2013;153:320–334. doi: 10.1016/j.cell.2013.03.036. [DOI] [PMC free article] [PubMed] [Google Scholar]
Associated Data
This section collects any data citations, data availability statements, or supplementary materials included in this article.