Abstract
As immune defects in amyloid-β (Aβ) phagocytosis and degradation underlie Aβ deposition and inflammation in Alzheimer’s disease (AD) brain, better understanding of the relation between Aβ phagocytosis and inflammation could lead to promising preventive strategies. We tested two immune modulators in peripheral blood mononuclear cells (PBMCs) of AD patients and controls: 1α,25(OH)2-vitamin D3 (1,25D3) and resolvin D1 (RvD1). Both 1,25D3 and RvD1 improved phagocytosis of FAM-Aβ by AD macrophages and inhibited fibrillar Aβ-induced apoptosis. The action of 1,25D3 depended on the nuclear vitamin D and the protein disulfide isomerase A3 receptors, whereas RvD1 required the chemokine receptor, GPR32. The activities of 1,25D3 and RvD1 commonly required intracellular calcium, MEK1/2, PKA, and PI3K signaling; however, the effect of RvD1 was more sensitive to pertussis toxin. In this case study, the AD patients: a) showed significant transcriptional up regulation of IL1RN, ITGB2, and NFκB; and b) revealed two distinct groups when compared to controls: group 1 decreased and group 2 increased transcription of TLRs, IL-1, IL1R1 and chemokines. In the PBMCs/macrophages of both groups, soluble Aβ (sAβ) increased the transcription/secretion of cytokines (e.g., IL1 and IL6) and chemokines (e.g., CCLs and CXCLs) and 1,25D3/RvD1 reversed most of the sAβ effects. However, they both further increased the expression of IL1 in the group 1, sβ-treated cells. We conclude that in vitro, 1,25D3 and RvD1 rebalance inflammation to promote Aβ phagocytosis, and suggest that low vitamin D3 and docosahexaenoic acid intake and/or poor anabolic production of 1,25D3/RvD1 in PBMCs could contribute to AD onset/pathology.
Keywords: Alzheimer’s disease; amyloid-β; 1α,25-dihydroxyvitamin D3; phagocytosis; resolvin D1
INTRODUCTION
According to the amyloid-β (Aβ) hypothesis [1], the deposition of different forms of Aβ in Alzheimer’s disease (AD) brain is the cause of the AD neuropathology [2]. Consistent with this hypothesis, Aβ clearance is reduced in AD patients in comparison to control subjects [3]. Physiological mechanisms of Aβ clearance in mice involve binding to apolipoprotein E and J proteins and transport across the blood-brain barrier in complexes with low density lipoprotein receptor-related protein 1 and 2 [4], enzymatic degradation (reviewed in [5, 6]), and phagocytosis and degradation by microglia [7]. The latter mechanism has been exploited in AD patients by Aβ vaccine and passively-administered Aβ antibodies [8]. The vaccine produced in some patients focal clearance of parenchymal Aβ deposits [9], but has been fraught with complications [10].
Aβ uptake and degradation depend upon microglia/macrophages, but macrophages of AD patients are defective in Aβ binding and uptake [11] and Aβ degradation [12]. Peripheral macrophages have also been shown to infiltrate the AD brain [13]. We have studied several nutraceutical approaches to improve Aβ phagocytosis: the curcuminoid bisdemethoxycurcumin [11], the hormonal form of vitamin D3, 1α,25-dihydroxyvitamin D3 (1,25D3) [14], and resolvins and neuroprotectins derived from the omega-3 fatty acid docosahexaenoic acid (DHA) [15, 16]. In macrophages, 1,25D3 stimulates genomic and nongenomic responses [17] through the nuclear vitamin D receptor (VDR), which is present in nuclear and extranuclear locations [18]. In AD brain, the actions of 1,25D3 are diminished, given the decrease of VDR expression in neurons induced by Aβ [19].
In the AD brain, activated microglia/macrophages and astrocytes display inflammatory cytokines, chemokines, cell adhesion molecules, and complement components [20]. Cytokines have been shown to have a bi-functional role in the brain. Cytokines, like TNFα, are clearly neurotoxic in Parkinson’s disease [21], but can also neuroprotective and neuroreparative (e.g., IL6 signaling through its membrane receptor (IL6R) [22]). Furthermore, the cytokine IL1β initiates the inflammatory cascade and has divergent neurotoxic and Aβ clearance supportive roles in the hippocampus of IL1-transgenic mice [23].
To gain insight into the effects of 1,25D3 and resolvin D1 (RvD1) on phagocytosis and inflammation, we examined: a) the receptors and signaling pathways required for 1,25D3 and RvD1 to promote FAM-Aβ phagocytosis; b) baseline transcription of inflammatory genes in AD patients versus controls; and c) transcriptional regulation of inflammatory genes by Aβ and the lipidic molecules. 1,25D3 and RvD1 retuned the imbalance between phagocytosis and inflammation through different receptors and both specific and common pathways.
MATERIAL AND METHODS
Study Population
The study was approved by the UCLA IRB in AD patients and controls who signed Informed Consent. The diagnosis of probable AD was made by the NINCDA/ADRDA criteria [24], and the patients were cognitively evaluated by the Mini-Mental Status Examination (MMSE). The effects of RvD1 and 1,25D3 were tested in peripheral blood mononuclear cells (PBMCs) of 5 sporadic AD patients and 3 control subjects (active UCLA professors) (Table 1).
Table 1.
Medical summary of the Alzheimer’s disease (AD) and control subjects. The Mimi-Mental Status Exam (MMSE) score for each of the five AD patients and the controls was determined upon initial consult. Any chronic or age-related diseases, addictions, current medications, and nutritional supplements, and the duration of follow up with the subjects are provided in the table. The AD patients were separated into two groups based on the expression of TLRs relative to controls at baseline and the regulatory effects induced by exogenous sAβ (see text and Fig. 4).
| Age, Gender | MMSE score | Chronic or age- related diseases | Addictions | Medications | Nutritional supplements | Duration of follow-up | Group |
|---|---|---|---|---|---|---|---|
| 67 y, M | 23 | None | none | none | Vitamin D3, omega-3 | 9 months | 2 |
| 63 y, M | 17 | None | none | none | None | 11 months | 2 |
| 80 y, F | 19 | Hip replacement | none | Memantine, donepezil | Vitamin D3, omega-3, multivitamins, vitamin E, Axona, aspirin | 53 months | 2 |
| 79 y, F | 8 | None | None | Lovastatin | Vitamin D3, omega-3, curcumin | 49 months | 1 |
| 59 y, M | 19 | Hypertension | None | Memantine, donepezil Atenolol, atorvastatin |
Vitamin D3, omega-3 | 5 months + 41 months by another observer | 1 |
| 77 y, M | 30 | none | none | none | Vitamin D3, omega-3 | 4 years | |
| 75 y, M | 30 | Coronary artery disease, hypertension, GERD | none | Crestor, Prevacid, aspirin | Omega-3, folic acid | 4 years | |
| 84 y, M | 30 | Hypertension | none | Avalide, Flomax | multivitamins, B12, D3, fish oil, B6 | 1 year |
Reagents and Antibodies
Reagents
DHA (Sigma Corp., St. Louis, MO, USA); Resolvin D1 (RvD1, Cayman Corporation, Ann Arbor, MI, USA); 1α,25-dihydroxyvitamin D3 (1,25D3 and the analogue KH, gift from Anthony W. Norman, University of California, Riverside, CA, USA); U0126 (Calbiochem, catalog #: 662005); calphostin C (Calbiochem, catalog #: 208725); Y27632 (Calbiochem, catalog #: 688001); EGTA (Calbiochem # 324626); wortmannin (Ascent Scientific LLC, Princeton, NJ, USA); pertussis toxin (List Biological laboratories, Campbell, CA, USA).
Antibodies
Ab099, anti-Protein disulfide isomerase (PDIA3), a.k.a. endoplasmic reticulum stress protein 57 (ERp57, Ilka Nemere, Utah State University) [25]; anti-IL1β NH2 terminal (Aviva, San Diego, CA, USA); anti-GPR32 (GenTex, catalog # GTX108119).
Cytokines
Recombinant interleukin-1β (NIH #PHC0815).
Cytokine Immunoassays
Supernatant concentrations of IL1β, IL6, IL10, GM-CSF, IL12, IFNγ, TNFα, IL2, and IL4 were assayed using the human-specific ELISA tests (R&D Systems, Minneapolis, MN, USA).
Amyloid-β Forms
Soluble Aβ1-42 (sAβ42) (California Peptide Research, Napa Valley, CA, USA, catalog # 641-15) was dissolved in DMSO (1 μg/μL). To prepare fibrillar Aβ1-42 (fAβ42), Aβ was dissolved in 60 mM NaOH, and then diluted into 1 volume of water, after which an equal volume of 20 mM phosphate buffer, pH 7.4, was added. Samples were sonicated in an ultrasonic water bath (model B1200-R, Branson Ultrasonics Corp., Danbury, CT, USA), for 1 min at 22°C, transferred into centrifugal filters (30,000 molecular weight cutoff, Centricon YM-30, Millipore Corp.), and centrifuged at 16,000 × g using a bench top microcentrifuge (Eppendorf model 5415C, Brinkmann Instruments) for 30 min. The filtrate, containing low molecular weight Aβ, was incubated at 37°C without agitation to allow fibril assembly [26]. Fibrillar FAM-Aβ1-42 (Anaspec, San Jose, CA, USA, catalogue #23526) was prepared the same way as fAβ. By definition, low molecular weight Aβ contains monomeric Aβ in equilibrium with low order oligomers [27].
Macrophage Culture and Phagocytosis of Aβ
PBMCs were isolated by Ficoll-Hypaque gradient technique from venous blood and were differentiated into macrophages (7–14 days) in IMDM medium (Thermo) with 10% autologous serum as described [11] [12]. Replicate AD macrophage cultures were pre-treated with either U0126 (72 nM), Wortmannin (500 nM), PKI (500 nM), PTX (1 μg/ml), EGTA, MK (10−7M), anti-GPR32 (Chr32, 1/200), anti-PDIA3 (1/400), or sham for 30 min, and then were treated with 10 nM 1,25D3 or 26 nM RvD1 and exposed to FAM-Aβ42 (2 μg/ml in DMSO) overnight (18–24 h; all cultures were treated in parallel and the relative effects were not changed by the duration of incubation), stained with phalloidin-Texas Red (Sigma) and DAPI (InVitrogen), photographed in Olympus B-max microscope with Hamamatsu camera, and fluorescence was determined in four fields (40x objective) using Image Pro software and expressed as Integrated Optical Density (IOD) per macrophage. Data are mean ± SEM.
Real Time PCR
Following isolation by the Ficoll-Hypaque technique, approximately 3.0 × 10⁶ PBMCs were incubated overnight in IMDM medium alone (−/−, “basal”), IMDM with 2 μg/ml Aβ42 (+/−, “Aβ42 treatment”), IMDM with 10 nM 1,25D3 and 2 μg/ml Aβ42 (+/+, “1,25D3” treatment), or IMDM with 26.0 nM RvD1 and 2 μg/ml Aβ42 (+/+, “Resolvin” treatment). Cells were pelleted by centrifugation, resuspended in RNA protection medium (Qiagen, Valencia, CA) for storage. Total RNA was extracted using the RNeasy Mini-prep (+ deoxyribonuclease step) kit and, as needed, concentrated and cleaned up (Qiagen RNeasy MinElute Cleanup kit) on the day the array was plated. cDNA was then prepared from 300 ng of total RNA using the RT2 First Strand Kit and was added to RT-PCR reagent SYBR Green Master Mix according to manufacturer protocol (Qiagen). 10 μl of the mixture was added to each of the 384-wells of the RT2 Profiler inflammatory and autoimmune gene array PAHS-077G or nuclear receptor and co-regulator array PAHS-056G (Qiagen). The RT-PCR reaction was performed on the Roche LightCycler 480. Data was processed by the ΔΔCt method using proprietary tools supplied by SABiosciences PCR Data Analysis Web Portal (Qiagen). Each array included control wells of (a) the threshold cycle values for genomic DNA contamination, (b) inhibition of reverse transcription, (c) a positive PCR control, and (d) five housekeeping genes. The fold regulation for a given gene was calculated by comparing a control to a treatment group and using the 2 (−ΔΔCt) normalized with housekeeping genes and other genes on the array with recorded Ct values within 0.5 cycles across the control and treatment groups.
Statistical Analysis
Differences between phagocytosis of Aβ by macrophages treated with various ligands were tested by ANOVA with multiple comparisons and Bonferroni correction and testing of homogeneity of variance by the Levene statistic. The effects of 1,25D3 and RvD1 on phagocytosis were tested by Pearson correlation analysis. Significant regulation of a given gene was determined from running three separate arrays on three separate control and treatment groups. p-values were determined using the proprietary tools supplied in the SABiosciences PCR Data Analysis Web Portal and the data are presented as volcano plots (p-values on y-axis and fold-regulation differences on the x-axis).
RESULTS
1,25D3 and RvD1 increase Aβ phagocytosis and decrease apoptosis through specific receptors and common signaling pathways
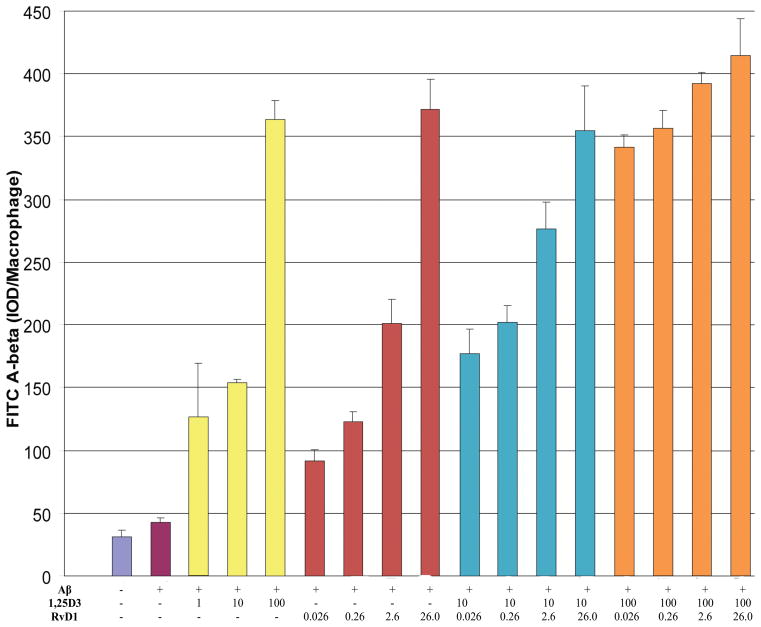
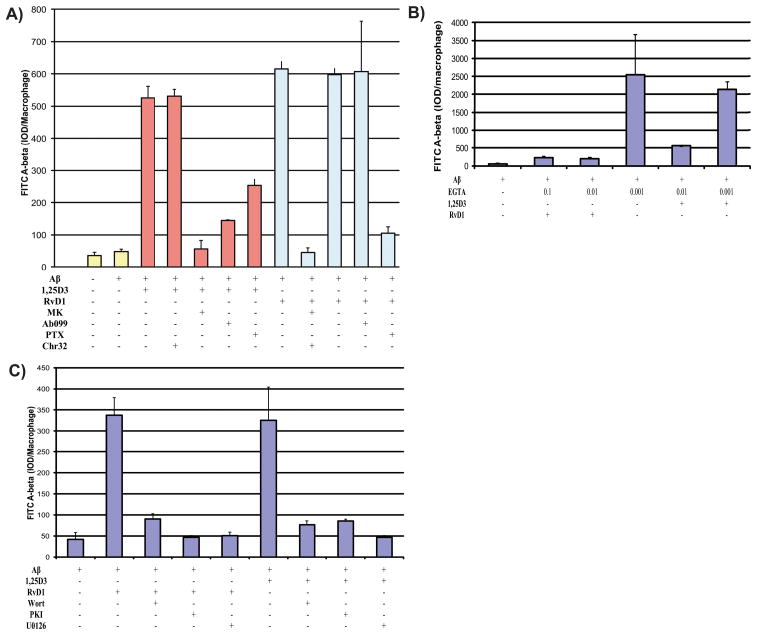
The macrophages of AD patients are defective in phagocytosis of Aβ, whereas in comparison macrophages of age-matched cognitively-normal subjects are fully functional [12]. Here we compared the 1,25D3 and RvD1 effects on FAM-Aβ phagocytosis, by macrophages, in five AD patients and 3 controls (Supplementary Fig. 1; available online: http://www.j-alz.com/issues/34/vol34-1.html#supplementarydata02). In all AD macrophages, phagocytosis was increased by 1,25D3 and RvD1 in a concentration-dependent and additive fashion (10−7 M >10−8 M >10−9 M 1,25D3; 260 nM >26 nM >0.26 nM RvD1) (Fig. 1). The effect of 1,25D3 was completely blocked by the human VDR-1,25D3 genomic antagonist “MK” [14] and the neutralizing antibody Ab099 [25], demonstrating that the VDR and the PDIA3 are both required for 1,25D3 to promote FAM-Aβ phagocytosis by AD macrophages. The effect of RvD1 was not blocked by the 1,25D3 inhibitors, but was by the antibody to its G-protein coupled receptor, GPR32 [28]. Pertussis toxin blocked the effects of RvD1 more so than the effect of 1,25D3 (Fig. 2A), in support of the general classifications of the 1,25D3 and RvD1 receptors. The effects of 1,25D3 and RvD1 were similarly blocked by the chelator of intracellular calcium, EGTA (Fig. 2B), the MEK1/2 inhibitor, U0126, the PI3-kinase blocker, wortmannin, and the endogenous blocker of protein kinase A, PKI (Fig. 2C). Collectively, the results support the recently proposed model describing the mechanism underpinning the ability of 1,25D3 to stimulate Aβ phagocytosis by all types of AD macrophages [29].
Figure 1.
1,25 D3 and RvD1 increase Aβ phagocytosis by macrophages of AD patients in a dose-responsive fashion. Replicate AD macrophage cultures were treated with 1,25D3, RvD1, or both, and exposed to FAM-Aβ overnight. The legend below the bar graphs indicates the concentrations (in nM) of 1,25D3 and/or RvD1. Phagocytosis was determined by scanning photographs of cells with FAM-Aβ (Suppl. Fig. 1). Data are mean ± s.e.m integrated optical density (IOD) per macrophage.
Figure 2.
Receptors and 1,25D3 and RvD1 signaling mechanisms of phagocytosis in macrophages of AD patients. A) Phagocytosis of Aβ by replicate AD macrophage cultures treated with 1,25D3 (10−8M) or RvD1 (26.0 nM) and inhibitors of relevant receptors or metabolic pathways: VDR (inhibited by MK [10−7M]) and PDIA3 (inhibited by the neutralizing antibody, Ab099) are the known receptors for 1,25D3; Chemokine receptor 32 (inhibited by the neutralizing antibody, Chr32, and pertussis toxin, PTX). B) The effect of increasing concentration of the calcium chelator EGTA (concentrations listed in mM) on RvD1 (26.0 nM) and 1,25D3 (10 nM) promotion of FAM-Aβ (2 μg/ml) phagocytosis. C) The effect of PI3K (inhibited by wortmannin), PKA (inhibited by PKI), and MEK1/2 (inhibited by U0126) on the ability of RvD1 (26.0 nM) and 1,25D3 (10 nM) to promote FAM-Aβ (2 μg/ml) phagocytosis.
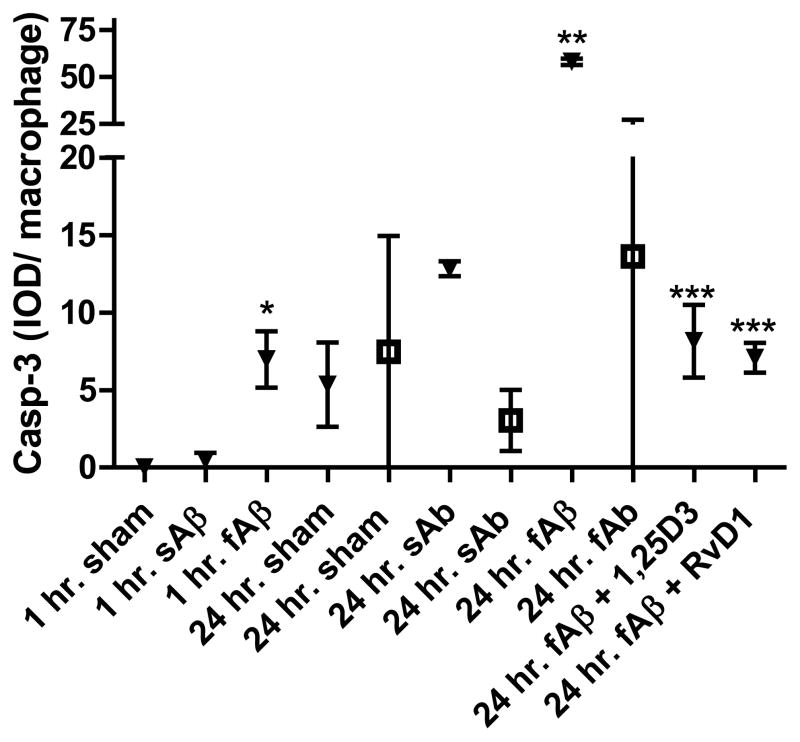
In control macrophages, both fAβ and sAβ failed to induce apoptosis following 24-h incubation. In AD macrophages, treatment with exogenous fAβ significantly induced caspase-3-positive apoptosis at 1 h and 24 h, whereas treatment with sAβ only mildly induced apoptosis after 24 h. Importantly, 1,25D3 and RvD1 inhibited the caspase-3-positive apoptosis of the AD macrophages induced by fAβ treatment (Fig. 3).
Figure 3.
Fibrillar Aβ, but not soluble Aβ, induces caspase-3-positive apoptosis in macrophages of AD patients, but not in control macrophages. Replicate macrophage cultures were exposed to 2 μg/ml FAM-fAβ or FAM-sAβ overnight and then fixed and stained for caspase-3, photographed and fluorescent signal determined by scanning. Open symbols highlight data obtained from control macrophages and closed from AD macrophages (n=3). * indicates significance (p<0.02) when compared to sham (AD); ** indicates significance when compared to fAβ control and sham (p<0.0001); and *** indicates significant reduction when compared to AD fAβ-treated macrophages (p<0.0001) according to a two-tailed t-test.
Baseline transcription of inflammatory genes is bidirectional in AD patients when compared to controls
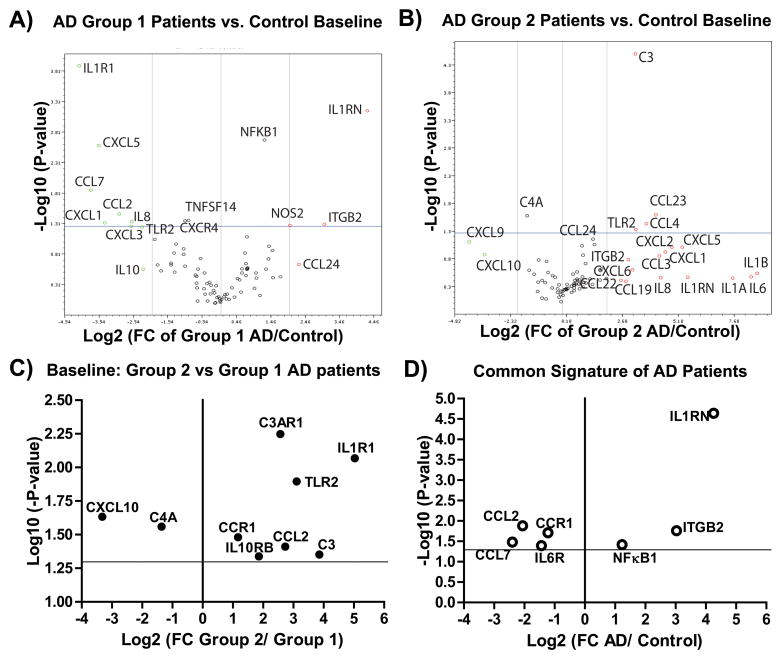
Based on the basal expression of 84 inflammatory genes with respect to controls, two transcription patterns were distinguished: group 1 (patients 4 and 5) highlighted by decreased transcription of toll-like receptors (TLRs), the IL1α/β receptor (IL1R1), and various cytokines (e.g., IL8) and chemokines (e.g., CXCL1/CXCL5, Fig. 5A); and group 2 (patients 1–3), highlighted by increased transcription of TLRs (in particular TLR2, Fig. 4) and various cytokines (e.g., IL1, IL6, and IL8) and chemokines (e.g., CCL4/CCL23, Fig. 5B). In the group 1 AD patients, significant upregulation in the expression of IL1RN, NFKκB1, NOS2, and ITGB2 (Fig. 5A) was observed. In the group 2 AD patients, a significant and potent increase in the mRNA levels of the receptors IL1R1, C3, TLR2, and C3AR1, and down regulation in CXCL10, were observed (Fig. 5C). In this pilot study, all AD patients in both groups showed characteristic upregulation of IL1RN, ITGB2, and NFκB and down regulation of CCL2, CCL7, CCR1, and IL6R when compared to controls (Fig. 5D). If confirmed in a larger study, this pattern could be useful as a biomarker for sporadic AD, as well as a potential tool for personalized medical/nutritional approaches.
Figure 5.
Two profiles in the baseline transcription of inflammatory and autoimmune genes observed in PBMCs of AD patients when compared to control subjects. A) A volcano plot demonstrating the fold regulation change and statistics observed when the baseline transcription of eighty four genes (PAHS077G RT2-Profiler array, Qiagen) from group 1 AD (n=3, two patients) and control (n=3, three controls) were compared. For this comparison all five housekeeping genes were used for normalization. In the plot, data points to the left of the center line designate down regulated mRNA expression and those to the right up regulated expression. The vertical lines to the left and right of the center line, highlight a 4-fold regulation change threshold. The horizontal line represents a p-value of 0.05. B) A volcano plot demonstrating the fold regulation change and statistics observed when the baseline transcription of eighty four genes (PAHS077G RT2-Profiler array, Qiagen) from group 2 AD (n=6, three patients) and control (n=3, three controls) were compared. For this comparison all five housekeeping genes were used for normalization. C) A simplified volcano plot showing only the genes whose baseline transcription was statistically different when group 2 AD (n=6) and group 1 (n=3) samples were compared. D) A simplified volcano plot showing only the genes whose baseline transcription was statistically different when all AD samples (n=9) and control (n=3) samples were compared.
Figure 4.
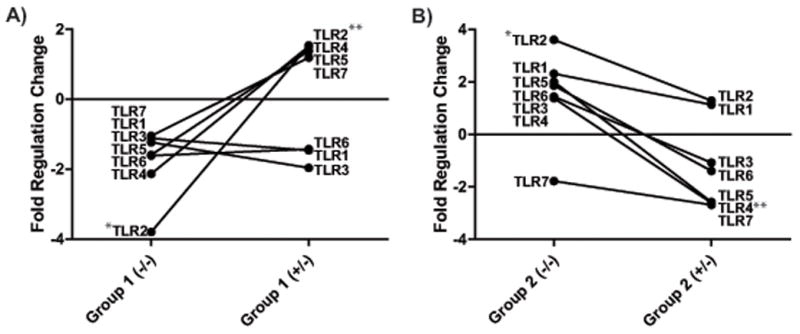
Differential TLR mRNA expression in the Group 1 and Group 2 AD PBMCs at baseline and upon stimulation with exogenous sAβ. Patients 4 and 5 (Group 1, A) showed significant down regulation of TLR2 (*p<0.01), while patients 1, 2, and 3 (Group 2, B) showed significant up regulation (*p<0.01) at baseline (−/−) when compared to controls (n=3). The effect of exogenous sAβ (+/−, 2μg/ml) was significant in upregulating TLR2 (**p<0.01) in Group 1 AD and down regulating TLR4 (**p<0.01) in Group 2 AD patients.
Inflammatory gene transcription is up regulated by Aβ42 in controls and patients from both groups
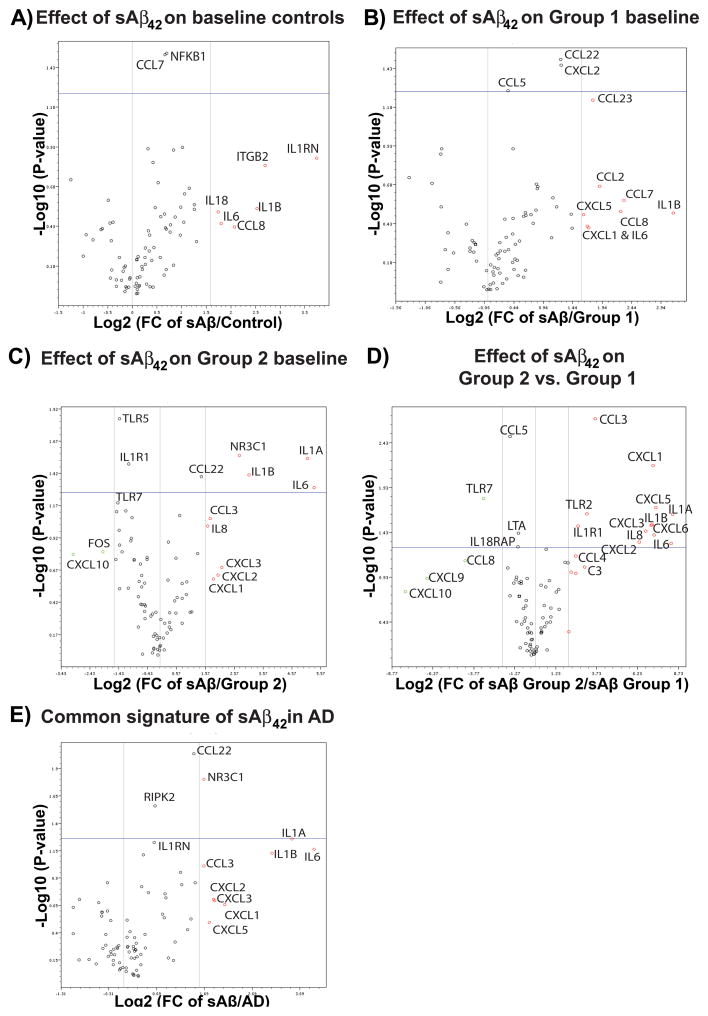
In PBMCs of controls challenged with exogenous sAβ42, a consistent enhancement in the expression of inflammatory and autoimmune genes was observed (upregulation of IL1RN, ITGB2, IL1β, CCL7 (p<0.05), CCL8, IL6, IL18, and NFKB1 (p<0.05) (Fig. 6A). In the group 1 PBMCs, sAβ42 increased the transcription of the chemokines CCL2, CCL5 (p<0.03), CCL7, CCL8, CCL22 (p<0.05), CCL23, CXCL1, and CXCL2 (p<0.01), and the cytokines IL1β and IL6 (Fig. 6B). The majority of chemokines and cytokines up regulated in response to exogenous sAβ in group 1 were commonly up regulated by sAβ in group 2 AD PBMCs. In addition, a significant upregulation of IL1α and the nuclear glucocorticoid receptor (GR, a.k.a. NR3C1) and down regulation of TLR5, TLR7, IL1R1, FOS, and CXCL10 were also induced by sAβ in group 2 AD PBMCs (Fig. 6C). Altogether, controls and AD PBMCs responded to exogenous addition of sAβ by upregulating IL1β and IL6 (compare Figs. 6A–C), but group 2 AD patients showed the most severe pro-inflammatory response, with significant upregulation of IL1R1, IL1α/β, IL6, TLR2, and chemokines, and down regulation of TLR7 and CCL5 when compared to group 1 (Fig. 6D). When groups 1 and 2 were combined and compared to controls, a significant increase in the GR, CCL22, RIPK2, and IL1α, and near significant increase in IL1RN, IL1β, and IL6 were observed (Fig. 6E).
Figure 6.
Soluble Aβ upregulates the transcription of inflammatory and autoimmune genes more so in AD patients than in controls. A) A volcano plot demonstrating the fold regulation change and statistics observed when controls (n=3, three control subjects) were treated overnight with 2 μg/ml soluble Aβ42 (sAβ42) and the qPCR results compared to the baseline transcription of 84 genes (PAHS077G RT2-Profiler array, Qiagen) from the same PBMC isolation. The vertical lines to the left and right of the center line highlight a 4-fold regulation change threshold. The horizontal line represents a p-value of 0.05. For genes labeled above the line the fold regulation change was significant across the sample population. B) A volcano plot demonstrating the fold regulation change (≥ 4-fold) and statistics (p<0.05) observed when group 1 AD patient PBMCs (n=3, two patients) were treated overnight with 2 μg/ml sAβ42 and the qPCR results compared to the baseline transcription from the same PBMC isolation. For this comparison three housekeeping genes were used for normalization. A comparison of group 1 AD and control sAβ42-treated PBMCs is provided in Supplementary Figure 2A. C) A volcano plot demonstrating the fold regulation change (≥ 4-fold) and statistics (p<0.05) observed when group 2 AD PBMCs (n=5, three patients) were treated overnight with 2 μg/ml sAβ42 and the qPCR results compared to the baseline transcription from the same PBMC isolation. For this comparison all five housekeeping genes were used for normalization. A comparison of group 2 AD and control sAβ42-treated PBMCs is provided in Supplementary Figure 2B. D) A volcano plot demonstrating the fold regulation change (≥ 4-fold) and statistics (p<0.05) observed when group 2 AD (n=5, three patients) and group 1AD (n=3, two patients) sAβ42-treated PBMCs were compared. For this comparison all three housekeeping genes were used for normalization. E) A volcano plot demonstrating the general up regulatory effect of exogenous sAβ42 on the expression of inflammatory and autoimmune genes across all AD patients (n = 6, three from each group) when compared to sAβ42-treated PBMC samples from controls (n=3). For this comparison three housekeeping genes were used for normalization.
In a group 2 AD patients PBMCs tested on three different occasions, the effect of fAβ42 was observed to be more potent when compared to sAβ42 (see heat map, Supplementary Fig. 2C). Soluble Aβ42 upregulated the expression of many nuclear receptors (NRs) and co-regulators (e.g., RORα, RXRα, PPARα, RBJ, VDR, PPARγ, MED1, and MED13 (Supplementary Fig. 2D) in the group 2 patients PBMCs. While it is too early to provide definitive links between cytokine and NR gene expression fold regulation changes, the fact that IL6 promotes the expression of RORα [30] is supported by the RT-PCR results that showed these two genes were the most upregulated by sAβ in the group 2 patient (Supplementary Figs. 2B and D).
RvD1 and 1,25D3 retune the inflammatory gene transcription and translation altered by sAβ in group-specific fashion
We next tested the effects of the two pro-phagocytic agents, RvD1 (26 nM) and 1,25D3 (10 nM), on inflammatory chemokine and cytokine expression in PBMCs of controls and AD patients treated with sAβ42.
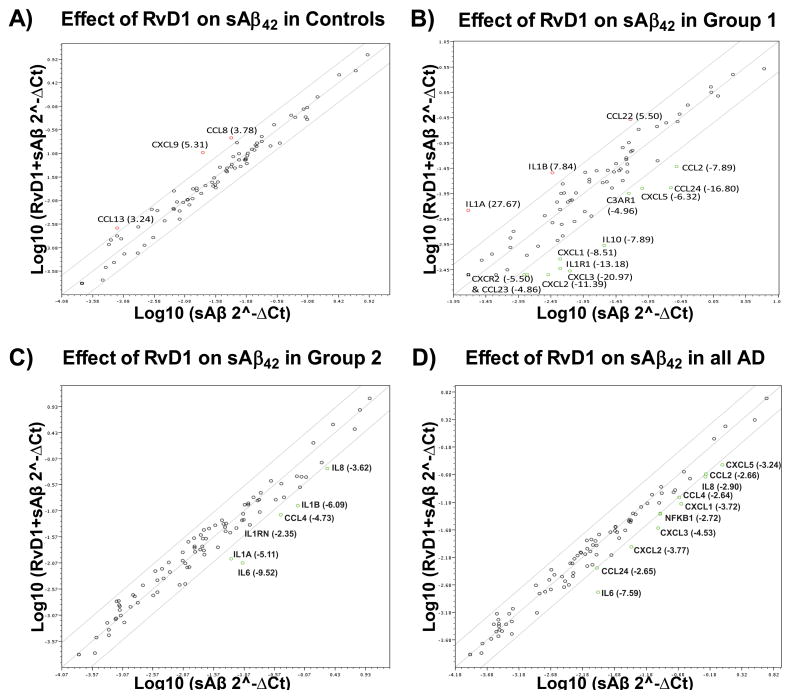
Although RvD1 showed virtually no effect in controls (Fig. 7A), in the group 1 AD patients RvD1 upregulated IL1α and IL1β (Fig. 7B) and down regulated nearly all of the chemokines that were upregulated by sAβ (cf. Figs. 6B & 7B). In the group 2 AD PBMCs, RvD1 down regulated the cytokines IL1α, IL1β, IL6, and IL8, the IL1 receptor antagonist (IL1RN), and the chemokine CCL4 (Fig. 7C), but did not down regulate the same suite of chemokines down regulated in the group 1 AD patients (cf. Figs. 6B & 7C). When both groups were combined, a global down regulation of inflammatory and autoimmune genes by RvD1 was observed (Fig. 7D). Finally, in a group 2 AD patient, RvD1 did not significantly down regulate the potent up regulation of NRs and co-regulators by sAβ42 (Supplementary Fig. 3B) and had no significant impact on inflammatory gene expression potently up regulated by fAβ (Supplementary Fig. 3C).
Figure 7.
RvD1 retunes the transcription of inflammatory and autoimmune genes whose transcription was altered by sAβ42. A) A scatter plot showing the fold regulation change in the transcription of eighty four genes (PAHS077G RT2-Profiler array, Qiagen) following overnight treatment of control PBMCs with sAβ42 and sAβ42 + 26.0 nM RvD1 (n=2 for both groups). Genes up or down regulated more than 2.6-fold are labeled and the average fold regulation change provided in the figure panel. B) A scatter plot showing the fold regulation change in the transcription of genes following overnight treatment of group 1 PBMCs with sAβ42 and sAβ42 + 26.0 nM RvD1 (n=2 for both groups, one sample from two AD patients). Genes up or down regulated more than 4.0-fold are labeled and the average fold regulation change provided in the figure panel. C) A scatter plot showing the fold regulation change in the transcription of genes following overnight treatment of group PBMCs with sAβ42 and sAβ42 + 26.0 nM RvD1 (n=5 for both treatments, two group 2 patients). Genes up or down regulated more than 2.6-fold are labeled and the average fold regulation change provided in the figure panel. A volcano plot demonstrating the effect of RvD1 observed in one group 2 AD patient is provided in Supplementary Figure 3A. D) A scatter plot showing the fold regulation change in the transcription of the eighty four genes following overnight treatment of all AD patient PBMCs with sAβ42 or sAβ42 + 26.0 nM RvD1 (n=6 for both groups). Genes up or down regulated more than 2.6-fold are labeled and the average fold regulation change provided in the figure panel.
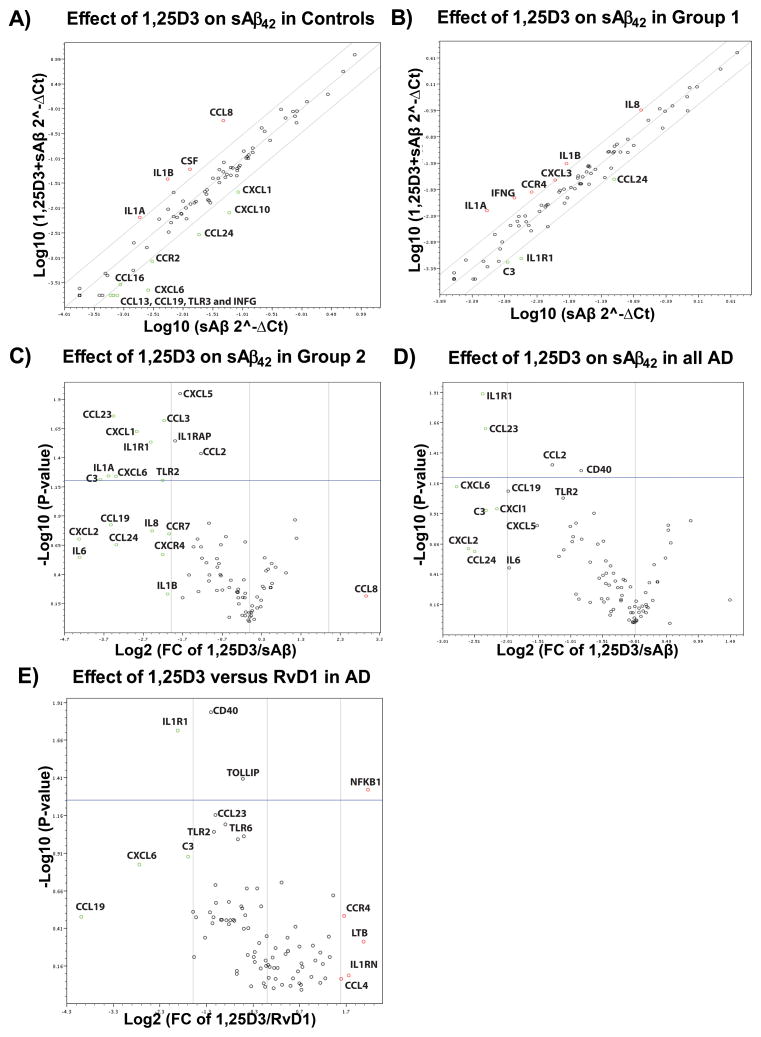
1,25D3 (10−8M) upregulated the expression of IL1α, IL1β, CSF, and CCL8, and down regulated the expression of eight chemokine ligand/receptor genes, and TLR3 and IFNγ in controls (Fig. 8A). In the group 1 patients, the mRNA levels of the cytokines IL1α, IL1β, and IL8, and IFNG, and chemokine ligand/receptor genes CXCL3 and CCR4 were enhanced by 1,25D3 (Fig. 8B). In the group 2 AD PBMCs, 1,25D3 significantly down regulated the expression of many inflammatory and autoimmune genes, including TLR2, IL1R1, IL1α, IL6, and IL8 (Fig. 8C).
Figure 8.
1,25D3 retunes the transcription of inflammatory and autoimmune genes whose transcription was altered by sAβ42. A) A scatter plot showing the fold regulation change in the transcription of eighty four genes (PAHS077G RT2-Profiler array, Qiagen) following overnight treatment of control PBMCs with sAβ42 and sAβ42 + 10.0 nM 1,25D3 (n=2 for both groups). Genes up or down regulated more than 4-fold are labeled in the figure panel. B) A scatter plot showing the fold regulation change in the transcription of genes following overnight treatment of group 1 PBMCs with sAβ42 and sAβ42 + 10.0 nM 1,25D3 (n=2 for both groups, one sample from two AD patients). Genes up or down regulated more than 4.0-fold are labeled in the figure panel. C) A volcano plot demonstrating the fold regulation change (≥ 4-fold) and statistics (p<0.05) observed when group 2 AD PBMCs (n=4, two patients) were treated overnight with 2 μg/ml sAβ42 + 10.0 nM 1,25D3 and the qPCR results compared to those following sAβ42-treatment of PBMCs isolated from the same blood draw. D) A volcano plot demonstrating the fold regulation change (≥ 4-fold) and statistics (p<0.05) observed when all AD PBMCs (n=6, four patients) were treated overnight with 2 μg/ml sAβ42 + 10.0 nM 1,25D3 and the qPCR results compared to transcription of eighty four genes (PAHS077G RT2-Profiler array, Qiagen) following sAβ42-treatment of PBMCs isolated from the same blood draw. E) A volcano plot demonstrating the fold regulation change (≥ 4-fold) and statistics (p<0.05) observed when all AD PBMCs (two group 1 and two group 2 AD patients) were treated overnight with 2 μg/ml sAβ42 + 10.0 nM 1,25D3 (n=6) or + 26.0 nM RvD1 (n=6) and the qPCR results compared. The plot shows how 1,25D3 differs from RvD1 (e.g., IL1R1 is down regulated more by 1,25D3 across the AD patient population then it is by RvD1).
In general, 1,25D3 had a more pronounced effect on cytokines and chemokines when compared to RvD1 (Supplementary Fig. 4A) and unlike RvD1, 1,25D3 significantly down regulated IL1R1, CCL23, CCL2, and CD40 in all AD patients (Fig. 8D). Alternatively, in comparison to RvD1 (26 nM), 1,25D3 was less effective in suppressing the transcription of NFκB (Fig. 8E). Despite these distinct differences, in the group 1 both 1,25D3 and RvD1 induced a greater than 4-fold upregulation IL1α/β and down regulation of CCL24 and IL1R1; and in the group 2 both induced a greater than 4-fold down regulation of IL1α/β and IL6 and a concomitant decrease in the expression of a number of nuclear receptors and co-regulators (compare Supplementary Figs. 3B & 4B).
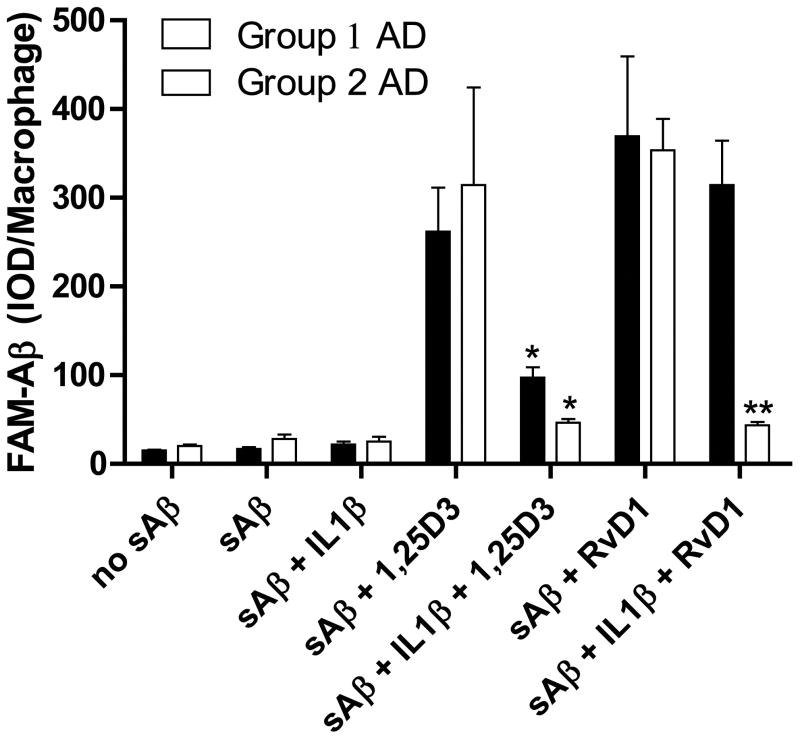
Because the mRNA level of IL1R1 was down regulated in group 1 at baseline (Fig. 5A), following sAβ and both RvD1 and 1,25D3 caused an increase and decrease in IL1β expression in group 1 and group 2 AD patients respectively, we next tested the effects of IL1β on Aβ phagocytosis, before treatment with 1,25D3 or RvD1. The enhancement of Aβ phagocytosis by 1,25D3 was significantly inhibited by IL1β pretreatment in both the group 1 and 2 patients. The effect of RvD1 was, however, not attenuated by IL1β in a group 1 patient (Fig. 9), who showed baseline down regulation of the IL1 receptor (IL1R1, see Figs. 5A, 6C & 6D).
Figure 9.
The cytokine IL1β inhibits the action of 1,25D3 and RvD1 on Aβ phagocytosis. Replicate macrophage cultures were pre-treated with 1,25D3 (10−8M) or RvD1 (26.0 nM) with or without IL1β (2.5 μg/ml) and then exposed to 2 μg/ml FAM-Aβ overnight. Data are presented as mean ± STD IOD per macrophage (n=4; *p<0.01 compared to sAβ-treated group; **p<0.001 compared to sAβ-treated group).
Soluble Aβ stimulation of cytokine secretion and cytokine secretion is inhibition by 1,25D3 and RvD1
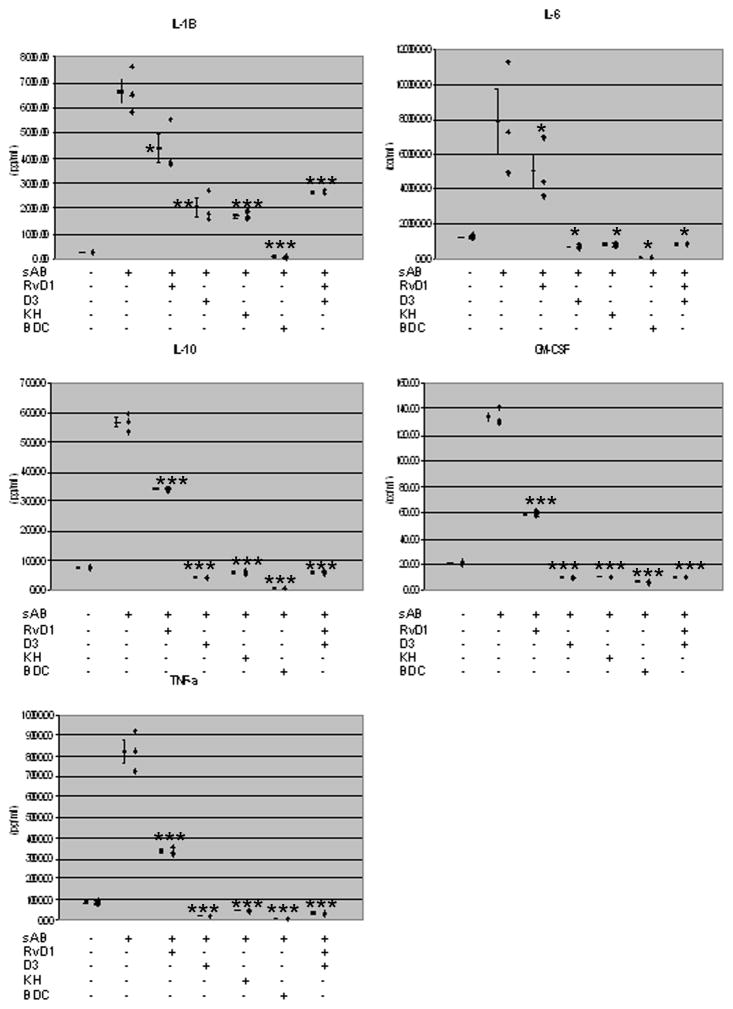
The effect of 1,25D3 and RvD1 on cytokine secretion was tested with PBMCs isolated from patient # 1, group 2 (Fig. 10). Stimulation with sAβ42 increased the secretion of IL1β, IL6, IL10, GMCSF, and TNFα. Both RvD1 and 1,25D3 inhibited these cytokines with greater effect by 1,25D3 (10-8M) (p<0.02 with all these cytokines) compared to RvD1 (26 nM). The VDR agonist and analogue KH [31] had a similar effect in inhibiting these cytokines in comparison to 1,25D3 (Fig. 10), indicating that the nuclear VDR plays a role in suppressing cytokine secretion.
Figure 10.
RvD1 and 1,25D3 inhibit the secretion of inflammatory cytokines from PBMCs of a group 2 patient stimulated by sAβ. Three million PBMC’s were treated overnight with sAβ42 ± 10.0 nM 1,25D3 or 26.0 nM RvD1. The supernatants were harvested and the cytokines were tested by ELISA. * indicates significance (p<0.02) when compared to sham (AD); ** indicates significance when compared to fAβ control and sham (p<0.0001); and *** indicates significance when compared to AD fAβ-treated macrophages (p<0.0001) according to a two-tailed t-test (n=3).
DISCUSSION
AD macrophages in our previous studies [11, 12] and this study (n = 73) showed decreased phagocytosis of FAM-Aβ in comparison to macrophages of healthy age-matched controls [12]. Here we show that 1,25D3 and RvD1 ameliorate this defect through binding to different receptors, VDR and PDIA3 in case of 1,25D3, and GPR32 in case of RvD1. The in vitro effects were concentration-dependent and depended on MAPK, PI3-kinase and calcium signaling. Intracellular signaling pathways that were shown previously to be stimulated by 1,25D3 in promoting FAM-Aβ phagocytosis through both up regulating the expression and potentiating the opening of the chloride channel, ClC-3 [32].
AD mononuclear cells show propensity to undergo spontaneous apoptosis [33] and Aβ-induced apoptosis [13]. In this study, AD patients’ macrophages, but not control macrophages, underwent apoptosis in the presence of fAβ. 1,25D3 and RvD1 both were shown to protect against activation of caspase-3 in AD macrophages by fAβ and sAβ. The relative roles of sAβ versus fAβ in AD pathogenesis remain unclear. Current working hypotheses have emphasized oligomeric forms of sAβ as the most important neurotoxins [34]. However, imaging studies have shown clearly that the formation and deposition of Aβ fibrils can be a reliable indicator of prodromal AD 15–20 years prior to the development of clinical symptoms [35]. Here we show that fAβ and sAβ immune effects differ in AD macrophages because (a) fAβ is more pro-apoptotic compared to sAβ; and (b) fAβ is more pro-inflammatory than sAβ.
In this case study, the AD patients showed two baseline expression profiles of inflammatory genes with respect to controls: in the group 1 a lower level of TLR, IL1R1, IL1α/β, and in the group 2 a higher level of expression of these pro-inflammatory factors. In response to sAβ, the TLR and IL1R1 expression patterns were reversed in group 1 and group 2 AD PBMCs when compared to controls (see Fig. 4). The TLR results of patients in groups 1 and 2 resemble the reciprocal MGAT3 mRNA levels of Type I (down regulated transcription) and Type II AD patients (upregulated transcription) [12, 36]. The TLR results and the differential effect of IL1β in group 1 and group 2 patients thus further support the evidence that AD patients differ somewhat in the cellular pathways that are deregulated attenuating the ability of macrophages to properly ingest and clear sAβ. Further studies are required to discern whether or not the AD groups represent two stages of the disease or two types of AD.
Inflammatory gene transcriptional profiling of all 5 AD patients in this pilot study showed a putative seven gene baseline “AD signature” when compared to controls; however, a more pro-inflammatory milieu was observed in the group 2 AD patients. Exogenous addition of sAβ elicited in controls, group 1 and group 2 AD PBMCs an upregulation in the expression of IL1β and IL6; however, a pro-inflammatory milieu was more pronounced in response to sAβ in the AD patients, group 2 more so than group 1. For example, IL1α was induced by sAβ in group 2, but not group 1, AD PBMCs. Based on the screening of 84 genes, the upregulation of C3, C3AR1, TLR2, and IL1R1 at baseline in the group 2 PBMCs could underpin sAβ’s more potent induction of pro-inflammatory markers, given TLR2/TLR4 functions as a cell surface receptor complex for sAβ [37] and the other receptors (C3, C3AR1, and IL1R1) promote inflammation.
The transcriptional responses of cytokines and chemokines to 1,25D3 and RvD1 differed in the two groups in the direction of reversal to control levels. For example, upregulation of inflammatory cytokines by 1,25D3 and RvD1 was shown in the group 1 patients, but down regulation of IL1α and IL1β in the group 2 patients. The details of this regulation differed between 1,25D3 and RvD1. For example, 1,25D3 inhibited inflammatory gene transcription and TLR2, while RvD1 did not down regulate TLR2 in the group 2. RvD1 also had a broader effect on inflammatory gene transcription in the group 1 when compared to 1,25D3. In agreement with 1,25D3 showing a more pronounced down regulation in the transcription of cytokines, 1,25D3 inhibited cytokine secretion from the group 2 PBMCs more so than RvD1.
IL1β is a pivotal cytokine in AD brain [23]. IL1β stimulates downstream cytokines, chemokines and their receptors in response to insults such as trauma and ischemia. IL1β also drives the expression of the monocyte chemoattractant protein-1 (CCL2) responsible for attraction of monocytes into the brain. In a rat model, IL1β increased apolipoprotein E and AβPP promoting glial activation and pro-inflammatory milieu [38]. IL1β antibody reduced inflammation and Aβ in a transgenic mouse model [39]. In our study the cytokine IL1β had strongest inhibitory effect on RvD1 and 1,25D3-induced Aβ phagocytosis in group 2 more than in group 1 patients, but it did not block the pro-phagocytic effect of RvD1 in the group 1 patient. Importantly, group 1 PBMCs were observed to have a more than 30-fold down regulation in the baseline expression of IL1R1 when compared to the group 2 PBMCs. Furthermore, RvD1, but not 1,25D3, down regulates NFκB (a downstream component of IL1R1 activation) expression in the group 1 PBMCs. These two results indicate that RvD1 may work better in this individual against exogenous IL1β because of the reduced sensitivity of the group 1 macrophages to IL1β and the ability of RvD1 to curtail downstream IL1β-IL1R1 promotion of NFκB activation. Collectively, our data suggest that deregulation in the transcriptional regulation of and/or haplotypes in the IL1R1-IL1A-IL1B-IL1RN gene cluster [40] could play an important group-specific role in AD pathophysiology.
In closing, 25-hydroxyvitamin D3 status is considered crucial in protection against a panoply of infectious, autoimmune, and neoplastic diseases [41]. 1,25D3 is neuroprotective in the brain by regulating neurotrophic factors [42] and upregulating VDR and down regulating L-type voltage sensitive calcium channels A1C [19]. Resolvins and neuroprotectins, derived from the omega-3 fatty acid, DHA, down regulate β-secretase-1 [43]. Furthermore, supplementation with vitamin D3 and DHA has been effective against cognitive decline in healthy subjects [44]. Thus, our in vitro studies in AD PBMCs and macrophages, which demonstrate the ability of 1,25D3 and RvD1 to balance Aβ phagocytosis and inflammation, combined with the above cited effects of 1,25D3 and RvD1 on neuronal cells and AD patients, suggest that vitamin D3 and DHA nutritional status and/or metabolic processing into 1,25D3 and RvD1 could be associated with disease onset/prevention. It is also possible that the two inflammatory AD groups and/or Types may be associated with severity of nutritional and/or metabolic deficiencies in vitamin D3 versus DHA. Nonetheless, targeting both inflammation and macrophage dysfunction present a novel strategy for AD prevention and treatment.
Supplementary Material
Supplementary Figure 1. 1,25D3 and RvD1 recover Aβ phagocytosis by macrophages of AD patients. The pictures obtained following the treatment of AD macrophages from the five AD patients and a control subject with FAM-Aβ and the effect of 1,25D3 and RvD1 on binding and uptake of FAM-Aβ (green). The cytoskeleton in each figure panel is stained red and the nucleus blue.
Supplementary Figure 2. Effects of exogenous sAβ and fAβ on the expression of inflammatory and autoimmune genes in AD patients and controls. A) A volcano plot demonstrates the effects of sAβ in the group 1 patient 1 PBMCs (n=3) compared to control PBMCs (n=3). B) A volcano plot demonstrates how group 2 AD PBMCs (n=3) treated with sAβ compared to control PBMCs treated with sAβ (n=3). C) Scatter plot and heat map of the greater pro-inflammatory effect of 2 μg/ml fAβ (n=3) in group 1 AD PBMCs when compared to 2 μg/ml sAβ (n=3). D) Effect of sAβ on the baseline expression of nuclear receptors and transcriptional co-regulators in group 1 AD PBMCs (n=2).
Supplementary Figure 3. Effects of RvD1 on transcription in group 2 AD, patient 1. A) A volcano plot demonstrating that RvD1 significantly down regulated the expression of a number of different cytokines up regulated by sAβ in patient 1 (n=3), a group 2 AD patient (Table 1). B) Scatter plot demonstrating that 26 nM RvD1 does not down regulate the transcription of nuclear receptors and co-regulators stimulated by exogenous sAβ. C) A volcano plot demonstrating the impact of co-incubating PBMCs overnight with fAβ.on the effect of RvD1 in patient 1 PBMCs.
Supplementary Figure 4. Effects of 1,25D3 on transcription in group 2 AD, patient 1. A) A heat map demonstrating that 1,25D3 has a more potent down regulatory effect when compared to RvD1 in PBMCs co-incubated with sAβ patient 1 (n=2 for each group). The array layout for the heat map is provided under the figure panels. B) Scatter plot that demonstrates the effect 10 nM 1,25D3 has on the transcription of nuclear receptors and co-regulators when co-incubated with sAβ.
Acknowledgments
This work was supported by grants from Alzheimer’s Association (M.F.) and the National Institutes of Health (R01 NS38328 and R01 AG041295, both to D.T.).
Footnotes
Supplementary data available online: http://www.j-alz.com/issues/34/vol34-1.html#supplementarydata02
Authors’ disclosures available online (http://www.j-alz.com/disclosures/view.php?id=1551).
References
- 1.Hardy J, Selkoe DJ. The amyloid hypothesis of Alzheimer’s disease: progress and problems on the road to therapeutics. Science. 2002;297:353–356. doi: 10.1126/science.1072994. [DOI] [PubMed] [Google Scholar]
- 2.Wyss-Coray T, Rogers J. Inflammation in Alzheimer disease-a brief review of the basic science and clinical literature. Cold Spring Harb Perspect Med. 2012;2:a006346. doi: 10.1101/cshperspect.a006346. [DOI] [PMC free article] [PubMed] [Google Scholar]
- 3.Mawuenyega KG, Sigurdson W, Ovod V, Munsell L, Kasten T, Morris JC, Yarasheski KE, Bateman RJ. Decreased clearance of CNS beta-amyloid in Alzheimer’s disease. Science. 2010;330:1774. doi: 10.1126/science.1197623. [DOI] [PMC free article] [PubMed] [Google Scholar]
- 4.Sagare AP, Bell RD, Zlokovic BV. Neurovascular defects and faulty amyloid-beta vascular clearance in Alzheimer’s disease. J Alzheimers Dis. 2012 doi: 10.3233/JAD-2012-129037. [DOI] [PMC free article] [PubMed] [Google Scholar]
- 5.Tanzi RE, Moir RD, Wagner SL. Clearance of Alzheimer’s Abeta peptide: the many roads to perdition. Neuron. 2004;43:605–608. doi: 10.1016/j.neuron.2004.08.024. [DOI] [PubMed] [Google Scholar]
- 6.Miners JS, Baig S, Palmer J, Palmer LE, Kehoe PG, Love S. Abeta-degrading enzymes in Alzheimer’s disease. Brain Pathol. 2008;18:240–252. doi: 10.1111/j.1750-3639.2008.00132.x. [DOI] [PMC free article] [PubMed] [Google Scholar]
- 7.Bard F, Cannon C, Barbour R, Burke RL, Games D, Grajeda H, Guido T, Hu K, Huang J, Johnson-Wood K, Khan K, Kholodenko D, Lee M, Lieberburg I, Motter R, Nguyen M, Soriano F, Vasquez N, Weiss K, Welch B, Seubert P, Schenk D, Yednock T. Peripherally administered antibodies against amyloid beta-peptide enter the central nervous system and reduce pathology in a mouse model of Alzheimer disease. Nat Med. 2000;6:916–919. doi: 10.1038/78682. [DOI] [PubMed] [Google Scholar]
- 8.Selkoe DJ. Resolving controversies on the path to Alzheimer’s therapeutics. Nat Med. 2011;17:1060–1065. doi: 10.1038/nm.2460. [DOI] [PubMed] [Google Scholar]
- 9.Patton RL, Kalback WM, Esh CL, Kokjohn TA, Van Vickle GD, Luehrs DC, Kuo YM, Lopez J, Brune D, Ferrer I, Masliah E, Newel AJ, Beach TG, Castano EM, Roher AE. Amyloid-beta peptide remnants in AN-1792-immunized Alzheimer’s disease patients: a biochemical analysis. Am J Pathol. 2006;169:1048–1063. doi: 10.2353/ajpath.2006.060269. [DOI] [PMC free article] [PubMed] [Google Scholar]
- 10.Schnabel J. Vaccines: chasing the dream. Nature. 2011;475:S18–19. doi: 10.1038/475S18a. [DOI] [PubMed] [Google Scholar]
- 11.Fiala M, Liu PT, Espinosa-Jeffrey A, Rosenthal MJ, Bernard G, Ringman JM, Sayre J, Zhang L, Zaghi J, Dejbakhsh S, Chiang B, Hui J, Mahanian M, Baghaee A, Hong P, Cashman J. Innate immunity and transcription of MGAT-III and Toll-like receptors in Alzheimer’s disease patients are improved by bisdemethoxycurcumin. Proc Natl Acad Sci U S A. 2007;104:12849–12854. doi: 10.1073/pnas.0701267104. [DOI] [PMC free article] [PubMed] [Google Scholar]
- 12.Avagyan H, Goldenson B, Tse E, Masoumi A, Porter V, Wiedau-Pazos M, Sayre J, Ong R, Mahanian M, Koo P, Bae S, Micic M, Liu PT, Rosenthal MJ, Fiala M. Immune blood biomarkers of Alzheimer disease patients. J Neuroimmunol. 2009;210:67–72. doi: 10.1016/j.jneuroim.2009.02.015. [DOI] [PubMed] [Google Scholar]
- 13.Zaghi J, Goldenson B, Inayathullah M, Lossinsky AS, Masoumi A, Avagyan H, Mahanian M, Bernas M, Weinand M, Rosenthal MJ, Espinosa-Jeffrey A, de Vellis J, Teplow DB, Fiala M. Alzheimer disease macrophages shuttle amyloid-beta from neurons to vessels, contributing to amyloid angiopathy. Acta Neuropathol. 2009;117:111–124. doi: 10.1007/s00401-008-0481-0. [DOI] [PMC free article] [PubMed] [Google Scholar]
- 14.Masoumi A, Goldenson B, Ghirmai S, Avagyan H, Zaghi J, Abel K, Zheng X, Espinosa-Jeffrey A, Mahanian M, Liu PT, Hewison M, Mizwicki M, Cashman J, Fiala M. 1alpha,25-dihydroxyvitamin D3 interacts with curcuminoids to stimulate amyloid-beta clearance by macrophages of Alzheimer’s disease patients. J Alzheimers Dis. 2009;17:703–717. doi: 10.3233/JAD-2009-1080. [DOI] [PubMed] [Google Scholar]
- 15.Serhan CN, Hong S, Gronert K, Colgan SP, Devchand PR, Mirick G, Moussignac RL. Resolvins: a family of bioactive products of omega-3 fatty acid transformation circuits initiated by aspirin treatment that counter proinflammation signals. J Exp Med. 2002;196:1025–1037. doi: 10.1084/jem.20020760. [DOI] [PMC free article] [PubMed] [Google Scholar]
- 16.Bazan NG, Molina MF, Gordon WC. Docosahexaenoic Acid signalolipidomics in nutrition: significance in aging, neuroinflammation, macular degeneration, Alzheimer’s, and other neurodegenerative diseases. Annu Rev Nutr. 2011;31:321–351. doi: 10.1146/annurev.nutr.012809.104635. [DOI] [PMC free article] [PubMed] [Google Scholar]
- 17.Menegaz D, Mizwicki MT, Barrientos-Duran A, Chen N, Henry HL, Norman AW. Vitamin D receptor (VDR) regulation of voltage-gated chloride channels by ligands preferring a VDR-alternative pocket (VDR-AP) Mol Endocrinol. 2011;25:1289–1300. doi: 10.1210/me.2010-0442. [DOI] [PMC free article] [PubMed] [Google Scholar]
- 18.Mizwicki MT, Norman AW. The vitamin D sterol-vitamin D receptor ensemble model offers unique insights into both genomic and rapid-response signaling. Sci Signal. 2009;2:re4. doi: 10.1126/scisignal.275re4. [DOI] [PubMed] [Google Scholar]
- 19.Dursun E, Gezen-Ak D, Yilmazer S. A novel perspective for Alzheimer’s disease: vitamin D receptor suppression by amyloid-beta and preventing the amyloid-beta induced alterations by vitamin D in cortical neurons. J Alzheimers Dis. 2011;23:207–219. doi: 10.3233/JAD-2010-101377. [DOI] [PubMed] [Google Scholar]
- 20.Akiyama H, Barger S, Barnum S, Bradt B, Bauer J, Cole GM, Cooper NR, Eikelenboom P, Emmerling M, Fiebich BL, Finch CE, Frautschy S, Griffin WS, Hampel H, Hull M, Landreth G, Lue L, Mrak R, Mackenzie IR, McGeer PL, O’Banion MK, Pachter J, Pasinetti G, Plata-Salaman C, Rogers J, Rydel R, Shen Y, Streit W, Strohmeyer R, Tooyoma I, Van Muiswinkel FL, Veerhuis R, Walker D, Webster S, Wegrzyniak B, Wenk G, Wyss-Coray T. Inflammation and Alzheimer’s disease. Neurobiol Aging. 2000;21:383–421. doi: 10.1016/s0197-4580(00)00124-x. [DOI] [PMC free article] [PubMed] [Google Scholar]
- 21.McCoy MK, Martinez TN, Ruhn KA, Szymkowski DE, Smith CG, Botterman BR, Tansey KE, Tansey MG. Blocking soluble tumor necrosis factor signaling with dominant-negative tumor necrosis factor inhibitor attenuates loss of dopaminergic neurons in models of Parkinson’s disease. J Neurosci. 2006;26:9365–9375. doi: 10.1523/JNEUROSCI.1504-06.2006. [DOI] [PMC free article] [PubMed] [Google Scholar]
- 22.Scheller J, Chalaris A, Schmidt-Arras D, Rose-John S. The pro- and anti-inflammatory properties of the cytokine interleukin-6. Biochim Biophys Acta. 2011;1813:878–888. doi: 10.1016/j.bbamcr.2011.01.034. [DOI] [PubMed] [Google Scholar]
- 23.Shaftel SS, Griffin WS, O’Banion MK. The role of interleukin-1 in neuroinflammation and Alzheimer disease: an evolving perspective. J Neuroinflammation. 2008;5:7. doi: 10.1186/1742-2094-5-7. [DOI] [PMC free article] [PubMed] [Google Scholar]
- 24.McKhann G, Drachman D, Folstein M, Katzman R, Price D, Stadlan EM. Clinical diagnosis of Alzheimer’s disease: report of the NINCDS-ADRDA Work Group under the auspices of Department of Health and Human Services Task Force on Alzheimer’s Disease. Neurology. 1984;34:939–944. doi: 10.1212/wnl.34.7.939. [DOI] [PubMed] [Google Scholar]
- 25.Sequeira VB, Rybchyn MS, Tongkao-On W, Gordon-Thomson C, Malloy PJ, Nemere I, Norman AW, Reeve VE, Halliday GM, Feldman D, Mason RS. The role of the vitamin D receptor and ERp57 in photoprotection by 1alpha,25-dDihydroxyvitamin D3. Mol Endocrinol. 2012;26:574–582. doi: 10.1210/me.2011-1161. [DOI] [PMC free article] [PubMed] [Google Scholar]
- 26.Maji SK, Ogorzalek Loo RR, Inayathullah M, Spring SM, Vollers SS, Condron MM, Bitan G, Loo JA, Teplow DB. Amino acid position-specific contributions to amyloid beta-protein oligomerization. J Biol Chem. 2009;284:23580–23591. doi: 10.1074/jbc.M109.038133. [DOI] [PMC free article] [PubMed] [Google Scholar]
- 27.Walsh DM, Hartley DM, Kusumoto Y, Fezoui Y, Condron MM, Lomakin A, Benedek GB, Selkoe DJ, Teplow DB. Amyloid beta-protein fibrillogenesis. Structure and biological activity of protofibrillar intermediates. J Biol Chem. 1999;274:25945–25952. doi: 10.1074/jbc.274.36.25945. [DOI] [PubMed] [Google Scholar]
- 28.Krishnamoorthy S, Recchiuti A, Chiang N, Yacoubian S, Lee CH, Yang R, Petasis NA, Serhan CN. Resolvin D1 binds human phagocytes with evidence for proresolving receptors. Proc Natl Acad Sci U S A. 2010;107:1660–1665. doi: 10.1073/pnas.0907342107. [DOI] [PMC free article] [PubMed] [Google Scholar]
- 29.Mizwicki MT, Menegaz D, Zhang J, Barrientos-Duran A, Tse S, Cashman JR, Griffin PR, Fiala M. Genomic and nongenomic signaling induced by 1alpha,25(OH)2-vitamin D3 promotes the recovery of amyloid-beta phagocytosis by Alzheimer’s disease macrophages. J Alzheimers Dis. 2012;29:51–62. doi: 10.3233/JAD-2012-110560. [DOI] [PubMed] [Google Scholar]
- 30.Journiac N, Jolly S, Jarvis C, Gautheron V, Rogard M, Trembleau A, Blondeau JP, Mariani J, Vernet-der Garabedian B. The nuclear receptor ROR(alpha) exerts a bidirectional regulation of IL-6 in resting and reactive astrocytes. Proc Natl Acad Sci U S A. 2009;106:21365–21370. doi: 10.1073/pnas.0911782106. [DOI] [PMC free article] [PubMed] [Google Scholar]
- 31.Mizwicki MT, Bula CM, Bishop JE, Norman AW. New insights into Vitamin D sterol-VDR proteolysis, allostery, structure-function from the perspective of a conformational ensemble model. J Steroid Biochem Mol Biol. 2007;103:243–262. doi: 10.1016/j.jsbmb.2006.12.004. [DOI] [PMC free article] [PubMed] [Google Scholar]
- 32.Mizwicki MT, Menegaz D, Zhang J, Barrientos-Duran A, Tse S, Cashman JR, Griffin PR, Fiala M. Genomic and nongenomic signaling induced by 1alpha,25(OH)2-vitamin D3 Promotes the recovery of amyloid-beta phagocytosis by Alzheimer’s disease macrophages. J Alzheimers Dis. 2012;29:51–62. doi: 10.3233/JAD-2012-110560. [DOI] [PubMed] [Google Scholar]
- 33.Eckert A, Steiner B, Marques C, Leutz S, Romig H, Haass C, Muller WE. Elevated vulnerability to oxidative stress-induced cell death and activation of caspase-3 by the Swedish amyloid precursor protein mutation. J Neurosci Res. 2001;64:183–192. doi: 10.1002/jnr.1064. [DOI] [PubMed] [Google Scholar]
- 34.Roychaudhuri R, Yang M, Hoshi MM, Teplow DB. Amyloid beta-protein assembly and Alzheimer disease. J Biol Chem. 2009;284:4749–4753. doi: 10.1074/jbc.R800036200. [DOI] [PMC free article] [PubMed] [Google Scholar]
- 35.Bateman RJ, Xiong C, Benzinger TL, Fagan AM, Goate A, Fox NC, Marcus DS, Cairns NJ, Xie X, Blazey TM, Holtzman DM, Santacruz A, Buckles V, Oliver A, Moulder K, Aisen PS, Ghetti B, Klunk WE, McDade E, Martins RN, Masters CL, Mayeux R, Ringman JM, Rossor MN, Schofield PR, Sperling RA, Salloway S, Morris JC the Dominantly Inherited Alzheimer N. Clinical and biomarker changes in dominantly inherited Alzheimer’s disease. N Engl J Med. 2012;367:795–804. doi: 10.1056/NEJMoa1202753. [DOI] [PMC free article] [PubMed] [Google Scholar]
- 36.Fiala M, Mahanian M, Rosenthal M, Mizwicki MT, Tse E, Cho T, Sayre J, Weitzman R, Porter V. MGAT3 mRNA: a biomarker for prognosis and therapy of Alzheimer’s disease by vitamin D and curcuminoids. J Alzheimers Dis. 2011;25:135–144. doi: 10.3233/JAD-2011-101950. [DOI] [PubMed] [Google Scholar]
- 37.Landreth GE, Reed-Geaghan EG. Toll-like receptors in Alzheimer’s disease. Curr Top Microbiol Immunol. 2009;336:137–153. doi: 10.1007/978-3-642-00549-7_8. [DOI] [PMC free article] [PubMed] [Google Scholar]
- 38.Liu L, Aboud O, Jones RA, Mrak RE, Griffin ST, Barger SW. Apolipoprotein E expression is elevated by interleukin 1 and other interleukin 1-induced factors. J Neuroinflammation. 2011;8:175. doi: 10.1186/1742-2094-8-175. [DOI] [PMC free article] [PubMed] [Google Scholar]
- 39.Kitazawa M, Cheng D, Tsukamoto MR, Koike MA, Wes PD, Vasilevko V, Cribbs DH, LaFerla FM. Blocking IL-1 signaling rescues cognition, attenuates tau pathology, and restores neuronal beta-catenin pathway function in an Alzheimer’s disease model. J Immunol. 2011;187:6539–6549. doi: 10.4049/jimmunol.1100620. [DOI] [PMC free article] [PubMed] [Google Scholar]
- 40.Smith AJ, Keen LJ, Billingham MJ, Perry MJ, Elson CJ, Kirwan JR, Sims JE, Doherty M, Spector TD, Bidwell JL. Extended haplotypes and linkage disequilibrium in the IL1R1-IL1A-IL1B-IL1RN gene cluster: association with knee osteoarthritis. Genes Immun. 2004;5:451–460. doi: 10.1038/sj.gene.6364107. [DOI] [PubMed] [Google Scholar]
- 41.Holick MF. Vitamin D: a D-Lightful health perspective. Nutr Rev. 2008;66:S182–194. doi: 10.1111/j.1753-4887.2008.00104.x. [DOI] [PubMed] [Google Scholar]
- 42.Fernandes de Abreu DA, Eyles D, Feron F. Vitamin D, a fneuro-immunomodulator: implications for neurodegenerative and autoimmune diseases. Psychoneuroendocrinology. 2009;34(Suppl 1):S265–277. doi: 10.1016/j.psyneuen.2009.05.023. [DOI] [PubMed] [Google Scholar]
- 43.Zhao Y, Calon F, Julien C, Winkler JW, Petasis NA, Lukiw WJ, Bazan NG. Docosahexaenoic acid-derived neuroprotectin D1 induces neuronal survival via secretase- and PPARgamma-mediated mechanisms in Alzheimer’s disease models. PLoS One. 2011;6:e15816. doi: 10.1371/journal.pone.0015816. [DOI] [PMC free article] [PubMed] [Google Scholar]
- 44.Dickens AP, Lang IA, Langa KM, Kos K, Llewellyn DJ. Vitamin D, cognitive dysfunction and dementia in older adults. CNS Drugs. 2011;25:629–639. doi: 10.2165/11593080-000000000-00000. [DOI] [PMC free article] [PubMed] [Google Scholar]
Associated Data
This section collects any data citations, data availability statements, or supplementary materials included in this article.
Supplementary Materials
Supplementary Figure 1. 1,25D3 and RvD1 recover Aβ phagocytosis by macrophages of AD patients. The pictures obtained following the treatment of AD macrophages from the five AD patients and a control subject with FAM-Aβ and the effect of 1,25D3 and RvD1 on binding and uptake of FAM-Aβ (green). The cytoskeleton in each figure panel is stained red and the nucleus blue.
Supplementary Figure 2. Effects of exogenous sAβ and fAβ on the expression of inflammatory and autoimmune genes in AD patients and controls. A) A volcano plot demonstrates the effects of sAβ in the group 1 patient 1 PBMCs (n=3) compared to control PBMCs (n=3). B) A volcano plot demonstrates how group 2 AD PBMCs (n=3) treated with sAβ compared to control PBMCs treated with sAβ (n=3). C) Scatter plot and heat map of the greater pro-inflammatory effect of 2 μg/ml fAβ (n=3) in group 1 AD PBMCs when compared to 2 μg/ml sAβ (n=3). D) Effect of sAβ on the baseline expression of nuclear receptors and transcriptional co-regulators in group 1 AD PBMCs (n=2).
Supplementary Figure 3. Effects of RvD1 on transcription in group 2 AD, patient 1. A) A volcano plot demonstrating that RvD1 significantly down regulated the expression of a number of different cytokines up regulated by sAβ in patient 1 (n=3), a group 2 AD patient (Table 1). B) Scatter plot demonstrating that 26 nM RvD1 does not down regulate the transcription of nuclear receptors and co-regulators stimulated by exogenous sAβ. C) A volcano plot demonstrating the impact of co-incubating PBMCs overnight with fAβ.on the effect of RvD1 in patient 1 PBMCs.
Supplementary Figure 4. Effects of 1,25D3 on transcription in group 2 AD, patient 1. A) A heat map demonstrating that 1,25D3 has a more potent down regulatory effect when compared to RvD1 in PBMCs co-incubated with sAβ patient 1 (n=2 for each group). The array layout for the heat map is provided under the figure panels. B) Scatter plot that demonstrates the effect 10 nM 1,25D3 has on the transcription of nuclear receptors and co-regulators when co-incubated with sAβ.


