Abstract
The relationship between the expression of particular genes in cells and their impact on phenotypic characteristics is important for understanding how cells regulate responses to their environment. We have developed a microwell-based method to detect copies of mRNA transcripts directly from individual cells by one-step, single-cell, reverse transcription polymerase chain reaction (RT-PCR). Our approach permits the detection of mRNA transcripts of interest for more than 6000 single cells in parallel per assay with high sensitivity and specificity for constitutively active genes. This simple method was also combined with microengraving and image-based cytometry to examine the relationships between gene expression and cellular secretion of antibodies in a clonal population. We observed that most individual human B cell hybridomas transcribed a requisite gene for their antibodies, but only a subset of those cells secreted the antibody. The technique should also allow the detection of replicating intracellular pathogens such as retroviruses.
The relationship between expression of certain genes and the subsequent functional activities of a cell is a central question in cell biology. Traditional assays for studying genetic and proteomic responses to applied external stimuli typically require more than 103 cells for each analysis.1,2 The resulting average measures, however, obscure variations that may exist among individual cells, and can lead to misinterpretations of the biology.3,4 Analytic tools for assessing both gene expression and cellular functions, such as secretion of particular proteins, for the same individual cells would allow direct determination of the relationships between transcription and biological activities. This paper describes a simple, one-step process for detecting the expression of specific genes in thousands of single cells in parallel, and demonstrates how this process, combined with imaging cytometry and microengraving,5,6 enables an integrated single-cell analysis of both the expression of a specific gene and secretion of the corresponding translated protein from each cell.
The detection of transcribed genes often uses reverse transcription (RT) polymerase chain reaction (PCR) to convert mRNA into many copies of cDNA. This reaction can amplify many specific transcripts from single cells—usually sorted into microtitre plates by flow cytometry or micromanipulation—to recover particular genes of interest7 or to quantify the amount of mRNA present.8 Using conventional plates is labor-intensive and costly for analyzing a statistically robust numbers of single cells. Miniaturized systems have been developed that use actuated microfluidic systems,8 micro-droplets of water-in-oil emulsions,9–11 and arrays of microwells12–14 to define individual PCR reactions requiring only femtolitres to nanolitres of reagents to reduce costs. These approaches can also increase the efficiency of amplifying limited numbers of templates. On-chip RT-PCR reactions have been demonstrated for amplifying isolated mRNA15,16 or small numbers of individual cells.17,18
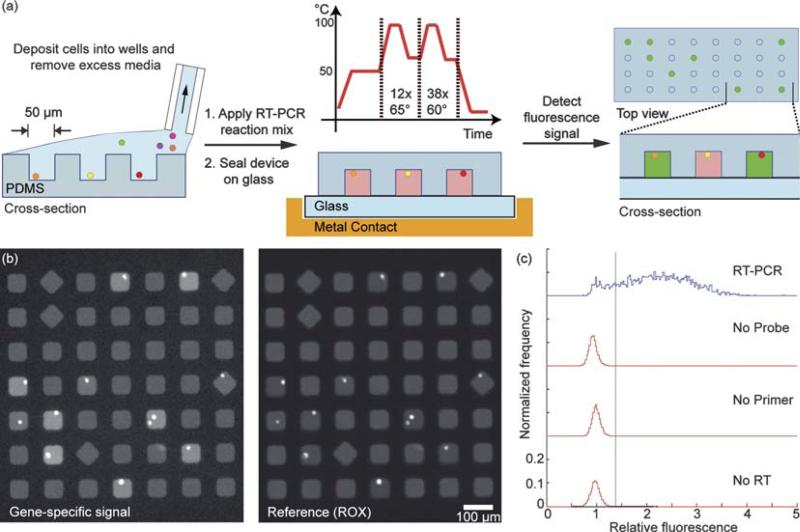
Reagents for RT-PCR reactions that integrate the lysis of mammalian cells, reverse transcription, and the amplification of the cDNA into a single operation are widely available commercially. Here we demonstrate a method using an elastomeric array of subnanolitre wells to confine individual cells for massively parallel single-cell RT-PCR and subsequent gene-specific detection using dual-labeled, gene-specific DNA probes19 (TaqMan) (fig. 1a). Cells are deposited from a suspension onto the array and allowed to settle by gravity to a density of ~1 cell per well.6 After aspirating the excess liquid from the surface of the array, a 40 μL solution containing reverse transcriptase, Taq polymerase, detergent (NP-40), RNase inhibitor, gene-specific sets of TaqMan probe and primers, and a reference dye (5-carboxy-X-rhodamine, ROX) is dispersed over the array of wells. The wells are then sealed by placing a glass slide on top of the wells to constrain the cells in individual volumes of 125 pL for lysis and RT-PCR.
Fig. 1.
(a) Schematic of method for parallel single-cell RT-PCR reactions in subnanolitre volumes. Cells are deposited in microwells, filled with a solution of components for RT-PCR, and then sealed to a glass slide. The thermal lysis, first strand synthesis, and amplification of cDNA are conducted on a thermocycler. The fluorescence intensity of cleaved probes is detected by epifluorescent microscopy. (b) Fluorescent micrographs of gene-specific (B2M) and a reference signal (ROX) confined in individual, sealed microwells. (c) Histogram of the relative fluorescence of wells that contain cells. Positive reactions have a relative fluorescence greater than 1.4.
To establish the feasibility for in situ lysis and detection of an expressed gene of interest in wells containing cells, we used a human B cell hybridoma (4D20) that produces an antibody (IgG1) against the 1918 H1N1 influenza A virus.20 Lysis of the cells and subsequent reverse transcription of a constitutively expressed gene (β-2-micro-globulin, B2M) were achieved in the closed reactors at 50 °C for 40 min. Then, the array was subjected to 50 rounds of thermocycling to amplify the transcribed cDNA and hydrolyze the quenched fluorophore from the labeled probes. The array was imaged to detect the fluorescent signals evolved from the digested probes (Fig. 1b). The images were analyzed using a custom program to determine the location of each well, the number of cells per well, and the fluorescence intensities of both the released probe and reference dye. These data were then filtered to discard wells with no liquid after thermo-cycling, wells with more than four cells, and wells with a large coefficient of variation in the soluble reference signal (ROX). To normalize for regional variations of the measured intensities, we calculated the relative fluorescence as the ratio of the gene-specific signal (Iwell) to the mean of the gene-specific signal of nearby empty wells (Iempty) (Fig. 1c, top).
To determine the threshold value for a positive RT-PCR reaction, we fit the relative fluorescence of the wells containing no cells to a single Gaussian distribution to obtain estimates for the mean and standard deviation of the peak representing negative reactions (0.96 ± 0.12). We defined positive reactions as those wells containing cells with a ratio greater than three standard deviations above the mean ratio determined for empty wells. The percentage of positive events scored in control experiments in which either the primers, probe, or reverse transcriptase were excluded was less than 0.01% (Fig. 1c). The lack of positive events scored upon omission of reverse transcriptase from the reaction indicates that the genomic DNA was not amplified, and implies that it is not necessary to remove residual genomic DNA from the reaction when using intron-spanning primers. Digestion of the gene-specific probe with DNase I in the reaction mixture prior to application to an array without cells yielded a measured ratio of probe specific fluorescence to that for the reference dye (ROX) of Iwell/IROX = 2.65 ± 0.08 (data not shown). Small variations in volumes due to evaporation during the thermocycle of cell-based experiments could increase the concentration of the dye in the microwells, and thus account for the increased ratios observed, relative to the values determined by cell-free digestion of the probe. This experiment, in combination with the cell-based experiments, suggested that the maximum relative fluorescence for a positive reaction can reach an endpoint significantly greater than the ratio measured in unamplified wells (~1) within 50 rounds of thermocycling.
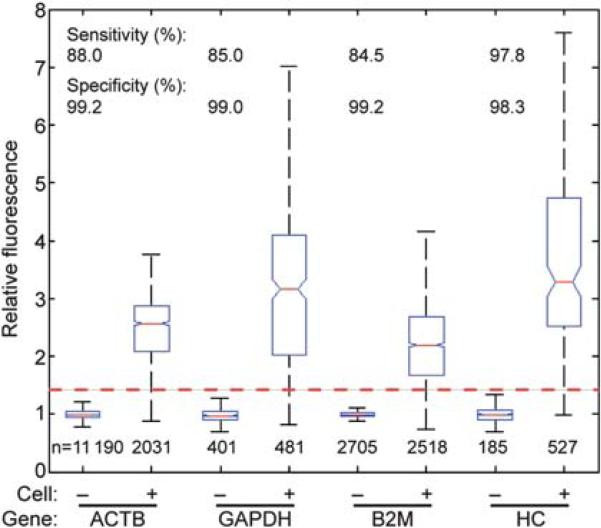
Next, we determined the sensitivity and specificity of the method using three genes that are commonly employed as standards for RT-qPCR (B2M, glyceraldehyde 3-phosphate dehydrogenase (GAPDH), b-actin (ACTB)), as well as the heavy chain of the antibody produced by the 4D20 hybridomas (HC) (Fig. 2). The threshold values for positive reactions were determined for all four genes, and the sensitivity and specificity were calculated based on the assumption that each cell should express each gene constitutively. Using the maximum threshold of 1.4, the sensitivity and specificity of the assay were greater than 84% and 98%, respectively. These values were consistent across independent experiments. For example, the sensitivity and specificity calculated for the 4D20 HC ranged from 93.7% to 98.0%, and from 98.1% to 99.7%, respectively. We note that the actual sensitivity could be higher than determined: it is possible that a small fraction of the cells were not expressing the target gene at the time of the assay. The positive predictive value, which indicates the confidence in the assignments, was greater than 95% for all genes.
Fig. 2.
Detection of mRNA transcripts of constitutively expressed genes in 4D20 cells. Representative box plots of Iwell/Iempty for four genes (ACTB, GAPDH, B2M, and HC) from eight independent experiments. The box plot follows Tukey's convention. The median is marked with a red line, and the upper and lower edges of the box indicate the values of the upper and lower quartiles. Notches on the box adjacent to the median value represent its 5% significance level. Whiskers extending from each end of the box represent extreme values within 1.5 times the interquartile range. The numbers of wells included in each box plot are indicated below each one. The red dashed line indicates the minimum value for positive reactions used for all four genes.
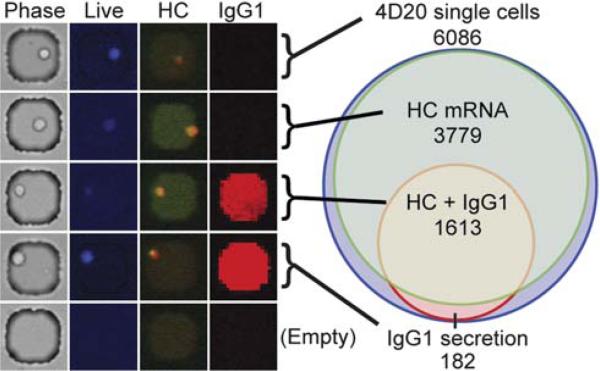
For integrated single-cell analysis of both gene expression and secretory phenotypes, the method described here can be combined with other microwell-based techniques such as imaging cytometry and microengraving—a technique for quantifying the frequencies and rates of secretion of proteins for populations of single cells.6 We sought to determine if the detection of transcripts for HC in the hybridomas correlated with antibody secretion in the period of time immediately beforehand. To examine this relationship between transcribed genes and secreted proteins, 4D20 cells were labeled with a live cell marker, loaded into microwells, and imaged to quantify the number of cells in each well. The array containing cells was then sealed with a functionalized glass slide to capture secreted antibodies by microengraving.5 After two hours, the glass slide was removed and probed for captured antibodies, while the cells in the microwells were then subjected to on-chip RT-PCR to detect HC mRNA (Fig. 3). Out of 6086 wells with single cells, 5392 cells (88.6%) expressed the heavy chain mRNA, but only 1795 cells (29.5%) secreted IgG1 during the preceding period of time. Most of the cells secreting IgG1 also had detectable transcripts (89.9%). Although the analysis included only live cells at the beginning of the assay, the additional interrogation for secreted antibodies may have decreased the number of viable cells available after microengraving, and could account for the small reduction in sensitivity observed in this integrated assay relative to that seen with freshly deposited cells. Nonetheless, these data provide direct evidence that analyzing transcribed genes alone does not necessarily provide a suitable surrogate for complex functional activities such as secretion.
Fig. 3.
Integrated single-cell analysis of gene expression and secreted antibodies from human B cell hybridomas. 4D20 cells were labeled with a live cell stain (CellTracker Violet) and interrogated for IgG1 secretion and heavy chain mRNA. Sample images of correlated data for representative phenotypes are shown (left). The relative fluorescence of the RT-PCR is false colored from red-orange (no reaction) to green (positive reaction). Positive IgG1 secretion is false colored red. The graphic profile (right) shows the distribution of phenotypes measured. The area of each circle is proportional to the number of each phenotype enumerated.
The simple RT-PCR assay presented here allows for the detection of gene expression in thousands of individual cells in parallel with high sensitivity and specificity. A significant advantage of the approach is that it integrates with other processes for single-cell analysis such as microengraving and image-based cytometry. This combination provides a multivariate and direct measure of the relationships between the presence of transcribed genes and functional cellular activities for many individual cells. A disadvantage of the current approach is that the measures of gene expression are not quantitative. The number of fluorescent labels that can be distinguished distinctly (~4 to 6 for most fluorescent microscopes) will also limit the number of transcripts detected per cell. Real-time imaging and advanced imaging methods could address these challenges. Nonetheless, this approach is well-suited to evaluate simple relationships between the transcription of genes and the secretion of the translated products—a useful intersection to evaluate the suitability of surrogate markers for monitoring clonal production in bio-manufacturing or clinical factors in diagnostics. Other applications for this approach may include the detection and functional pheno-typing of cells infected with retroviruses or intracellular pathogens (e.g., tuberculosis), and the amplification of specific genes from many cells in parallel for downstream genetic analysis by sequencing.
Supplementary Material
Acknowledgements
The authors thank James Crowe for generously providing the 4D20 cell line. This research was supported by the Dana Foundation and by the Singapore-MIT Alliance (SMART) Infectious Disease IRG. Y.G. and A.O.O. are supported by the NIH/NIGMS Biotechnology Training Grant. J.C.L. is a Texaco Mangelsdorf Career Development Professor.
Footnotes
Published as part of a special issue dedicated to Emerging Investigators: Guest Editors: Aaron Wheeler and Amy Herr.
Electronic supplementary information (ESI) available: Detailed experimental methods. See DOI: 10.1039/c004847j
References
- 1.Engvall E, Perlmann P. J. Immunol. 1972;109:129–135. [PubMed] [Google Scholar]
- 2.Chen C, Ridzon DA, Broomer AJ, Zhou Z, Lee DH, Nguyen JT, Barbisin M, Xu NL, Mahuvakar VR, Andersen MR, Lao KQ, Livak KJ, Guegler KJ. Nucleic Acids Res. 2005;33:e179. doi: 10.1093/nar/gni178. [DOI] [PMC free article] [PubMed] [Google Scholar]
- 3.Bengtsson M, Hemberg M, Rorsman P, Stahlberg A. BMC Mol. Biol. 2008;9:63. doi: 10.1186/1471-2199-9-63. [DOI] [PMC free article] [PubMed] [Google Scholar]
- 4.Di Carlo D, Lee LP. Anal. Chem. 2006;78:7918–7925. doi: 10.1021/ac069490p. [DOI] [PubMed] [Google Scholar]
- 5.Ogunniyi AO, Story CM, Papa E, Guillen E, Love JC. Nat. Protoc. 2009;4:767–782. doi: 10.1038/nprot.2009.40. [DOI] [PMC free article] [PubMed] [Google Scholar]
- 6.Han Q, Bradshaw EM, Nilsson B, Hafler DA, Love JC. Lab Chip. 2010;10:1391–1400. doi: 10.1039/b926849a. [DOI] [PMC free article] [PubMed] [Google Scholar]
- 7.Yamamura S, Kishi H, Tokimitsu Y, Kondo S, Honda R, Rao SR, Omori M, Tamiya E, Muraguchi A. Anal. Chem. 2005;77:8050–8056. doi: 10.1021/ac0515632. [DOI] [PubMed] [Google Scholar]
- 8.Warren L, Bryder D, Weissman IL, Quake SR. Proc. Natl. Acad. Sci. U. S. A. 2006;103:17807–17812. doi: 10.1073/pnas.0608512103. [DOI] [PMC free article] [PubMed] [Google Scholar]
- 9.Beer NR, Hindson BJ, Wheeler EK, Hall SB, Rose KA, Kennedy IM, Colston BW. Anal. Chem. 2007;79:8471–8475. doi: 10.1021/ac701809w. [DOI] [PubMed] [Google Scholar]
- 10.Kiss MM, Ortoleva-Donnelly L, Beer NR, Warner J, Bailey CG, Colston BW, Rothberg JM, Link DR, Leamon JH. Anal. Chem. 2008;80:8975–8981. doi: 10.1021/ac801276c. [DOI] [PMC free article] [PubMed] [Google Scholar]
- 11.Mazutis L, Araghi AF, Miller OJ, Baret J-C, Frenz L, Janoshazi A, Taly V, Miller BJ, Hutchison JB, Link D, Griffiths AD, Ryckelynck M. Anal. Chem. 2009;81:4813–4821. doi: 10.1021/ac900403z. [DOI] [PubMed] [Google Scholar]
- 12.Leamon JH, Lee WL, Tartaro KR, Lanza JR, Sarkis GJ, Dewinter AD, Berka J, Lohman KL. Electrophoresis. 2003;24:3769–3777. doi: 10.1002/elps.200305646. [DOI] [PubMed] [Google Scholar]
- 13.Lindström S, Hammond M, Brismar H, Andersson-Svahn H, Ahmadian A. Lab Chip. 2009;9:3465–3471. doi: 10.1039/b912596e. [DOI] [PubMed] [Google Scholar]
- 14.Nagai H, Murakami Y, Morita Y, Yokoyama K, Tamiya E. Anal. Chem. 2001;73:1043–1047. doi: 10.1021/ac000648u. [DOI] [PubMed] [Google Scholar]
- 15.Marcus JS, Anderson WF, Quake SR. Anal. Chem. 2006;78:3084–3089. doi: 10.1021/ac0519460. [DOI] [PubMed] [Google Scholar]
- 16.Marcus JS, Anderson WF, Quake SR. Anal. Chem. 2006;78:956–958. doi: 10.1021/ac0513865. [DOI] [PubMed] [Google Scholar]
- 17.Toriello NM, Douglas ES, Thaitrong N, Hsiao SC, Francis MB, Bertozzi CR, Mathies RA. Proc. Natl. Acad. Sci. U. S. A. 2008;105:20173–20178. doi: 10.1073/pnas.0806355106. [DOI] [PMC free article] [PubMed] [Google Scholar]
- 18.Kumaresan P, Yang CJ, Cronier SA, Blazej RG, Mathies RA. Anal. Chem. 2008;80:3522–3529. doi: 10.1021/ac800327d. [DOI] [PubMed] [Google Scholar]
- 19.Holland PM, Abramson RD, Watson R, Gelfand DH. Proc. Natl. Acad. Sci. U. S. A. 1991;88:7276–7280. doi: 10.1073/pnas.88.16.7276. [DOI] [PMC free article] [PubMed] [Google Scholar]
- 20.Yu X, Tsibane T, McGraw PA, House FS, Keefer CJ, Hicar MD, Tumpey TM, Pappas C, Perrone LA, Martinez O, Stevens J, Wilson IA, Aguilar PV, Altschuler EL, Basler CF, Crowe JE., Jr Nature. 2008;455:532–536. doi: 10.1038/nature07231. [DOI] [PMC free article] [PubMed] [Google Scholar]
Associated Data
This section collects any data citations, data availability statements, or supplementary materials included in this article.


