Abstract
High intensity focused ultrasound (HIFU) is capable of mechanically disintegrating blood clots at high pressures. Safe thrombolysis may require frequencies higher than those currently utilized by transcranial HIFU. Since the attenuation and focal distortion of ultrasound in bone increases at higher frequencies, resulting focal pressures are diminished. This study investigated the feasibility of using transcranial HIFU for the non-invasive treatment of ischemic stroke. The use of large aperture, 1.1–1.5 MHz phased arrays in targeting four clinically relevant vessel locations was simulated. Resulting focal sizes decreased with frequency, producing a maximum −3 dB depth of field and lateral width of 2.0 and 1.2 mm, respectively. Mean focal gains above an order of magnitude were observed in three of four targets and transducer intensities required to achieve thrombolysis were determined. Required transducer element counts are about an order of magnitude higher than what currently exists and so, although technically feasible, new arrays would need to be developed to realize this as a treatment modality for stroke.
1. Introduction
Stroke is the third leading cause of death in the United States, with approximately 795 000 people experiencing strokes each year (Roger et al 2011). Current treatment techniques are characterized with low recanalization rates, high mortality rates, and short time windows, which preclude a large number of patients from treatment (Roger et al 2011, Saqqur et al 2007, Medel et al 2009).
At diagnostic intensities, ultrasound has been shown to increase the efficacy of tissue plasminogen activator (tPA), the only thrombolytic drug approved for the treatment of stroke. Results have demonstrated an increase in recanalization rates, but also an increased incidence of symptomatic intracerebral hemorrhage (sICH) (Tsivgoulis et al 2010, Molina et al 2009, Daffertshofer et al 2005). Furthermore, this adjunct therapy does not address the short time window inherent in the use of tPA.
The TRUMBI trial, where patients were given tPA along with 300 kHz ultrasound, was halted prematurely due to a high incidence of sICH (Daffertshofer et al 2005), which was believed to have been caused by the formation of standing waves in the brain (Baron et al 2009). This trial utilized a relatively low sonication frequency, which can lead to a higher likelihood of standing waves due to the associated longer wavelength and lower attenuation values. To prevent their formation, Azuma et al recommended that sonication frequencies be kept above 1 MHz (2004). Furthermore, Song et al demonstrated that standing waves can be significantly minimized with low f-number phased arrays (2012).
Focused ultrasound is capable of delivering energy into tissue non-invasively and without the use of ionizing radiation. For many years, the skull posed as a barrier for the use of focused ultrasound in the brain and it was believed that such procedures could only be completed with a surgical craniotomy. However, techniques using large aperture phased arrays to correct for the skull's distortion have been developed, allowing focusing through the intact skull (Sun and Hynynen 1999, Clement et al 2000, Hynynen and Clement 2007, Aubry et al 2003). The acoustical properties of the human skull can be estimated non-invasively from computed tomography (CT) data and used to calculate the corrections required for transcranial focusing (Aubry et al 2003, Clement and Hynynen 2002). This has led to the use of high intensity focused ultrasound (HIFU) in several transcranial procedures, including thermal tumor ablation (McDannold et al 2010) and functional neurosurgery to treat chronic pain (Martin et al 2009), currently at the clinical trial stage.
The capability of HIFU to mechanically disintegrate a blood clot without the use of tPA has been demonstrated (Rosenschein et al 2000, Maxwell et al 2009), with inertial cavitation believed to be the dominant mechanism involved (Rosenschein et al 1994). Pulsed sonication is ideal when mechanically induced bioeffects are desired, as it enables high acoustic pressures while reducing time average intensities, which in turn minimizes heating. Successful clot lysis has been demonstrated in a porcine femoral vein model using 1 MHz histotripsy pulses (Maxwell et al 2011). In a rabbit femoral artery model, clot lysis has been demonstrated with vessel damage at 0.68 MHz and without vessel damage at 2 MHz (Hynynen and McDannold 2006) and 1.5 MHz (Wright et al 2012).
Optimal focusing through the skull for thermal treatments occurs at frequencies near 700 kHz (Hynynen and Clement 2007, Sun and Hynynen 1998); however to avoid the formation of standing waves and reduce the risk of vessel damage during stroke treatment, sonication must be performed at higher frequencies. The attenuation of ultrasound in bone increases at these higher frequencies, as does the focal distortion caused by the skull. Therefore, in order to realize the use of HIFU for the non-invasive treatment of stroke, new technology needs to be developed.
Through the simulation of large aperture phased arrays, this study investigated the feasibility of HIFU for the non-invasive treatment of stroke. The design trade-offs inherent in this approach are investigated and array specifications are proposed.
2. Methods
2.1. Array specifications
Hemispherical arrays were simulated with element sizes ranging from 2 to 10 mm, measured as the median width. Aperture diameters were kept fixed at 30 cm, requiring element counts ranging from 1461 to 35 519 to populate the entire array (table 1). Elements were positioned in concentric rings from the center to the outer edge of the hemisphere. Elements were square shaped at the sides of the array and trapezoidally shaped near the array's center. Trapezoidal elements were utilized to reduce spaces between the elements near the array's center in order to keep the total array surface area relatively constant between each array configuration. Within a single array, element heights and midline widths varied by 6% at maximum and element areas were kept relatively constant, varying by less than 1%. Elements were initially simulated with a surface intensity of 12 W cm−2, which corresponds to transducer peak surface pressures of 600 kPa. Resulting pressures were then compared with target pressures in order to determine transducer intensity requirements for sonothrombolysis. Simulations were conducted at 1.1, 1.3, and 1.5 MHz.
Table 1.
Simulated array element counts and sizes. Arrays used in vessel location simulations are denoted with asterisks.
| Element width (mm) | Elements |
|---|---|
| 10 | 1461 |
| 7 | 2941* |
| 4 | 8907* |
| 3 | 15 875* |
| 2.5 | 22 885* |
| 2 | 35519 |
2.2. Simulation parameters
CT scans (LightSpeed VCT, GE Healthcare, Chalfont St Giles, UK) of human cadaver skulls (The Bone Room, Berkeley, CA, USA) were used to construct models of the inner and outer skull surfaces. Imaged volumes consisted of 512 × 512 × 328 voxels with a voxel size of 0.625 × 0.625 × 0.625 mm3. The CT data were segmented to extract the bone regions. An open source isosurface generation algorithm (Treece et al 2000) was then used to generate inner and outer skull surface mesh representations composed of triangles, outputted in the standard OOGL (Object Oriented Graphics Library) format. Besides surface generation, all data processing was performed using MATLAB (R2010a, Mathworks, Natick, MA). Meshes were created such that surface element areas were all less than (λ/2)2. The mesh elements defined the source and surface elements required for the propagation model, as described in section 2.3.
CT image intensity data, acquired in Hounsfield units, were converted to densities through a linear relationship as was done by Connor et al (2002). Each transducer array was positioned to maximize the usable skull surface area, while staying above the eyes and ears (figure 1). The array position was fixed for each skull and electronic steering was used to target each location. In the clinic, this would obviate the need for precise transducer positioning and provide the largest possible acoustic window. All simulations were repeated over five skulls.
Figure 1.
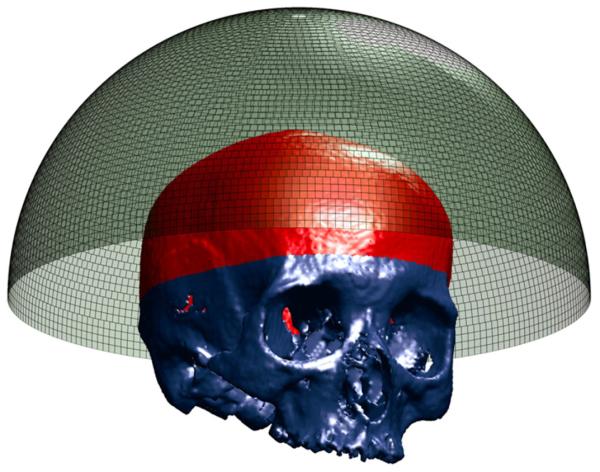
Transducer array with 8907 elements and segmented skull. Usable skull surface is delineated.
Water and brain were each modeled as homogenous mediums, with the acoustic parameters provided in table 2. The skull density values were integrated over each beam path. Relationships for the speed of sound and attenuation as a function of both frequency and density have been determined previously (Pichardo et al 2011). MATLAB was used to interpolate the relationships from Pichardo et al to frequencies of 1.1, 1.3, and 1.5 MHz (figure 2). The interpolated relationships and the calculated mean densities were used to determine the attenuation and speed of sound coefficients for each beam path.
Table 2.
Water and brain parameters are based on those presented in Connor and Hynynen (2004) and Duck (1990).
| Water | Brain | |
|---|---|---|
| Speed of sound (m s−1) | 1500 | 1562 |
| Density (kg m−3) | 1000 | 1300 |
| Attenuation (Np m−1) | 4.32 × 10⁻⁴ | 4.35 |
Figure 2.
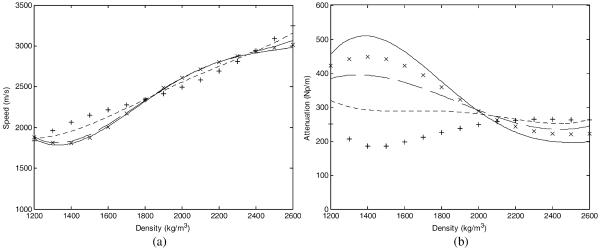
Density dependent speed of sound (a) and attenuation (b) values within the skull for interpolated frequencies of 1.5 MHz (solid), 1.3 MHz (dashed), and 1.1 MHz (dotted). 1.402 MHz (×) and 836 kHz (+) nodes from Pichardo et al (2011) are shown for reference.
2.3. Propagation model
The propagation of ultrasound through water, skull, and brain was simulated using the Rayleigh–Sommerfeld integral in a multilayer case (Sun and Hynynen 1998). The implementation below was compared against simulations and measurements in Fan and Hynynen (1992) with good agreement. Shear waves were not incorporated into the model due to their high attenuation at the relatively high frequencies being simulated (White et al 2006). Wave mode conversion at the interface resulting in the generation of shear waves would reduce the energy of the transmitted longitudinal wave. However, the majority of shear wave generation occurs at angles where the incident wave would have been reflected (Clement et al 2004), minimizing the reduction of transmitted energy. Using a full-wave model (as described in Song et al (2012)), basic through-skull simulations at 720 kHz were conducted with a smaller transducer to assess the effect of not modeling shear waves (data not presented). The case where shear waves were not incorporated overestimated the peak pressure by less than 2%.
The Rayleigh–Sommerfeld integral does not account for nonlinear effects. Although the use of a full-wave model would allow modeling of nonlinear effects, it would also require volumetric discretization at 5–20 points per wavelength, at the highest harmonic being modeled (Pulkkinen and Hynynen 2010). This would not have been practical to implement at the relatively high driving frequency and large volumes required for this study. The pressure values reported in this study are based on linear estimates, which may overestimate the produced peak negative pressure, however nonlinear effects are minimized by the use of low f-number transducers (Hynynen 1991a).
Back propagation was implemented to determine the element driving phases that result in coherent summation at the target. A vibrating surface can be modeled as a set of Nm simple sources, each with normal velocity uim and area dsim, where im = 1 to Nm. The strength of source im on layer m is denoted by uimdsim, where m = 1, 2, 3 for the transducer, outer skull, and inner skull layers, respectively (figure 3). As derived previously in Fan and Hynynen (1994), the normal velocity of the surface in due to source im is given by
| (1) |
where is the complex wavenumber of the propagation medium given an attenuation coefficient of αimin, and Rimin, Tvimin, and θimin are the Cartesian distance, velocity transmission coefficient, and transmitted angle, respectively, between source im and surface in. The complex wavenumber was constant in the brain and water layers, but calculated separately for each beam path in the skull.
Figure 3.
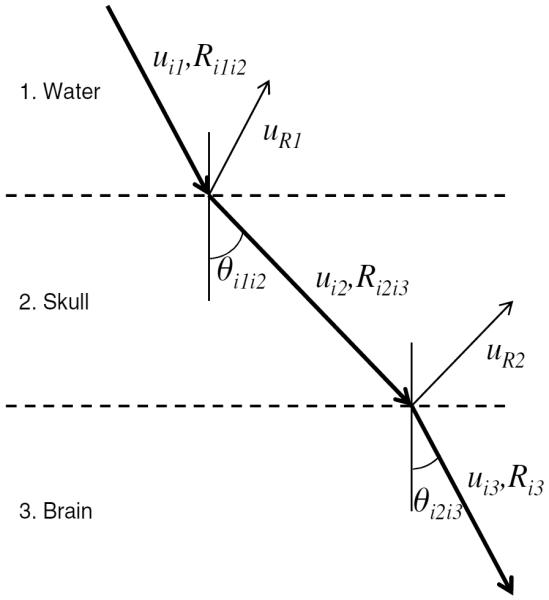
Wave transmission and reflection through a simplified two-layer model is illustrated.
After decomposing the transducer and outer skull surfaces into sets of simple sources, the normal velocity of each simple source on the outer skull surface was calculated by summing the contributions from all point sources on the transducer surface, using equation (1). The normal velocities on the inner skull surface were similarly calculated by summing the contributions of all point sources on the outer skull surface. The peak pressure amplitude at a point (x, y, z) due to source im is given by
| (2) |
where ρm and cm are the density and speed of sound of medium m, respectively, and Rim is the distance between source im and point (x, y, z). Equation (2) was used to calculate the resultant pressures at the focus in the brain. The transducer surface intensities were calculated using , the impedance relation for linear plane waves (Cobbold 2007). Pressure at the outer skull boundary was calculated by summing the incident and reflected complex pressure amplitudes at the boundary. The peak pressure amplitude at a point i2 on the outer skull surface due to source i1 on the transducer is given by
| (3) |
where Rpi1i2 is the pressure reflection coefficient at surface i2 due to source i1. Pressures on the outer skull outer were calculated in order to determine focal pressure gain values. Pressure and velocity transmission coefficients are given by
| (4) |
| (5) |
where Tv is the velocity transmission coefficient, Tp and Rp are the pressure transmission and pressure reflection coefficients, respectively, ci and ρi are the speed of sound and density of medium i, θ1 is the incident angle, and θ2 is the transmitted angle.
2.4. Amplitude adjustment
The ability of a phased array to focus through an intact skull can be represented by the ratio of the focal pressure to the pressure on the outer skull: the focal pressure gain. The average pressure gain (GAVG) and minimum pressure gain (GMIN) are defined as the focal pressure gains calculated with the average outer skull pressure and maximum outer skull pressure, respectively. A single pressure hotspot could mean the development of inertial cavitation and tissue damage outside the skull, which makes GMIN an important metric in evaluating phased array configurations. The irregular shape of the skull could lead to an irregular pressure distribution on the outer skull surface, which would result in lower GMIN values. However, transducer elements which lead to the higher pressure locations can be identified and driven at lower amplitudes to create a more uniform outer skull pressure distribution (White et al 2005). This amplitude adjustment technique was used to reduce pressure hotspots on the outer skull.
2.5. Vessel segmentation
The majority of occlusions occur in the middle cerebral artery (MCA), with clots in the most proximal region (M1 segment) having an IV-tPA recanalization rate of 30% and 3 month mortality rate of 24%; occlusions in the basilar artery (BA) are not as prevalent, but are associated with a very high 3 month mortality rate of 75% and an IV-tPA recanalization rate of 33% (Saqqur et al 2007).
The MCA branches off of the internal carotid artery and extends laterally. Having an average length of approximately 2 cm (Ringelstein et al 1990), the M1 is the horizontal segment of the MCA. Three locations of interest (LOIs) were identified within the MCA: (1) the origin of the MCA; (2) the approximate end of the M1 segment, where the MCA bifurcates; (3) the point between these two. The vertebral arteries lead into the BA, which runs up along the brainstem and terminates at the posterior cerebral arteries. A fourth LOI was identified within a distal portion of the BA. The M1 and BA have average diameters of 2.9 and 3.3 mm, respectively (Moore et al 2006). In this study, the four vessel LOIs are referred to as proximal M1 (pM1), middle M1 (mM1), distal M1 (dM1), and BA (figure 4).
Figure 4.
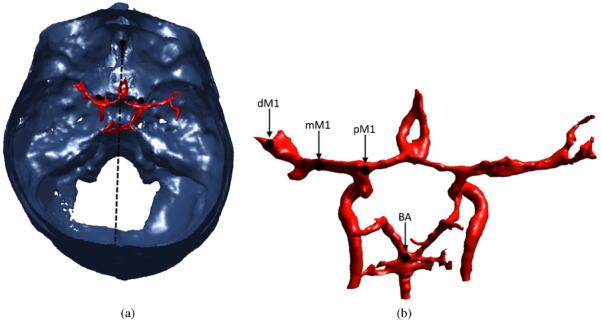
In a top–down view, vessels are shown registered to the segmented skull. The lines connecting the landmark ACPs, crista galli, and internal occipital protuberance are shown (a). Target vessel locations are shown: dM1, mM1, pM1, BA (b). The vessels on the right are oriented from the perspective of a viewer looking anteriorly into the brain, from the back of the skull.
The LOIs were localized using CT data from the Visible Human Project (Ackerman et al 1995). After thresholding the CT data, cerebral vasculature and skull structures were segmented using the process described above. The vessel locations were determined relative to identifiable landmarks on the interior of the skull, using the method described by Ammi et al (2008). The crista galli (a protuberance of bone at the front of the skull) and the internal occipital protuberance (located at the back of the skull) were used to localize the vessels in the medial/lateral direction. Anterior to the carotid arteries are two protuberances of bone called the anterior clinoid processes (ACPs). A line connecting the ACPs was used to localize the vessels in the anterior/posterior (front/back) and craniocaudal (vertical) directions. These same structures were identified in each of the cadaver skulls and then the VHP data were registered to the cadaver CT data in order to determine the relative vessel locations, and the corresponding LOIs, within each cadaver skull (figure 4). The resulting vessel locations were in agreement with the mean values that have been reported (Ringelstein et al 1990, Ammi et al 2008).
2.6. Inertial cavitation threshold
In vivo recanalization has been demonstrated in occluded rabbit femoral arteries with a sonication frequency of 1.51 MHz, a 1 ms pulse length, a 0.1% duty cycle, and an acoustic power of 215 W (Wright et al 2012). This corresponds to an approximate peak acoustic pressure of 20 MPa. This value will serve as a benchmark in evaluating transducer configurations for the treatment of stroke. Cavitation thresholds would decrease somewhat at lower frequencies. In a rabbit thigh model, cavitation thresholds have been shown to increase linearly with frequency at a rate of approximately 5.3 MPa MHz−1 (Hynynen 1991b). Using this relationship, the cavitation thresholds for blood clots can be estimated, yielding 19 and 18 MPa at 1.3 and 1.1 MHz, respectively.
2.7. Simulation specifications
The models were created and the simulations were run in MATLAB on a Dell workstation (Dell Precision T7500, Dual Quad Core E5620, 24 GB). Distributed over four cores, back propagation, amplitude adjustment, and forward propagation took approximately 24 h for a single target/frequency/array combination. Simulations targeting the geometric focus were conducted at 1.5 MHz with 1461, 2941, 8907, 15 875, 22 885, and 35 519 element arrays. Simulations targeting the four vessel locations were conducted at 1.1, 1.3, and 1.5 MHz with 2941, 8907, and 15 875 element arrays and again at 1.5 MHz with the 22 885 element array. Array configurations were evaluated based on GMIN and GAVG values. Determination of necessary margins of safety will require the completion of in vivo safety studies, which are out of scope for this study. For the purpose of comparison, array configurations with GAVG > 10 were identified to highlight situations where gains above an order of magnitude were achieved. Finally, the transducer surface intensities and acoustic powers required to achieve the estimated sonothrombolysis thresholds were determined.
3. Results
3.1. Pressure gain
Simulations were initially run at 1.5 MHz, targeting the transducer's geometric focus through a single skull. GAVG ranged from 19 to 38 and GMIN ranged from 5.7 to 12.3. GMIN did not always increase with larger element numbers, as variations in the maximum outer skull pressure dominated this gain metric. These variations vanished once element amplitudes were adjusted to create a more uniform pressure distribution, producing a GMIN range from 7.5 to 16.2. The amplitude adjustment caused the maximum outer skull pressure values to decrease, while only marginally decreasing focal pressures, thereby resulting in increases to GMIN (figure 5). This illustrates the benefit of amplitude adjustment, which is utilized to produce all results that follow. Values are quoted as mean ± standard deviation and all error bars denote standard deviations between the five skulls that were simulated.
Figure 5.
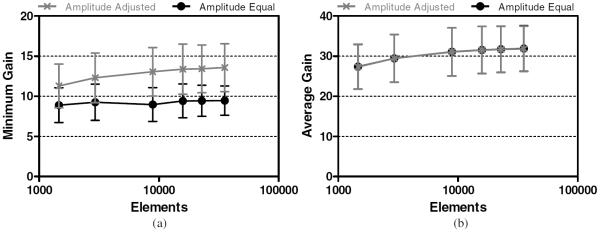
Minimum (a) and average (b) focal gain targeting the geometric focus at 1.5 MHz.
At the clinically relevant vessel locations, simulations were conducted using five different array configurations, divided into 2940, 8907, 15 875, and 22 885 elements, respectively. In all cases, pressure gains increased as the number of transducer elements was increased. However, the incremental benefit achieved in increasing the number of elements leveled off as the element count increased (figure 5).
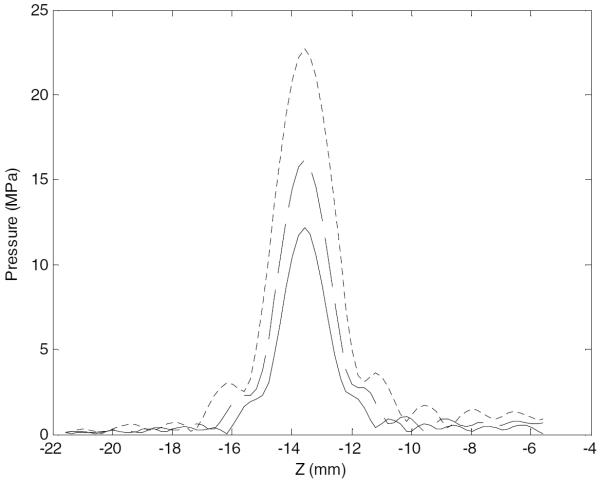
Sonication frequencies of 1.1, 1.3, and 1.5 MHz were simulated. As expected, focal peak pressures increased with decreasing frequency (figure 6). These simulations were conducted over four vessel locations, denoted by BA, pM1, mM1, and dM1. Targeting vessel locations closer to the transducer's geometric focus, at the BA and pM1, yielded the highest focal gains. Pressure gains decreased as the transducer was focused away from the geometric focus, producing moderate gains at the mM1 and the lowest gains at the dM1.
Figure 6.
Pressure along the acoustic axis, across the focus, targeting the pM1, at 1.5 MHz (solid), 1.3 MHz (dashed), 1.1 MHz (dotted). The z-axis corresponds to axial distance, with the geometric focus at z = 0 and the transducer located to the right of the plot.
The BA was the deepest target, being 25 ± 1 mm below the transducer's geometric focus and shifted 9 ± 5 mm laterally, averaged over all skulls. Results associated with the BA are presented in figure 7. For a single transducer/frequency combination, the highest GAVG achieved at the BA was 16 ± 5, with the corresponding highest GMIN being 5.9 ± 1.7. A mean GAVG value above 10 was achieved with 8907 elements at all frequencies.
Figure 7.
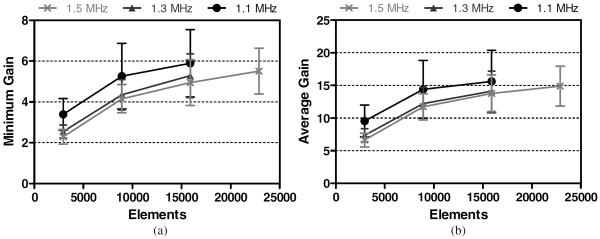
Minimum (a) and average (b) focal gains achieved at the BA for each array configuration.
All targeted vessel locations along the MCA were shallower than the BA. The pM1 was a shallower target, being 14 ± 1 mm below the transducer's geometric focus and shifted 26 ± 2 mm laterally. Results associated with the pM1 are presented in figure 8. Focal gains achieved were similar to those achieved in the BA. For a single transducer/frequency combination, the highest GAVG achieved at the pM1 was 17 ± 4, with the corresponding highest GMIN being 6.2 ± 1.3. A mean GAVG value above 10 was achieved with 8907 elements at all frequencies.
Figure 8.
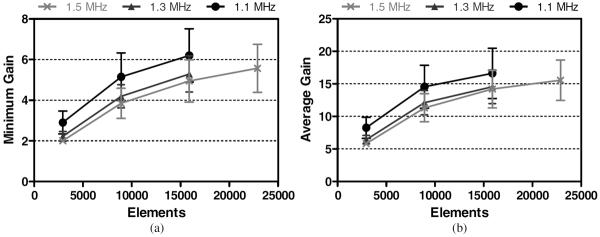
Minimum (a) and average (b) focal gains achieved at the pM1 for each array configuration.
The mM1 was located 14 ± 1 mm below the transducer's geometric focus, shifted 33 ± 2 mm laterally. Results associated with the mM1 are presented in figure 9. For a single transducer/frequency combination, the highest GAVG achieved at the mM1 was 13 ± 3, with the corresponding highest GMIN being 4.6 ± 1.1. A mean GAVG value above 10 was achieved with 8907 elements at 1.1 MHz and 15 875 elements at 1.3 and 1.5 MHz.
Figure 9.
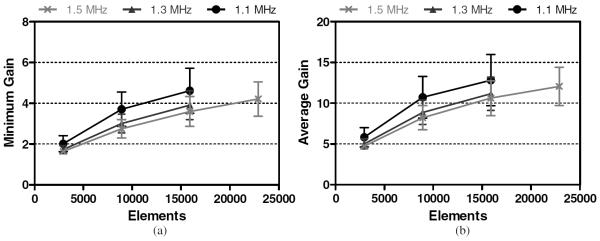
Minimum (a) and average (b) focal gains achieved at the mM1 for each array configuration.
The dM1 was located 14 ± 2 mm below the transducer's geometric focus, shifted 46 ± 2 mm laterally. Results associated with the dM1 are presented in figure 10. For a single transducer/frequency combination, the highest GAVG achieved at the dM1 was 7.3 ± 1.6, with the corresponding highest GMIN being 2.5 ± 0.5. GAVG values above 10 were not achieved the parameters simulated.
Figure 10.
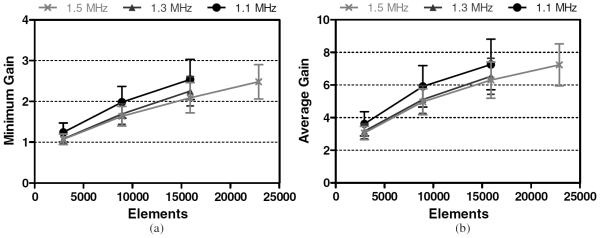
Minimum (a) and average (b) focal gains achieved at the dM1 for each array configuration.
3.2. Focal dimensions
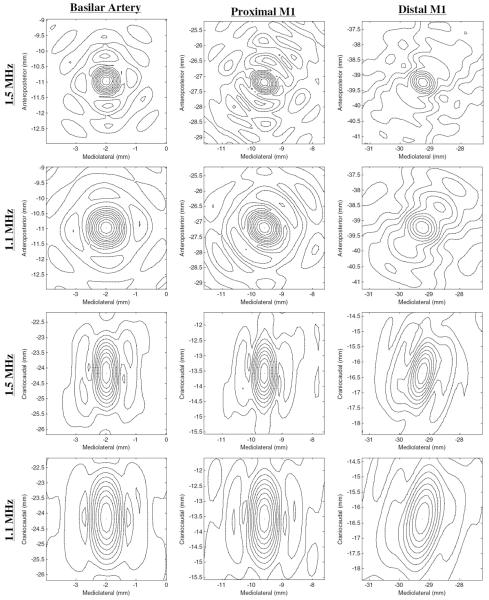
Lateral focal widths and depths of field (DOFs), calculated as the half power contours, were determined for all cases. Focal DOFs varied strongly between the three simulated frequencies and between each vessel location, but did not change significantly with changing element numbers. At 1.5 MHz, DOFs were calculated as 1.5 ± 0.1 mm for the BA location and 1.4 ± 0.1 mm for the pM1 location, the mM1 location, and the dM1 location (figure 11). The resulting focal widths did not vary significantly between vessel locations, with the maximum focal width at 1.5 MHz being 0.8 mm.
Figure 11.
Resulting pressure profiles (normalized with respect to each focal maximum pressure) using the 8907 element array, at 1.1 and 1.5 MHz in the lateral XY (top half) and axial YZ (bottom half) planes. Axes values are relative to the geometric focus at (0, 0, 0). Contours at 10% lines are plotted.
At 1.3 MHz, DOFs were calculated as 1.7 ± 0.1 mm for the BA location, 1.6 ± 0.1 mm for the pM1 location, the mM1 location, and the dM1 location, with the maximum focal width over all vessel locations being 1.0 mm. At 1.1 MHz, DOFs were calculated as 2.0 ± 0.1 mm for the BA location, 1.8 ± 0.1 mm for the pM1 location, the mM1 location, and the dM1 location, with the maximum focal width over all vessel locations being 1.2 mm (figure 11).
3.3. Power requirements
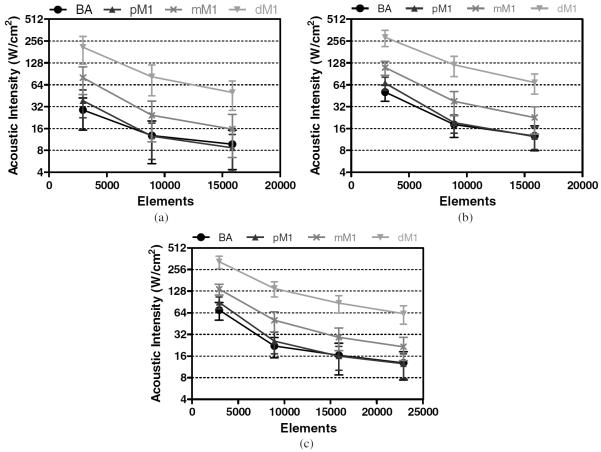
Target sonothrombolysis pressure amplitudes of 18, 19, and 20 MPa were estimated at driving frequencies of 1.1, 1.3, and 1.5 MHz, respectively. Focal pressure scales with the square root of the transducer driving intensity. Using this relationship, transducer intensity and element power values were determined that result in the estimated focal pressure targets. The acoustic intensity values are presented in figure 12 and the acoustic power requirements are presented in table 3.
Figure 12.
Transducer surface intensities required to achieve estimated target pressures at 1.1 MHz (a), 1.3 MHz (b), and 1.5 MHz (c).
Table 3.
Acoustic power requirements to achieve target sonothrombolysis pressure amplitudes.
| 1.1 MHz |
1.3 MHz |
1.5 MHz |
|||||
|---|---|---|---|---|---|---|---|
| Vessel | Elements | Total power (kW) | Power/element (W) | Total power (kW) | Power/element (W) | Total power (kW) | Power/element (W) |
| Basilar | 2941 | 41 (±19) | 14 (±7) | 72 (±18) | 24 (±6) | 100 (±30) | 34 (±9) |
| 8907 | 18 (±11) | 2.0 (±1.2) | 26 (±9) | 2.9 (±1.0) | 31 (±10) | 3.5 (±1.1) | |
| 15 875 | 14 (±8) | 0.9 (±0.5) | 18 (±7) | 1.1 (±0.4) | 23 (±11) | 1.5 (±0.7) | |
| 22 885 | 18 (±8) | 0.8 (±0.3) | |||||
| Proximal M1 | 2941 | 50 (±20) | 19 (±8) | 100 (±20) | 33 (±7) | 130 (±20) | 43 (±8) |
| 8907 | 18 (±9) | 2.0 (±1.0) | 27 (±8) | 3.1 (±0.9) | 36 (±12) | 4.1 (±1.4) | |
| 15 875 | 12 (±6) | 0.8 (±0.4) | 18 (±6) | 1.1 (±0.4) | 23 (±8) | 1.4 (±0.5) | |
| 22 885 | 18 (±7) | 0.8 (±0.3) | |||||
| Middle M1 | 2941 | 110 (±50) | 38 (±16) | 160 (±30) | 53 (±12) | 190 (±30) | 65 (±11) |
| 8907 | 30 (±20) | 4 (±2) | 54 (±19) | 6 (±2) | 70 (±20) | 8 (±3) | |
| 15 875 | 22 (±13) | 1.4 (±0.8) | 32 (±13) | 2.0 (±0.8) | 41 (±14) | 2.6 (±0.9) | |
| 22 885 | 30 (±11) | 1.3 (±0.5) | |||||
| Distal M1 | 2941 | 300 (±120) | 100 (±40) | 410 (±100) | 140 (±40) | 460 (±90) | 160 (±30) |
| 8907 | 120 (±50) | 13 (±6) | 170 (±50) | 19 (±6) | 200 (±50) | 22 (±5) | |
| 15 875 | 70 (±30) | 4.5 (±1.9) | 100 (±30) | 6.1 (±1.9) | 120 (±30) | 8 (±2) | |
| 22 885 | 90 (±30) | 3.8 (±1.1) | |||||
4. Discussion
This study investigated the feasibility of using HIFU for the treatment of stroke. The ability of each transducer array to focus through the skull was evaluated based on the magnitude of the achieved focal gain and the size of the focal region over a number of clinically relevant target locations. Element size and sonication frequency were varied to explore their effect on results.
The simulation results indicate that pressure gains of an order of magnitude are achievable with a hemispherical transducer array if the individual elements are small enough. As the target locations shifted laterally away from the center, smaller element sizes were required to achieve equivalent gains. Two gain metrics were established: the minimum pressure gain (GMIN) and average pressure gain (GAVG). Calculated as the ratio between the focal pressure and the maximum outer skull pressure, the GMIN quantified the risk of initial damage to tissue outside the skull. Element driving amplitudes were adjusted in order to reduce the magnitude of pressure hotspots, which resulted in an increase to minimum pressure gain and a corresponding reduction in risk of tissue damage. After this adjustment was applied, the two gains became correlated, approximately following the relationship: GAVG ≈ 2.9GMIN.
The reduction of sonication frequency yielded larger focal gains. However, a lower sonication frequency also increases the risk of inadvertent damage to the blood vessels surrounding the clot. At the pressure amplitudes required for clot lysis, previous experiments have demonstrated the occurrence of vessel damage at 0.68 MHz and no damage at 2.0 MHz (Hynynen and McDannold 2006), as well as no vessel damage at 1.51 MHz (Wright et al 2012). This is most likely due to the fact that the size of focus increases with decreasing frequency, resulting in an increased risk of tissue erosion outside the desired region. In addition the inertial cavitation may be more violent at the lower frequencies that allow the bubbles to grow larger prior to collapsing (Noltingk and Neppiras 1950). Simulations produced maximum focal widths of 0.8, 1.0, and 1.2 mm (at 1.5, 1.3, and 1.1 MHz, respectively), which are quite small relative to the vessel diameters of the M1 and BA (2.9 and 3.3 mm, respectively (Moore et al 2006)). Due to its deeper location, the largest maximum focal DOFs occurred at the BA: 1.6, 1.8, and 2.2 mm at 1.5, 1.3, and 1.1 MHz, respectively. However, targeting of the BA benefits from the fact that the vessel's orientation puts it in line with the longer focal axis. This is not the case for the MCA, which essentially travels perpendicularly to the longer focal axis. However, the achieved maximum focal DOFs of 1.4, 1.6, and 2.0 mm were all still less than the M1 vessel diameter. These results show that safe targeting of both the M1 and BA is theoretically possible with the simulated array configurations.
The hemispherical configuration outlined in this paper is best suited for the treatment of occlusions close to the center of the brain. The M1 segment is considered to be the location where the majority of strokes occur (51% from Saqqur et al (2007)). The simulation results indicate that adequate pressures and focal gains are achievable in the proximal portions of the M1 segment, but that treatment of the M2 segment, which is immediately distal to the M1, is probably not feasible. Furthermore, the increased power that is required to lyse targets away from the center results in increased outer skull pressures and an increased risk of tissue damage. The results indicate that the simulated transducer array configurations are well suited for targeting the distal BA. The largest potential advantage in using HIFU for the treatment of stroke may be in the BA, as there currently is not an effective treatment for occlusions of the BA. Although strokes of the BA are relatively rare, they are associated with very high mortality rates.
The acoustic powers and intensities required to achieve the estimated sonothrombolysis threshold pressures varied greatly over the simulated array configurations. Ranging from 12 ± 6 to 460 ± 90 kW, the total required acoustic powers appear to be quite large. However, since sonothrombolysis would utilize pulsed ultrasound with low duty cycles (0.1% in Wright et al (2012)), the corresponding time-averaged powers would be substantially lower. The power requirements reflect the ability of the transducer array to deposit energy past the skull into the brain, with smaller average pressure gains requiring more power to create equivalent conditions at the focus. Dividing the transducer array into smaller elements results in larger gains and lower intensity requirements, due to the increased control provided by a larger number of independent sources. Furthermore, the smaller transducer element areas require less power to reach target transducer intensities. This is a somewhat trivial result of reducing element sizes, yet it is pragmatically important since available multi-channel driving systems may limit the maximum power available to each element. To provide context to these powers, a hemispherical array (500 elements, 700–800 kHz, 30 cm diameter) was used previously to deliver 1080 W of acoustic power, which corresponds to 2.16 W per element (Hynynen et al 2004). The simulated powers required for sonothrombolysis are a fair amount larger— over an order of magnitude in most cases. However, the required per-element powers drop below 2.16 W in some cases, which suggests that the high power requirements would be achievable, if new multi-channel driver technology was developed. Similarly, the number of transducer elements is approximately an order of magnitude larger than that constructed so far (Song and Hynynen 2010) and new arrays would be needed in order to make this a clinical reality. Nevertheless, there are no major technical barriers for developing the required technology.
This study investigated the use of focused ultrasound alone for thrombolysis. It is expected that the arrays proposed here could also be used with thrombolytic agents, such as tPA (Alexandrov et al 2004) or microbubbles (Culp et al 2011), except that the power requirements would be reduced at least two orders of magnitude. It is expected that the sharp focusing available with these arrays could significantly enhance the effectiveness of those treatments and potentially minimize or eliminate side-effects observed when non-focused ultrasound is used (Molina et al 2009, Daffertshofer et al 2005).
5. Conclusion
This study investigated the feasibility of using HIFU for the treatment of stroke through an intact skull. The effect of varying sonication parameters was explored and a set of technical design constraints were identified. The simulation results indicate that the optimal design of a hemispherical phased array for the treatment of stroke requires a balancing of a number of parameters. Firstly, the design needs to be clinically relevant. Being able to only treat occlusions at the transducer's geometric focus would not be useful, while only being able to target the BA and pM1 locations would preclude it from use for the majority of strokes. Therefore, an optimal design should be evaluated based on its ability to target the mM1. Based on the results of this study, the simulated arrays with 15 875, 15 875, and 8907 elements were able to achieve mean gains above an order of magnitude at frequencies of 1.5, 1.3, and 1.1 MHz, respectively. These array configurations correspond to required total acoustic powers of 41, 32, and 30 kW, acoustic intensities of 29, 23, and 24 W cm−2, and per element powers of 2.6, 2.0, and 4 W to produce the respective estimated threshold pressures (table 3). Element sizes can be reduced further based on constraints imposed by available multi-channel driving technology. The choice of frequency represents a trade-off between risk and complexity. Further studies need to be completed to determine the minimum safe sonication frequencies for stroke treatments.
Acknowledgments
The authors would like to acknowledge A Pulkkinen for his technical guidance, Drs S Black and B Lam for their clinical guidance, and B Lucht and J Song for their general assistance. This work was supported by grants from the National Health Institute (no R01EB00903) and the Canada Research Chair program (CRC).
References
- Ackerman MJ, Spitzer VM, Scherzinger AL, Whitlock DG. The Visible Human data set: an image resource for anatomical visualization. Medinfo. 1995;8(Pt 2):1195–8. [PubMed] [Google Scholar]
- Alexandrov AV, et al. Ultrasound-enhanced systemic thrombolysis for acute ischemic stroke. N. Engl. J. Med. 2004;351:2170–8. doi: 10.1056/NEJMoa041175. [DOI] [PubMed] [Google Scholar]
- Ammi AY, Mast TD, Huang IH, Abruzzo TA, Coussios CC, Shaw GJ, Holland CK. Characterization of ultrasound propagation through ex-vivo human temporal bone. Ultrasound Med. Biol. 2008;34:1578–89. doi: 10.1016/j.ultrasmedbio.2008.02.012. [DOI] [PMC free article] [PubMed] [Google Scholar]
- Aubry JF, Tanter M, Pernot M, Thomas JL, Fink M. Experimental demonstration of noninvasive transskull adaptive focusing based on prior computed tomography scans. J. Acoust. Soc. Am. 2003;113:84–93. doi: 10.1121/1.1529663. [DOI] [PubMed] [Google Scholar]
- Azuma T, Kawabata K, Umemura S, Ogihara M, Kubota J, Sasaki A, Furuhata H. Schlieren observation of therapeutic field in water surrounded by cranium radiated from 500 kHz ultrasonic sector transducer. 2004 IEEE Ultrasonics Symp. 2004;2:1001–4. [Google Scholar]
- Baron C, Aubry JF, Tanter M, Meairs S, Fink M. Simulation of intracranial acoustic fields in clinical trials of sonothrombolysis. Ultrasound Med. Biol. 2009;35:1148–58. doi: 10.1016/j.ultrasmedbio.2008.11.014. [DOI] [PubMed] [Google Scholar]
- Clement GT, Hynynen K. Correlation of ultrasound phase with physical skull properties. Ultrasound Med. Biol. 2002;28:617–24. doi: 10.1016/s0301-5629(02)00503-3. [DOI] [PubMed] [Google Scholar]
- Clement GT, Sun J, Giesecke T, Hynynen K. A hemisphere array for non-invasive ultrasound brain therapy and surgery. Phys. Med. Biol. 2000;45:3707–19. doi: 10.1088/0031-9155/45/12/314. [DOI] [PubMed] [Google Scholar]
- Clement GT, White PJ, Hynynen K. Enhanced ultrasound transmission through the human skull using shear mode conversion. J. Acoust. Soc. Am. 2004;115:1356–64. doi: 10.1121/1.1645610. [DOI] [PubMed] [Google Scholar]
- Cobbold RSC. Foundations of Biomedical Ultrasound. Oxford University Press; Oxford: 2007. [Google Scholar]
- Connor CW, Clement GT, Hynynen K. A unified model for the speed of sound in cranial bone based on genetic algorithm optimization. Phys. Med. Biol. 2002;47:3925–44. doi: 10.1088/0031-9155/47/22/302. [DOI] [PubMed] [Google Scholar]
- Connor CW, Hynynen K. Patterns of thermal deposition in the skull during transcranial focused ultrasound surgery. IEEE Trans. Biomed. Eng. 2004;51:1693–706. doi: 10.1109/TBME.2004.831516. [DOI] [PubMed] [Google Scholar]
- Culp WC, et al. Successful microbubble sonothrombolysis without tissue-type plasminogen activator in a rabbit model of acute ischemic stroke. Stroke. 2011;42:2280–5. doi: 10.1161/STROKEAHA.110.607150. [DOI] [PMC free article] [PubMed] [Google Scholar]
- Daffertshofer M, Gass A, Ringleb P, Sitzer M, Sliwka U, Els T, Sedlaczek O, Koroshetz WJ, Hennerici MG. Transcranial low-frequency ultrasound-mediated thrombolysis in brain ischemia: increased risk of hemorrhage with combined ultrasound and tissue plasminogen activator: results of a phase II clinical trial. Stroke. 2005;36:1441–6. doi: 10.1161/01.STR.0000170707.86793.1a. [DOI] [PubMed] [Google Scholar]
- Duck FA. Physical Properties of Tissue: A Comprehensive Reference Book. Academic; New York: 1990. p. 346. [Google Scholar]
- Fan X, Hynynen K. The effect of wave reflection and refraction at soft tissue interfaces during ultrasound hyperthermia treatments. J. Acoust. Soc. Am. 1992;91:1727–36. doi: 10.1121/1.402452. [DOI] [PubMed] [Google Scholar]
- Fan X, Hynynen K. The effects of curved tissue layers on the power deposition patterns of therapeutic ultrasound beams. Med. Phys. 1994;21:25–34. doi: 10.1118/1.597250. [DOI] [PubMed] [Google Scholar]
- Hynynen K. The role of nonlinear ultrasound propagation during hyperthermia treatments. Med. Phys. 1991a;18:1156–63. doi: 10.1118/1.596626. [DOI] [PubMed] [Google Scholar]
- Hynynen K. The threshold for thermally significant cavitation in dog's thigh muscle in vivo. Ultrasound Med. Biol. 1991b;17:157–69. doi: 10.1016/0301-5629(91)90123-e. [DOI] [PubMed] [Google Scholar]
- Hynynen K, Clement G. Clinical applications of focused ultrasound—the brain. Int. J. Hyperthermia. 2007;23:193–202. doi: 10.1080/02656730701200094. [DOI] [PubMed] [Google Scholar]
- Hynynen K, Clement GT, McDannold N, Vykhodtseva N, King R, White PJ, Vitek S, Jolesz FA. 500-element ultrasound phased array system for noninvasive focal surgery of the brain: a preliminary rabbit study with ex vivo human skulls. Magn. Reson. Med. 2004;52:100–7. doi: 10.1002/mrm.20118. [DOI] [PubMed] [Google Scholar]
- Hynynen K, McDannold N. MRI-guided focused ultrasound for local tissue ablation and other image-guided interventions in. In: Wu J, Nyborg W, editors. Emerging Therapeutic Ultrasound. World Scientific; Singapore: 2006. p. 167. [Google Scholar]
- Martin E, Jeanmonod D, Morel A, Zadicario E, Werner B. High-intensity focused ultrasound for noninvasive functional neurosurgery. Ann. Neurol. 2009;66:858–61. doi: 10.1002/ana.21801. [DOI] [PubMed] [Google Scholar]
- Maxwell AD, Cain CA, Duryea AP, Yuan L, Gurm HS, Xu Z. Noninvasive thrombolysis using pulsed ultrasound cavitation therapy—histotripsy. Ultrasound Med. Biol. 2009;35:1982–94. doi: 10.1016/j.ultrasmedbio.2009.07.001. [DOI] [PMC free article] [PubMed] [Google Scholar]
- Maxwell AD, Owens G, Gurm HS, Ives K, Myers DD, Jr, Xu Z. Noninvasive treatment of deep venous thrombosis using pulsed ultrasound cavitation therapy (histotripsy) in a porcine model. J. Vasc. Interv. Radiol. 2011;22:369–77. doi: 10.1016/j.jvir.2010.10.007. [DOI] [PMC free article] [PubMed] [Google Scholar]
- McDannold N, Clement GT, Black P, Jolesz F, Hynynen K. Transcranial magnetic resonance imaging-guided focused ultrasound surgery of brain tumors: initial findings in 3 patients. Neurosurgery. 2010;66:323–32. doi: 10.1227/01.NEU.0000360379.95800.2F. (discussion) [DOI] [PMC free article] [PubMed] [Google Scholar]
- Medel R, Crowley RW, McKisic MS, Dumont AS, Kassell NF. Sonothrombolysis: an emerging modality for the management of stroke. Neurosurgery. 2009;65:979–93. doi: 10.1227/01.NEU.0000350226.30382.98. [DOI] [PubMed] [Google Scholar]
- Molina CA, et al. Transcranial ultrasound in clinical sonothrombolysis (TUCSON) trial. Ann. Neurol. 2009;66:28–38. doi: 10.1002/ana.21723. [DOI] [PubMed] [Google Scholar]
- Moore S, David T, Chase JG, Arnold J, Fink J. 3D models of blood flow in the cerebral vasculature. J. Biomech. 2006;39:1454–63. doi: 10.1016/j.jbiomech.2005.04.005. [DOI] [PubMed] [Google Scholar]
- Noltingk BE, Neppiras EA. Cavitation produced by ultrasonics. Proc. Phys. Soc. B. 1950;63:674. [Google Scholar]
- Pichardo S, Sin VW, Hynynen K. Multi-frequency characterization of the speed of sound and attenuation coefficient for longitudinal transmission of freshly excised human skulls. Phys. Med. Biol. 2011;56:219–50. doi: 10.1088/0031-9155/56/1/014. [DOI] [PMC free article] [PubMed] [Google Scholar]
- Pulkkinen A, Hynynen K. Computational aspects in high intensity ultrasonic surgery planning. Comput. Med. Imaging Graph. 2010;34:69–78. doi: 10.1016/j.compmedimag.2009.08.001. [DOI] [PubMed] [Google Scholar]
- Ringelstein EB, Kahlscheuer B, Niggemeyer E, Otis SM. Transcranial Doppler sonography: anatomical landmarks and normal velocity values. Ultrasound Med. Biol. 1990;16:745–61. doi: 10.1016/0301-5629(90)90039-f. [DOI] [PubMed] [Google Scholar]
- Roger VL, et al. Heart disease and stroke statistics—2011 update: a report from the American Heart Association. Circulation. 2011;123:e18–209. doi: 10.1161/CIR.0b013e3182009701. [DOI] [PMC free article] [PubMed] [Google Scholar]
- Rosenschein U, Frimerman A, Laniado S, Miller HI. Study of the mechanism of ultrasound angioplasty from human thrombi and bovine aorta. Am. J. Cardiol. 1994;74:1263–6. doi: 10.1016/0002-9149(94)90560-6. [DOI] [PubMed] [Google Scholar]
- Rosenschein U, Furman V, Kerner E, Fabian I, Bernheim J, Eshel Y. Ultrasound imaging-guided noninvasive ultrasound thrombolysis: preclinical results. Circulation. 2000;102:238–45. doi: 10.1161/01.cir.102.2.238. [DOI] [PubMed] [Google Scholar]
- Saqqur M, et al. Site of arterial occlusion identified by transcranial Doppler predicts the response to intravenous thrombolysis for stroke. Stroke. 2007;38:948–54. doi: 10.1161/01.STR.0000257304.21967.ba. [DOI] [PubMed] [Google Scholar]
- Song J, Hynynen K. Feasibility of using lateral mode coupling method for a large scale ultrasound phased array for noninvasive transcranial therapy. IEEE Trans. Biomed. Eng. 2010;57:124–33. doi: 10.1109/TBME.2009.2028739. [DOI] [PMC free article] [PubMed] [Google Scholar]
- Song J, Pulkkinen A, Huang Y, Hynynen K. Investigation of standing-wave formation in a human skull for a clinical prototype of a large-aperture, transcranial MR-guided focused ultrasound (MRgFUS) phased array: an experimental and simulation study. IEEE Trans. Biomed. Eng. 2012;59:435–44. doi: 10.1109/TBME.2011.2174057. [DOI] [PMC free article] [PubMed] [Google Scholar]
- Sun J, Hynynen K. Focusing of therapeutic ultrasound through a human skull: a numerical study. J. Acoust. Soc. Am. 1998;104:1705–15. doi: 10.1121/1.424383. [DOI] [PubMed] [Google Scholar]
- Sun J, Hynynen K. The potential of transskull ultrasound therapy and surgery using the maximum available skull surface area. J. Acoust. Soc. Am. 1999;105:2519–27. doi: 10.1121/1.426863. [DOI] [PubMed] [Google Scholar]
- Treece GM, Prager RW, Gee AH, Berman L. Surface interpolation from sparse cross sections using region correspondence. IEEE Trans. Med. Imaging. 2000;19:1106–14. doi: 10.1109/42.896787. [DOI] [PubMed] [Google Scholar]
- Tsivgoulis G, et al. Safety and efficacy of ultrasound-enhanced thrombolysis: a comprehensive review and meta-analysis of randomized and nonrandomized studies. Stroke. 2010;41:280–7. doi: 10.1161/STROKEAHA.109.563304. [DOI] [PubMed] [Google Scholar]
- White J, Clement GT, Hynynen K. Transcranial ultrasound focus reconstruction with phase and amplitude correction. IEEE Trans. Ultrason. Ferroelectr. Freq. Control. 2005;52:1518–22. doi: 10.1109/tuffc.2005.1516024. [DOI] [PubMed] [Google Scholar]
- White PJ, Clement GT, Hynynen K. Longitudinal and shear mode ultrasound propagation in human skull bone. Ultrasound Med. Biol. 2006;32:1085–96. doi: 10.1016/j.ultrasmedbio.2006.03.015. [DOI] [PMC free article] [PubMed] [Google Scholar]
- Wright C, Hynynen K, Goertz D. In vitro and in vivo high intensity focused ultrasound thrombolysis. Invest. Radiol. 2012;47:217–25. doi: 10.1097/RLI.0b013e31823cc75c. [DOI] [PMC free article] [PubMed] [Google Scholar]


