

Abstract
Functional small biomolecules play indispensable roles inside cells. However, sensitive and specific visualization of these molecules in living systems has proven to be highly challenging. Herein, we report stimulated Raman scattering imaging of alkyne tags as a general strategy for studying a broad spectrum of small biomolecules in live cells and animals. We demonstrate this technique by tracking alkyne-bearing drugs in mouse tissues, and visualizing de novo synthesis of DNA, RNA, proteomes, phospholipids and triglycerides, respectively, through metabolic incorporation of alkyne-tagged small precursors.
Innovations in light microscopy have tremendously expanded our knowledge at the microscopic level. In particular, fluorescence microscopy has revolutionized the way modern life sciences are conducted1. Common fluorescent tags, however, are relatively bulky, and, when tagged to small biomolecules, often significantly alter their normal biological activities. A conceptually opposite strategy is label-free imaging utilizing intrinsic contrasts2-4. However, label-free approaches are often hindered by poor molecular selectivity. Hence, how to specifically and sensitively image small biomolecules remains highly challenging despite their immense importance in biomedicine.
To develop an effective imaging modality for small biomolecules, we report a general strategy by harnessing the emerging stimulated Raman scattering (SRS) microscopy coupled to alkynes (i.e., C≡C) as nonlinear vibrational tags (Fig. 1a). We chose alkynes because they possess desirable chemical and spectroscopic features. Chemically, alkynes are small – only two atoms, exogenous – nearly non-existing inside cells, and bioorthogonal – inert to reactions with endogenous biomolecules. In fact, these properties render alkynes a key player in bioorthogonal chemistry, which uses alkyne-tagged precursor labeling with subsequent azide-tagged probe detection5-12. However, such a click-chemistry approach usually requires non-physiological cell fixation for copper-catalyzed reaction7-11, and even the copper-free version still has kinetics and background issues12. Spectroscopically, alkynes are Raman-active with distinct characteristics: the C≡C stretching motion exhibits a substantial change of polarizability13, displaying a sharp Raman peak around 2125 cm−1, which lies desirably in a cell-silent spectral region (Fig. 1b). Comparing to another popular Raman tag of C-D14, alkynes produce about 40 times higher peaks, which has been utilized by recent spontaneous Raman studies15,16. However, the feeble spontaneous Raman scattering accompanied by its extremely long acquisition time (~ 49 min for 127 lines) limits dynamic imaging in live systems.
Figure 1. Bond-selective SRS imaging of alkynes as nonlinear vibrational tags.
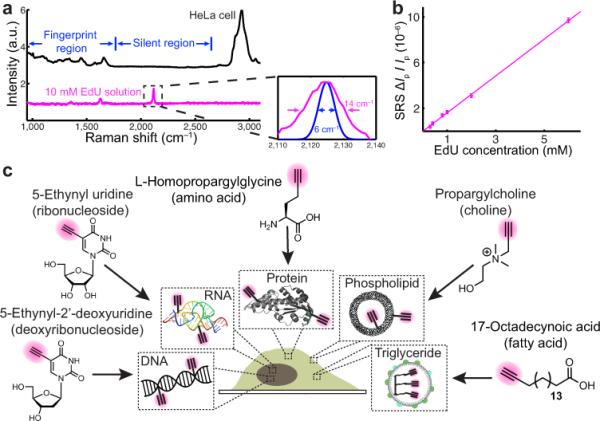
a, Apparatus (detail in online methods). In the resonant condition, the Pump and Stokes photons, which jointly accelerate the vibrational excitation via SRS, experience stimulated Raman loss and Raman gain, respectively. b, Spontaneous Raman spectra of HeLa cells and 10 mM EdU solution. Inset: the calculated SRS excitation profile (FWHM 6 cm−1, blue) is well fitted within the 2125 cm−1 alkyne peak (FWHM 14 cm−1, magenta). c, Linear dependence of stimulated Raman loss signals (2125 cm−1) with EdU concentrations under a 100 μs acquisition time. d, The metabolic incorporation scheme for a broad spectrum of alkyne-tagged small precursors. a.u. arbitrary units.
The coupling of SRS microscopy to alkyne tags reported here offers the superb sensitivity, specificity and biocompatibility needed for probing complex living systems. First, SRS accelerates the otherwise infrequent vibrational excitation by 107 times17,18, rendering a quantum leap of sensitivity (i.e., detectability and speed) over the spontaneous counterpart3. Second, a 6-ps pulse width is chosen so that the spectral width of the excitation profile fits well within that of alkyne (Fig. 1b), assuring both an efficient and a selective nonlinear excitation. Third, the background-free SRS18 matches with alkynes’ spectral bioorthogonality, whereas spontaneous Raman suffers from auto-fluorescence and CARS from non-resonant background3. Fourth, we employ near-infrared laser wavelengths for enhanced tissue penetration, intrinsic 3D sectioning (due to nonlinear excitation) and minimal photo-toxicity.
The first experimental coupling of SRS with an alkyne was conducted in EdU solution (Fig. 1c). Taken under a fast imaging speed of 100 μs, the detection limit is determined to be 200 μM for 5-ethynyl-2'-deoxyuridine (EdU), an alkyne-tagged thymidine analogue (Fig. 1d)7, corresponding to 12,000 alkynes within the laser focus. This is approaching the shot-noise limit (ΔIp/Ip ~ 2×10⁻⁷) of the Pump beam. We then pursued the general imaging applicability to a broad spectrum of small biomolecules of the alkyne-tagged deoxyribonucleoside, ribonucleoside, amino acid, choline and fatty acid (Fig. 1d), whose metabolic incorporation has been thoroughly tested in bioorthogonal chemistry studies7-11.
We first imaged metabolic uptaking of EdU for de novo DNA synthesis, a hallmark of proliferating cells, the study of which is useful during development, cancer and regeneration. HeLa cells grown in media with EdU show a sharp Raman peak at 2125 cm−1 in the cell-silent region (Fig. 2a). The live-cell SRS image reveals metabolic incorporation of EdU into the newly synthesized genome during cell cycle (Fig. 2b, alkyne-on). The off-resonance SRS image (alkyne-off) of the same set of cells is background-free, confirming the purely chemical contrast of SRS. No EdU signal shows up in control cells with hydroxyurea (a DNA synthesis inhibitor), whereas the 2845 cm−1 (lipid) image verifies normal cell morphology. Moreover, a dividing cell incorporated with EdU is tracked by time-lapse SRS imaging every 5 min during mitosis (Fig. 2c), demonstrating superb acquisition speed and compatibility with live dynamics, nearly impossible with spontaneous Raman15,16. Furthermore, our method is also applicable to multicellular organisms. C. elegans, an important animal model for biomedical studies, incorporated with EdU is visualized with clear indication of actively proliferating cells (Supplementary Fig. 1).
Figure 2. Live SRS imaging of de novo synthesis of DNA, RNA, proteomes, phospholipids and triglycerides by metabolic incorporation of alkyne-tagged small precursors.

a, Raman spectra of cells incubated with EdU, EU, Hpg, propargylcholine and 17-octadecynoic acid (17-ODYA). b, 2125 cm−1 images of live cells incubated with 100 μM EdU (alkyne-on) and with both 100 μM EdU and 10 mM hydroxyurea (Control). c, Time-lapse imaging of a dividing cell incubated with EdU (100 μM). d, 2125 cm−1 images of live cells incubated with 2 mM EU (alkyne-on) and with both 2 mM EU and 200 nM actinomycin D (Control). e, Pulse-chase imaging of RNA turnover in cells incubated with 2 mM EU for 12 h and then changed to regular media. f, 2125 cm−1 images of live cells incubated with 2 mM Hpg (alkyne-on) and with both 2 mM Hpg and 2 mM methionine (Control). g, 2142 cm−1 image of live neurons incubated with 1 mM propargylcholine (alkyne-on). h, 2125 cm−1 image of live macrophages incubated with 400 μM 17-ODYA (alkyne-on). i, 2125 cm−1 image of C. elegans fed with 17-ODYA (alkyne-on). j, Dual-color SRS images of simultaneous EdU (2125 cm−1, magenta) and propargylcholine (2142 cm−1, green) incorporation. For b, d and f, 2000 cm−1 (alkyne-off) images and 1655 cm−1 (amide) images display the same set of cells as in the alkyne-on images; the 2845 cm−1 (lipid) images capture the same cells as in the control images. Scale bars, 10 μm. Representative images of 10– 15 trials. a.u. arbitrary units.
We next probed biosynthetic labeling of 5-ethynyl uridine (EU), an alkyne-tagged uridine analogue8, for RNA transcription and turnover (Fig. 1d). A 2125 cm−1 Raman peak is detected in HeLa cells incorporated with EU (Fig. 2a). The alkyne-on image (Fig. 2d) reveals a localized EU pattern inside the nucleus with higher abundance in the nucleoli (arrow indicated), which are major compartments of rRNA-rich ribosomal assembly. The signal nearly disappears in control with an RNA synthesis inhibitor, actinomycin D. The turnover dynamics are further demonstrated by pulse-chase SRS imaging (Fig. 2e), indicative of a short nuclear RNA lifetime (~ 3h) in live HeLa cells.
Many intricate biological processes such as long-term memory require protein synthesis in a spatiotemporal dependent manner. Here, we imaged L-Homopropargylglycine (Hpg), which is an alkyne-tagged analogue of methionine9 (an essential amino acid), to visualize newly synthesized proteomes (Fig. 1d). HeLa cells growing in the Hpg supplemented methionine-deficient media display a small 2125 cm−1 peak (Fig. 2a), about 20 times lower than the alkyne peak of 10 mM EdU solution (Fig. 1b). The corresponding alkyne-on image (Fig. 2f) shows the distribution of newly synthesized proteins with spatial enrichment in the nucleoli (arrow indicated), which involve rapid proteomic exchange. Judging from both the spectrum and the image (with average S/B above 2) from Hpg, the detection limit of alkynes in mammalian cells is approaching 200 μM under 100 μs of pixel dwell time, similar to that from EdU solution. The Hpg signal is well retained in cells that were incubated with Hpg and then fixed (Supplementary Fig. 2), indicating little contribution from freely diffusive Hpg. Furthermore, by adding methionine (with a 500-times faster incorporation rate) to compete with Hpg, the signal disappears as expected (Fig. 2f, control)9. This is the first time that an unnatural amino acid is detected in live cells by vibrational microscopy. Note that spatial patterns of EdU, EU and Hpg incorporations in live cells have been verified by performing click chemistry on fixed cells (Supplementary Fig. 3).
We then monitored metabolic incorporation of alkyne-tagged choline and fatty acids, respectively (Fig. 1d). Hippocampal neurons with propargylcholine present a clear 2142 cm−1 Raman peak (Fig. 2a). Such a frequency shift from 2125 cm−1 is due to the positive charge on the nearby nitrogen (Fig. 1d). As revealed by enzymatic assays (Supplementary Fig. 4), the alkyne-on signal (Fig. 2g) mainly originates from newly synthesized choline phospholipids10. For fatty acids, we incubated 17-octadecynoic acid (17-ODYA) with THP-1 macrophages, which actively scavenge cholesterol and fatty acids19. The alkyne-on image (Fig. 2h) depicts intracellular formation of numerous lipid droplets, indicative of transformation into foam cells, a hallmark of early atherosclerosis. For multi-cellular organisms, C. elegans fed with 17-ODYA displays a distribution of newly up-taken fatty acids which mainly exist in the form of triglycerides inside lipid droplets (Fig. 2i). Such a fat accumulation process could serve as a useful model for studying obesity and diabetes20. Moreover, thanks to the sharp Raman peak of the alkyne moiety and its sensitivity to local environment, the alkyne peak of propargylcholine is well resolved from the others (Fig. 2a). Dual-color imaging of simultaneous incorporation of propargylcholine (2142 cm−1) and EdU (2125 cm−1) is hence demonstrated (Fig. 2j).
Finally, we tracked alkyne-bearing drug delivery (Supplementary Figs. 5 and 6) in animal tissues by taking advantage of SRS's intrinsic 3D sectioning. Unlike bulky fluorophores, alkynes have little perturbation to pharmacokinetics, and are common moieties in many pharmaceuticals. We chose terbinafine hydrochloride (TH), a FDA approved alkyne-bearing antifungal skin drug, and imaged its drug delivery pathways inside mouse ear tissue to a depth of about 100 μm by targeting its internal alkyne at 2230 cm−1. The captured TH images at various depths all exhibit patterns that highly resemble lipid distributions but not protein distributions, suggesting that TH penetrates into tissues through the lipid instead of the protein phase, consistent with its lipophilic nature. Our technique should be applicable to tracking other drugs after proper alkyne derivatization.
In conclusion, we report a general strategy to image small and biologically vital molecules in live cells by coupling SRS microscopy with alkyne vibrational tags. Other nonlinear Raman techniques such as CARS and its derivatives might also be able to detect alkynes but with varying degrees of technical complications3, 17. When comparing with other attempts, our major advantages lie in the superior sensitivity, specificity and compatibility with dynamics of live cells and animals. Hence SRS imaging of alkynes may do for small biomolecules what fluorescence imaging of fluorophores has done for larger species.
ONLINE METHODS
Bond-selective stimulated Raman scattering (SRS) microscopy
An integrated laser system (picoEMERALD, Applied Physics & Electronics, Inc) was chosen as the light source for both Pump and Stokes beams. Briefly, picoEMERALD provides an output pulse train at 1064 nm with 6 ps pulse width and 80 MHz repetition rate, which serves as the Stokes beam. The frequency doubled beam at 532 nm is used to synchronously seed a picosecond optical parametric oscillator (OPO) to produce a mode-locked pulse train with 5~6 ps pulse width (the idler beam of the OPO is blocked with an interferometric filter). The output wavelength of the OPO is tunable from 720 to 990 nm, which serves as the Pump beam. The intensity of the 1064 nm Stokes beam is modulated sinusoidally by a built-in electro-optic modulator at 8 MHz with a modulation depth of more than 95%. The Pump beam is then spatially overlapped with the Stokes beam by using a dichroic mirror inside picoEMERALD. The temporal overlap between Pump and Stokes pulse trains is ensured with a built-in delay stage and optimized by the SRS signal of pure dodecane liquid at the microscope.
Pump and Stokes beams are coupled into an inverted multiphoton laser-scanning microscope (FV1200MPE, Olympus) optimized for near-IR throughput. A 60X water objective (UPlanAPO/IR, 1.2 N.A., Olympus) with high near-IR transmission is used for all cell imaging. The Pump/Stokes beam size is matched to fill the back-aperture of the objective. The forward going Pump and Stokes beams after passing through the sample are collected in transmission with a high N.A. condenser lens (oil immersion, 1.4 N.A., Olympus) which is aligned following Kohler illumination. A telescope is then used to image the scanning mirrors onto a large area (10 by 10 mm) Si photodiode (FDS1010, Thorlabs) to descan beam motion during laser scanning. The photodiode is reverse biased by 64 V from a DC power supply to increase both the saturation threshold and response bandwidth. A high O.D. bandpass filter (890/220 CARS, Chroma Technology) is placed in front of the photodiode to block the Stokes beam completely and to transmit the Pump beam only.
The output current of the photodiode is electronically pre-filtered by an 8-MHz band-pass filter (KR 2724, KR electronics) to suppress both the 80 MHz laser pulsing and the low-frequency fluctuations due to laser scanning cross the scattering sample. It is then fed into a radio frequency lock-in amplifier (SR844, Stanford Research Systems) terminated with 50 Ω to demodulate the stimulated Raman loss signal experienced by the Pump beam. The in-phase X-output of the lock-in amplifier is fed back into the analog interface box (FV10-ANALOG) of the microscope. The time constant is set for 10 μs (the shortest available with no additional filter applied). The current SRS imaging speed is limited by the shortest time constant available from the lock-in amplifier (SR844). For all imaging, 512 by 512 pixels are acquired for one frame with a 100 μs of pixel dwell time (26 s per frame) for laser scanning and 10 μs of time constant from the lock-in amplifier. Laser powers after 60X IR objective used for imaging are: 130 mW for modulated Stokes beam; 120 mW for the Pump beam in 2133 cm−1, 2142 cm−1, 2000 cm−1 and 1655 cm−1 channels, 85 mW for the Pump beam in 2230 cm−1 and 2300 cm−1 channels, and 50 mW for Pump beam in 2845 cm−1 channels.
Spontaneous Raman Spectroscopy
The spontaneous Raman spectra were acquired using a laser confocal Raman microscope (Xplora, Horiba Jobin Yvon) at room temperature. A 12 mW (after the microscope objective), 532 nm diode laser was used to excite the sample through a 50X, N.A.=0.75 air objective (MPlan N, Olympus). The total data acquisition time was 300 s using the LabSpec 6 software. All the spontaneous Raman spectra have subtracted the PBS solution background.
Materials
5-Ethynyl-2'-deoxyuridine (EdU) (T511285), 17-Octadecynoic acid (17-ODYA) (O8382), DMEM medium without L-methionine, L-cystine and L-glutamine (D0422), L-methionine (M5308), L-cystine (C7602), 2-Mercaptoethanol (M3148) and Phorbol 12-myristate 13-acetate (P1585) were purchased from Sigma-Aldrich. 5-Ethynyl Uridine (EU) (E-10345), Homopropargylglycine (Hpg) (C10186), Alexa Fluor® 488 Azide (A10266), Click-iT® Cell Reaction Buffer Kit (C10269), DMEM medium (11965), FBS (10082), penicillin/streptomycin (15140), L-glutamine (25030), Neurobasal A Medium (10888) and B27 supplement (17504) were purchased from Invitrogen. RPMI-1640 Medium (30-2001) was purchased from ATCC. BCS (hyclone SH30072) was purchased from Fisher Scientific.
DMEM culture medium was made by adding 10% (vol/vol) FBS and 1% (vol/vol) penicillin/streptomycin to the DMEM medium. Methionine-deficient culture medium was made by supplying 4 mM L-glutamine, 0.2 mM L-cystine, 10% FBS and 1% penicillin/streptomycin to the DMEM medium without L-methionine, L-cystine and L-glutamine. RPMI-1640 culture medium was made of supplying the RPMI-1640 medium with 10% FBS, 1% penicillin/streptomycin and 50 μM 2-Mercaptoethanol. Neuron culture medium was made of Neurobasal A Medium adding with 1X B27 supplement and 0.5 mM glutamine. Culture medium for NIH3T3 cells was made by adding 10% (vol/vol) BCS and 1% (vol/vol) penicillin/streptomycin to the DMEM medium.
Propargylcholine synthesis
Propargylcholine was synthesized according to reference (10). 3 mL propargyl bromide (80 wt. % solution in toluene) were added dropwise to 3 g 2-dimethylaminoethanol in 10 mL anhydrous THF on ice under argon gas protection and stirring. The ice bath was removed and the mixture was kept stirring at room temperature overnight. The white solids were filtered the next day and washed extensively with cold anhydrous THF to obtain 5 g pure propargylcholine bromide. All chemicals here are purchased from Sigma-Aldrich. NMR spectrum was recorded on a Bruker 400 (400MHz) Fourier Transform (FT) NMR spectrometers at the Columbia University Chemistry Department. 1H NMR spectra are tabulated in the following order: multiplicity (s, singlet; d, doublet; t, triplet; m, multiplet), number of protons. 1H NMR (400 MHz, D2O) δ ppm: 4.37 (d, J = 2.4 Hz, 2H); 4.10 (m, 2H); 3.66 (t, J = 4.8 Hz, 2H); 3.28 (s, 6H); MS (APCI+) m/z Calcd.for C7H14NO [M]+ :128.19. Found: 128.26.
Sample preparation for SRS imaging of live cells and organisms (Figs. 2)
For all SRS imaging experiments of HeLa cells: HeLa cells were first seeded on coverslips with a density of 1×10⁵/mL in petri dishes with 2 mL DMEM culture medium for 20 h at 37 °C and 5% CO2.
EdU experiment, DMEM culture medium was then changed to DMEM medium (FBS-free) for 24 h for cell cycle synchronization. After synchronization, medium was replaced back to DMEM culture medium and EdU (10 mM stock in PBS) was simultaneously added to a concentration of 100 μM for 15 h.
EU experiment, EU (100 mM stock in PBS) was added to the DMEM culture medium directly to a concentration of 2 mM for 7 h.
Hpg experiment, DMEM culture medium was then changed to methionine-deficient culture medium for 1 h, followed by supplying 2 mM Hpg (200 mM stock in PBS) in the medium for 24 h.
Propargylcholine and EdU dual-color experiment, DMEM culture medium was changed to DMEM medium (FBS-free) for synchronization. After synchronization, medium was replaced back to DMEM culture medium by simultaneously adding both propargylcholine (25 mM stock in PBS) and EdU (10 mM stock in PBS) to the culture medium to a concentration of 1 mM and 100 μM, respectively, for 24 h.
For the propargylcholine experiment in neurons, hippocampal neurons were cultured on coverslips in 1 ml neuron culture medium for 14 d, and then propargylcholine (25 mM stock in PBS) is directly added into the medium to a final concentration of 1 mM for 24 h.
For the 17-ODYA experiment in macrophages, THP-1 cells were first seeded on coverslips at a density of 2×10⁵/mL in 2 ml RPMI-1640 culture medium for 24 h, followed by 72 h induction of differentiation to macrophages by incubating with 100 ng/ml Phorbol 12-myristate 13-acetate (PMA) in the medium. Medium was then replaced with RPMI-1640 culture medium containing 400 μM 17-ODYA (6:1 complexed to BSA) for 15 h.
For all of the above experiments, after incubation, the coverslip is taken out to make an imaging chamber filled with PBS for SRS imaging.
For the 17-ODYA experiment in C. elegans, OP50 bacterial culture was mixed well with 4 mM 17-ODYA (from 100 mM ethanol stock solution), and then seeded onto nematode growth media (NGM) plates. After drying the plates in hood, wild type N2 day 1 adult C. elegans were placed onto the plates and fed for 40 h. C. elegans were then mounted on 2% agarose pads containing 0.1% NaN3 as anesthetic on glass microscope slides for SRS imaging.
SRS imaging of C. elegans germline after feeding with EdU (Supplementary Fig. 1)
MG1693 (thymidine defective MG1655) E. Coli strain was cultured in 2 ml LB medium at 37 °C overnight, and transferred to 100 ml of M9 medium containing 400 μM EdU for further growth at 37 °C for 24 h. The EdU-labeled MG1693 E. Coli was then seeded on M9 agar plate. Synchronized day 1 adult worms developed in 20 °C were transferred to EdU-labeled bacterial plate for 3 h, and then were dissected to take out the germline.
Cell preparation for click chemistry-based fluorescence microscopy (Supplementary Fig. 3)
All experiments were carried out following the manufacturer's protocol from Invitrogen. Hela cells were first incubated with 10 μM EdU in DMEM culture medium for 24 h, or 1 mM EU in DMEM culture medium for 20 h, or 1 mM Hpg in methionine-deficient culture medium for 20h, respectively. Cells were then fixed in 4% PFA for 15 min, washed twice with 3% BSA in PBS, permeabilized with 0.5% Triton PBS solution for 20 min, and performed click chemistry staining using Alexa Fluor 488 Azide in the Click-iT Cell Reaction Buffer Kit for 30 min. After washing with 3% BSA in PBS for three times, fluorescence images were obtained using an Olympus FV1200 confocal microscope with 488nm laser excitation while the cells were immersed in PBS solution.
Enzymatic assays confirming propargylcholine incorporation into cellular choline phospholipids (Supplementary Fig. 4)
We design our control experiments according to the click chemistry based assays reported in Ref. (10). NIH 3T3 cells cultured with 0.5 mM propargylcholine for 48 hours were fixed with 4 % PFA for 15 minutes, rinsed with 1 mL TBS buffer twice and incubated with 1 mL 1 mg/mL BSA in TBS buffer for 1 hour at 37 °C, with or without 0.02 U/mL phospholipase C (Type XIV from Clostridium perfringens, Sigma), in the presence of 10 mM CaCl2 (required for phospholipase C activity) (Supplementary Fig. 4b) or 10 mM EDTA (Supplementary Fig. 4c). The cells were then washed with TBS buffer and ready for SRS imaging.
Sample preparation for drug delivery into mouse ear tissues (Supplementary Figs. 5 and 6)
Either DMSO solution or Drug cream (Lamisil, Novartis) containing 1% (w/w) active terbinafine hydrochloride (TH) was applied to the ears of an anesthetized live mouse (2-3 weeks old white mouse of either sex) for 30 min, and the dissected ears from the sacrificed mouse were then imaged by SRS. The amide (1655 cm−1) and lipid (2845 cm−1) images have been applied with linear spectral unmixing to eliminate cross talk before composition. The experimental protocol for drug delivery on mice (AC-AAAG4703) was approved by Institutional Animal Care and Use Committee at Columbia University.
Image progressing
Images are acquired with FluoView scanning software and assigned color or overlaid by ImageJ. Graphs were assembled with Adobe Illustrator.
Supplementary Material
Acknowledgments
We thank L. Zhang, L. Brus, V. W. Cornish, D. Peterka and R. Yuste for helpful discussions. We are grateful to Y. Shin and X. Gao for technical assistance. W.M. acknowledges support from Columbia University, US National Institutes of Health Director's New Innovator Award, US Army Research Office (W911NF-12-1-0594) and Alfred P. Sloan Research Fellowship.
Footnotes
Author Contributions: L.W., F.H., Y.S., Z.C., Y.Y., C.-C. L. and M.C.W. performed experiments and analyzed data. L.W. and W.M. conceived the concept, designed the experiments and wrote the paper.
Conflict of interest statement: Columbia University has filed a patent application based on this work.
References
- 1.Zhang J, Campbell RE, Ting AY, Tsien RY. Nat. Rev. Mol. Cell Biol. 2002;3:906–918. doi: 10.1038/nrm976. [DOI] [PubMed] [Google Scholar]
- 2.Sasic S, Ozaki Y, editors. Raman, infrared, and near-infrared chemical imaging. Wiley; 2011. [Google Scholar]
- 3.Cheng J-X, Xie XS. Coherent Raman Scattering Microscopy. CRC Press; 2012. [Google Scholar]
- 4.Masters BR, So PTC, editors. Handbook of biomedical nonlinear optical microscopy. Oxford University Press; 2008. [Google Scholar]
- 5.Prescher JA, Bertozzi CR. Nat. Chem. Biol. 2005;1:13–21. doi: 10.1038/nchembio0605-13. [DOI] [PubMed] [Google Scholar]
- 6.Grammel M, Hang HC. Nat. Chem. Biol. 2013;9:75–84. doi: 10.1038/nchembio.1296. [DOI] [PMC free article] [PubMed] [Google Scholar]
- 7.Salic A, Mitchison TJ. Proc. Natl. Acad. Sci. USA. 2008;105:2415–2420. doi: 10.1073/pnas.0712168105. [DOI] [PMC free article] [PubMed] [Google Scholar]
- 8.Jao CY, Salic A. Proc. Natl. Acad. Sci. USA. 2008;105:15779–15784. doi: 10.1073/pnas.0808480105. [DOI] [PMC free article] [PubMed] [Google Scholar]
- 9.Beatty KE, et al. Angew. Chem. Int. Ed. 2006;45:7364–7367. doi: 10.1002/anie.200602114. [DOI] [PubMed] [Google Scholar]
- 10.Jao CY, Roth M, Welti R, Salic A. Proc. Natl. Acad. Sci. USA. 2009;106:15332–15337. doi: 10.1073/pnas.0907864106. [DOI] [PMC free article] [PubMed] [Google Scholar]
- 11.Hang HC, Wilson JP, Charron G. Acc. Chem. Res. 2011;44:699–708. doi: 10.1021/ar200063v. [DOI] [PMC free article] [PubMed] [Google Scholar]
- 12.Baskin JM, et al. Proc. Natl. Acad. Sci. USA. 2007;104:16793–16797. doi: 10.1073/pnas.0707090104. [DOI] [PMC free article] [PubMed] [Google Scholar]
- 13.Lin-Vien D, Colthup NB, Fateley WG, Grasselli JG. The Handbook of Infrared and Raman Characteristic Frequencies of Organic Molecules 95-104. Academic Press; 1991. [Google Scholar]
- 14.Wei L, Yong Y, Shen Y, Wang M, Min W. Proc. Natl. Acad. Sci. USA. 2013;110:11226–11231. doi: 10.1073/pnas.1303768110. [DOI] [PMC free article] [PubMed] [Google Scholar]
- 15.Yamakoshi H, et al. J. Am. Chem. Soc. 2011;133:6102–6105. doi: 10.1021/ja108404p. [DOI] [PubMed] [Google Scholar]
- 16.Yamakoshi H, et al. J. Am. Chem. Soc. 2012;134:20681–20689. doi: 10.1021/ja308529n. [DOI] [PubMed] [Google Scholar]
- 17.Min W, Freudiger CW, Lu S, Xie XS. Annu. Rev. Phys. Chem. 2011;62:507–530. doi: 10.1146/annurev.physchem.012809.103512. [DOI] [PMC free article] [PubMed] [Google Scholar]
- 18.Freudiger CW, et al. Science. 2008;322:1857–1861. doi: 10.1126/science.1165758. [DOI] [PMC free article] [PubMed] [Google Scholar]
- 19.Moore KJ, Tabas I. Cell. 2011;145:341–355. doi: 10.1016/j.cell.2011.04.005. [DOI] [PMC free article] [PubMed] [Google Scholar]
- 20.Ashrafi K, et al. Nature. 2003;421:268–272. doi: 10.1038/nature01279. [DOI] [PubMed] [Google Scholar]
Associated Data
This section collects any data citations, data availability statements, or supplementary materials included in this article.