Abstract
The adenosine 5′-triphosphate (ATP)-gated P2X7 receptor is a membrane-bound, non-selective cation channel, expressed in a variety of cell types. The P2X7 senses high extracellular ATP concentrations and seems to be implicated in a wide range of cellular functions as well as pathophysiological processes, including immune responses and inflammation, release of gliotransmitters and cytokines, cancer cell growth or development of neurodegenerative diseases. In the present study, we identified natural compounds and analogues that can block or sensitize the ATP (1 mM)-induced Ca2+ response using a HEK293 cell line stably expressing human P2X7 and fluorometric imaging plate reader technology. For instance, teniposide potently blocked the human P2X7 at sub-miromolar concentrations, but not human P2X4 or rat P2X2. A marked block of ATP-induced Ca2+ entry and Yo-Pro-1 uptake was also observed in human A375 melanoma cells and mouse microglial cells, both expressing P2X7. On the other hand, agelasine (AGL) and garcinolic acid (GA) facilitated the P2X7 response to ATP in all three cell populations. GA also enhanced the YO-PRO-1 uptake, whereas AGL did not affect the ATP-stimulated intracellular accumulation of this dye. According to the pathophysiological role of P2X7 in various diseases, selective modulators may have potential for further development, e.g. as neuroprotective or antineoplastic drugs.
Keywords: Ion channel-coupled purinergic receptors, P2X7, calcium influx, Pore formation, Dye permeability
Introduction
P2X receptors form a family of seven subtypes, referred to as P2X1 through P2X7. They assemble into trimeric ligand-gated cation-permeable ion channel complexes that can be activated by extracellular adenosine 5′-triphosphate (ATP) (for review, see [1, 2]). The P2X7 receptor, predominantly expressed in cells of hematopoietic lineages, including macrophages, lymphocytes and microglia, seems to be the most divergent member of the P2X receptor family in terms of its individual structure, pharmacology and function [3, 4]. Besides its large size (595 amino acids) and long cytoplasmic C terminus that may interact with other signalling proteins, activation of this subtype requires rather high concentrations of extracellular ATP. The channel activity is poorly desensitising, and prolonged or repeated exposure to ATP typically results in a pore formation, allowing large organic cations to enter the cell and eventually triggering cell death [1, 5]. Several mechanisms have been proposed for the channel-to-pore transition, which may be caused by intrinsic properties of P2X7 or by P2X7-associated proteins ([6] and references therein). P2X7 activation affects a wide range of cellular functions, such as changes in the intracellular concentrations of Ca2+ or K+, release of gliotransmitters and cytokines, phagocytosis, cell proliferation or death. Therefore, this receptor may play an important role in the development of various diseased states, including inflammation, neuropathic pain and a number of neurological disorders [7–9]. In addition, P2X7 splice variants may alter receptor expression and function [10]. Furthermore, both loss-of-function and gain-of-function P2X7 polymorphisms have been described. Some of them are associated with different pathologies, including tuberculosis, Crohn’s disease or bipolar affective disorders (reviewed by [10]). Genetically engineered mouse models lacking P2X7 expression in distinct tissues showed an attenuation of the release of pro-inflammatory cytokines [11], thereby decreasing the incidence and severity of arthritis [12] and reducing inflammatory and neuropathic pain sensitivity [13]. Thus, the P2X7 has attracted considerable interest as a therapeutic target [7, 14]. P2X7 ligands, in particular selective antagonists, have recently become available and allow preclinical and clinical studies in inflammatory and immune-mediated disorders [9, 15, 16].
On the basis of the screening of a compound library that comprises about 2,300 biologically active and structurally diverse compounds including 800 natural products, the present study focused on the identification of novel P2X7 modulating natural compounds. Consequently, we have identified several compounds that selectively block or sensitize the ATP-triggered P2X7 activation in stably transfected HEK293 cells, the A375 human melanoma cell line and L929-conditioned mouse microglial cells endogenously expressing the P2X7 using fluorometric Ca2+ measurement and YO-PRO-1 uptake assays. In this study, we provide evidence for concentration-dependent P2X7 inhibition by teniposide (TN), a semisynthetic derivative of podophyllotoxin derived from American may-apple, as well as positive modulatory effects by agelasine (AGL) and garcinolic acid (GA), isolated from Garcinia trees and marine sponges, respectively, as the most striking compounds of the tested library.
Materials and methods
HEK293 and A375 melanoma cells
Human embryonic kidney 293 cells stably transfected with the human P2X7 receptor (HEKhP2X7) were cultured in Dulbecco’s modified Eagle Medium (DMEM; c.c.pro, Oberdorla, Germany), containing 4.5 g/l d-glucose and supplemented with 10 % foetal calf serum (FCS, Biochrom, Berlin, Germany), 2 mM l-glutamine (Sigma-Aldrich, Taufkirchen, Germany) and 50 μg/ml geneticin (Invitrogen, Karlsruhe, Germany). Cells were grown in a humidified incubator at 37 °C in an atmosphere supplemented with 7 % CO2. Similarly, HEK293 cells stably transfected with the human P2X4 receptor (HEKhP2X4 cells) were cultured in a similar medium, containing 400 μg/ml geneticin. To obtain a stably transfected HEKrP2X2, the rat P2X2 receptor was stably and inducibly expressed in a HEK293 Flp-in cell line (Invitrogen), cultured in DMEM in the presence of 15 μg/ml blasticidin and 100 μg/ml hygromycin. Expression of the transgene was induced by supplementing the medium with 1 μg/ml tetracycline 24 h prior to the experiments.
The A375 human melanoma cell line (kindly provided by Dr. U. Anderegg; Department of Dermatology, University of Leipzig, Germany) was cultured in RPMI-1640 medium (PAA Laboratories, Pasching, Austria), supplemented with 10 % FCS, 2 mM l-glutamine, 100 μg/ml streptomycin and 100 IU/ml penicillin at 37 °C in a humidified atmosphere containing 5 % CO2.
Microglial cell preparation
P0 to P4 C57BL/6 mice and P2X7−/−-C57BL/6 mice were used. Brain tissue extraction were notified and conducted in accordance with the German guidelines for the care and use of animals in biomedical research. Briefly, brain fragments were mechanically dissociated and triturated through a glass Pasteur pipette to obtain single cells, and mixed glial cell cultures as described [17]. Suspended cells of maximal three whole brains from neonatal mice were cultured in complete DMEM supplemented with 10 % FCS, 100 μg/ml streptomycin and 100 IU/ml penicillin in poly-l-lysine-coated 75-cm2 cell culture flasks at 37 °C in a humidified atmosphere (5 % CO2). After 24 h, cultures were washed three times with phosphate-buffered saline (PBS, Invitrogen), and medium was changed every other day. After 7 days of cultivation, a confluent astrocyte cell layer has been formed. Cultures then received complete medium supplemented with 30 % of L929-conditioned culture supernatant (L929 mouse fibroblast cells were kindly provided by Prof. U.-K. Hanisch, Institute of Neuropathology, Georg-August-University, Göttingen; the supernatant was prepared as described by Regen et al. [17]. After 5–7 days, microglial cells were knocked off carefully from the astrocyte cell layer (that remained adherent on the bottom of the flasks) and harvested every 7 days (two to three times), counted and used for experiments. The purity of the microglial cells was controlled with rabbit anti-mouse Iba-1 [1:500] (WAKO, Neuss, Germany) and mouse anti-GFAP [1:500] antibodies (BD Pharmingen, Heidelberg, Germany). After binding of fluorescent secondary antibodies, fluorescence microsopy revealed 95–99 % Iba-1-immunopositive microglial cells and 1–5 % GFAP-immunopositive astrocytes, respectively.
Fluorometric [Ca2+]i measurement
HEK293 and A375 melanoma cell suspensions were obtained by harvesting monolayer cultures from 75-cm2 cell culture flasks with trypsin (0.05 % in HEPES-buffered solution (HBS)). After washing (95×g for 6 min), cells were resuspended in culture medium, supplemented with fluo-4/AM (4 μM, Invitrogen, Darmstadt, Germany) and incubated at 37 °C for 30–45 min. Free dye was removed by centrifugation (95×g for 3 min), and cell suspensions were resuspended into a HBS, containing 133 mM NaCl, 4.8 mM KCl, 1.2 mM KH2PO4, 10 mM HEPES adjusted to pH 7.4 with NaOH, 10 mM glucose, 1.3 mM CaCl2 and 1 mM MgCl2 (standard-DIC), or in a similar solution without MgCl2 and CaCl2 (no-DIC). The cell suspension was dispensed into black pigmented, clear-bottom 384 microwell plates (Corning, No. 3655, Lowell, MA, USA). To determine concentration–response relationships, test compounds were serially diluted by using a programmable robotic liquid handling station (Freedom Evo 150, Tecan, Männedorf, Switzerland). The maximal final concentration of the compounds was 50 μM except for A-438079 (5 μM) and AZ 10606120 (0.5 μM). Fluorescence measurements were performed with a filter-based microplate reader (POLARstar Omega, BMG Labtech, Offenburg, Germany), applying 485 ± 6 and 520 ± 10-nm band-pass filters for excitation and emission, respectively. Microwell plates were repetitively scanned every 16 s in the fast scanning mode of the device. After 10 baseline cycles, ATP (final concentration of 1 mM) was injected into each well, and the increase in fluorescence intensities was followed after a delay of about 2 min for up to 40 min (150 cycles) after ATP injection. In experiments with HEKhP2X4 and HEKrP2X2 cells, cell suspensions were pretreated for 10 min with thapsigargin (2 μM; Sigma-Aldrich) to eliminate P2Y-triggered responses by depleting intracellular Ca2+ stores. The final ATP concentration to stimulate hP2X4 and rP2X2 receptors was 3 μM (measurements for 90 s, onset 16 s after ATP application, 30 cycles). Thapsigargin pretreatment was not applied when examining P2X7 signals in HEKhP2X7, A375 and microglia cells. The transient P2Y-triggered Ca2+ response is known to disappear within 1–2 min and therefore was not registered due to the time delay at the onset of measurements. Since replenishment of intracellular Ca2+ stores was allowed to occur, it can be suggested that the observed sustained elevation of [Ca2+]i was solely due to P2X7 activation. This assumption was fostered by the observation that established P2X7 antagonists abrogated the ATP-triggered increases in [Ca2+]i.. Data were normalized to the baseline values before ATP application (F/F0).
YO-PRO-1 uptake assay
The permeation of large cationic dyes through P2X7-associated or dilated pores was tested using the YO-PRO-1 uptake assay. The procedure was similar to the fluorometric [Ca2+]i measurements, but a no-DIC HBS buffer was used. YO-PRO-1 (final concentration 1 μM; Invitrogen) was added to the cell suspension immediately before the cells were dispensed into 384-well microwell plates that were prefilled with the respective test compounds or control solutions. Plates were repetitively scanned every 60 s (10 baseline cycles), and YO-PRO-1 fluorescence increases after ATP (1 mM) injection was followed for up to 100 min (100 cycles). Fluorescence was normalized to initial intensities before ATP application and intensity values at the end of an experiment (90 or 80 min) were evaluated.
Immunofluorescence and confocal LSM
HEKhP2X7 cells, A375 melanoma cells and microglial cells were seeded on round glass coverslips that were previously coated with poly-l-lysine in culture medium for 60–90 min. After washing twice in PBS (0.1 M, pH 7.4), cells were fixed in ice-cold methanol for 10 min and air-dried. After washing with Tris-buffered saline (TBS, Tris-buffer final 0.005 M, pH 7.4) and TBS containing 0.3 % Triton X-100/5 % FCS for permeabilization and blocking (30 min), cells were incubated in TBS (0.3 % Triton X-100/5 % FCS) overnight at 4 °C with a rabbit polyclonal anti-P2X7 antibody [1:600] (No. APR-004; Alomone Laboratories, Jerusalem, Israel). Microglial cells were incubated together with a monoclonal mouse anti-rat CD11b antibody [1:100] (Serotec, Düsseldorf, Germany). After washing in TBS three times, cells were incubated with the secondary antibody Cy3-conjugated donkey anti-rabbit IgG [1:800], and microglial cells were co-stained with a Cy2-conjugated donkey anti-mouse IgG [1:400] (Jackson ImmunoResearch, West Grove, PA, USA) in TBS (0.3 % Triton X-100/5 % FCS) at room temperature for 2 h. At the end, cell nuclei were counterstained with Hoechst 33342 (16 μM for 10 min; Invitrogen, Darmstadt, Germany). After washing in TBS and short dipping in deionized water, coverslips were air-dried, sequentially processed through 100 % ethanol and n-butyl acetate and subsequently covered and mounted with entellan (Merck, Darmstadt, Germany). Control experiments were carried out without the primary anti-P2X7 antibody. The specificity of the used anti-P2X7 receptor antibody was further tested by pre-incubation with a control peptide (immunogen, aa 576–595 of C-terminus of the rat P2X7). The immunofluorescence was visualized using a confocal laser scanning microscope (LSM 510 Meta, Carl Zeiss, Oberkochen, Germany) at an excitation wavelength of 543 nm (red Cy3-fluorescence) and 488 nm (green Cy2-fluorescence), applying appropriate emission band-pass filters. For detection of Hoechst 33342 bound to DNA, an UV laser (351–362 nm) was used.
Calcein/ethidium staining
To monitor the effect of test compounds on high ATP (2 mM)-induced cell damage in HEKhP2X7 cells, poly-l-lysine-coated coverslips with 2–3 day-old cultures were washed twice in no-DIC HBS buffer, and compounds were added at the indicated concentrations. After 8–10 min, ATP (final 2 mM, pH 7.4 with NaOH) was applied for 20–25 min. The cell integrity was assessed using a combined calcein acetoxymethyl ester(AM)/ethidium homodimer-1 viability/cytotoxicity staining kit (Molecular Probes/Invitrogen, Karlsruhe, Germany) following the manufacturer’s instructions. Optimal staining was achieved with 2 μM calcein AM (for 10 min) and 1 μM ethidium homodimer-1 (for 2 min in the bath solution). Finally, coverslips were rinsed with no-DIC HBS, fixed in ice-cold methanol, and air-dried. The embedding procedure and confocal imaging (Carl Zeiss, LSM 510) were performed as described above.
Materials
The following pharmacological agents were used: ATP disodium salt, pyridoxalphosphate-6-azophenyl-2′,4′-disulfonate (PPADS) tetrasodium salt hydrate, reactive blue 2, thapsigargin (all Sigma-Aldrich); 3-[[5-(2,3-dichlorophenyl)-1H-tetrazol-1yl]methyl]pyridine hydrochloride hydrate (A-438079), N-[2-[[2-[(2-hydroxyethyl)amino]ethyl]amino]-5-quinolinyl]-2-tricyclo[3.3.1.13,7]dec-1-ylacetamide dihydrochloride (AZ 10606120), ivermectin (IVM; all Tocris, Bristol, UK); teniposide (TN) (Enzo Life Sciences, Lörrach, Germany); agelasine (AGL) and garcinolic acid (GA) were from Microsource Discovery Systems, Gaylordsville, CT, USA.
Stock solutions of drugs (10 mM) were prepared with deionized water (AZ 10606120) or DMSO (A-438079, AGL, GA, IVM, TN). ATP solutions were freshly prepared in Mg2+-free HBS buffer and adjusted to pH 7.4. Aliquots of stock solutions were stored at −20 °C and freshly diluted with the appropriate HBS solution. The final DMSO concentrations never exceeded 0.5 %, a concentration that had no discernible effect on ATP-induced increases in [Ca2+]i.
Statistical analysis
Results are expressed as means ± SEM of the indicated number of experiments. Differences in the mean values in the YO-PRO-1 uptake assay and the calcein/erthidium viability/cytotoxicity test were tested for significance by one-way ANOVA followed by a modified Bonferroni t test for multiple comparisons. P < 0.05 was the accepted minimum level of significance. Concentration–response curves were fitted by using a four-parameter logistic function (Hill slope, Emin, Emax, IC50) and a polynominal cubic function (GA), respectively (SigmaPlot 11.0; SPSS, Erkrath, Germany). The curves were approximated to a fixed low concentration value (generally 0.003 μM or lower in the case of A-438079 and AZ 10606120) as the asymptotic 100 % response. The IC50 value is the concentration of a compound producing 50 % inhibition of the ATP (1 mM)-induced maximal [Ca2+]i response (Emax).
Results
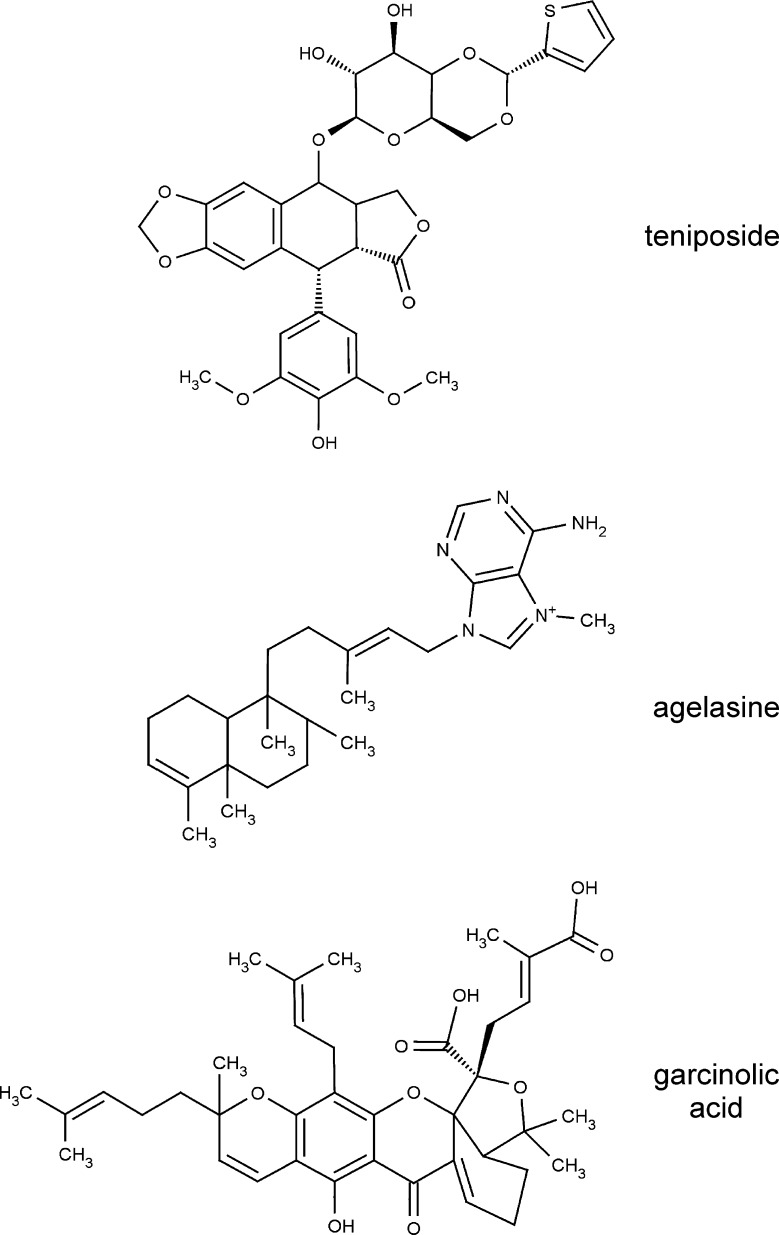
Academic screening of P2X7-modulating natural compounds was performed using a stably transfected HEKhP2X7 cell line. To this end, fluo-4-loaded cell suspensions were incubated with 800 different molecularly defined natural compounds at a final concentration of 20 μM in microwell plates, and P2X7 was activated by injecting ATP (1 mM final concentration) into each well during fluorometric analysis. Fluorescence intensities in single wells were normalized to the respective initial intensities of the well (F/F0), and time-courses were superimposed. Outliers that exhibited a discernibly lower or higher fluorescence changes upon stimulation with ATP were annotated as primary hits. As a result of the primary screen and subsequent hit verification, several natural compounds were identified that facilitate or inhibit the ATP-triggered [Ca2+]i response. The re-identification of two already known P2X7-potentiating natural compounds, polymyxin B and colistin, as well as P2X7 block by suramin confirmed the reliability of the assay. As yet unidentified P2X7-modulating natural compounds or derivatives included TN, which attenuated the ATP-induced Ca2+ response, as well as AGL and GA, two P2X7-potentiating compounds. The chemical structures are illustrated in Fig. 1. The following experiments were conducted to analyse the concentration–response relationship of the selected compounds in three different cell lines, including the recombinant HEKhP2X7 cell line and two cell lines in which P2X7 has been reported to be natively expressed: A375 human melanoma cells and mouse microglial cells.
Fig. 1.
Chemical structure of the three investigated compounds
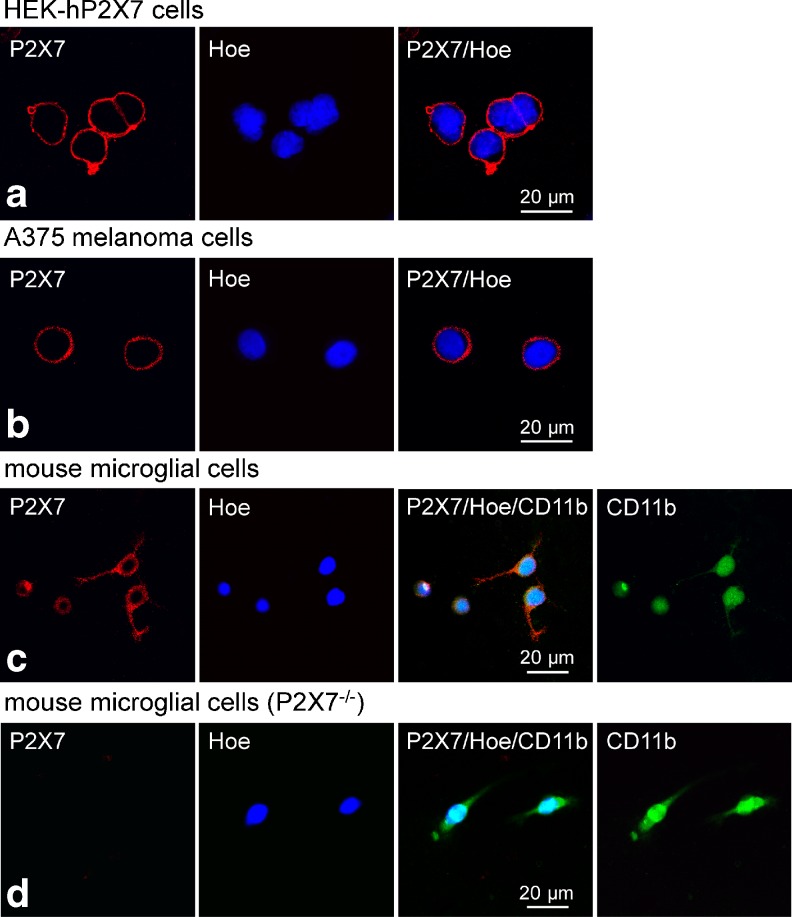
Immunofluorescence analysis confirmed that all three cell types express P2X7. Representative confocal images of P2X7 immunofluorescence (Cy-3, red), combined with nucleic acid staining by Hoechst 33342 (blue), are presented in Fig. 2. Strong punctuate immunoreactivity that co-localized with the plasma membrane was seen particularly on HEKhP2X7 cells (Fig. 2a) and A375 cells (Fig 2b). A weaker but still discernible positive immunofluorescence was observed on microglial cells prepared from brain tissue of C57BL/6 mice. Microglial distribution was ascertained by additional staining with a monoclonal mouse anti-rat CD11b antibody as a marker (Cy-2, green) (Fig. 2c). Microglial cells prepared from P2X7−/−-C57BL/6 mice showed no P2X7 immunofluorescence (Cy-3, red) (Fig. 2d).
Fig. 2.
Confocal immunofluorescence imaging demonstrates the expression of P2X7 in stably transfected HEK293 cells (a), A375 human melanoma cells (b), mouse microglial cells (c), and microglial cells from P2X7 knockout mice (d), respectively. In each row, immunofluorescence for P2X7 (Cy3, red), nucleic acid-staining by Hoechst 33342 (blue) and the corresponding overlay are presented. In addition, immunofluorescence for the microglial marker CD11b (Cy2, green) is also shown (c, d)
Analysis of concentration dependence by [Ca2+]i measurements
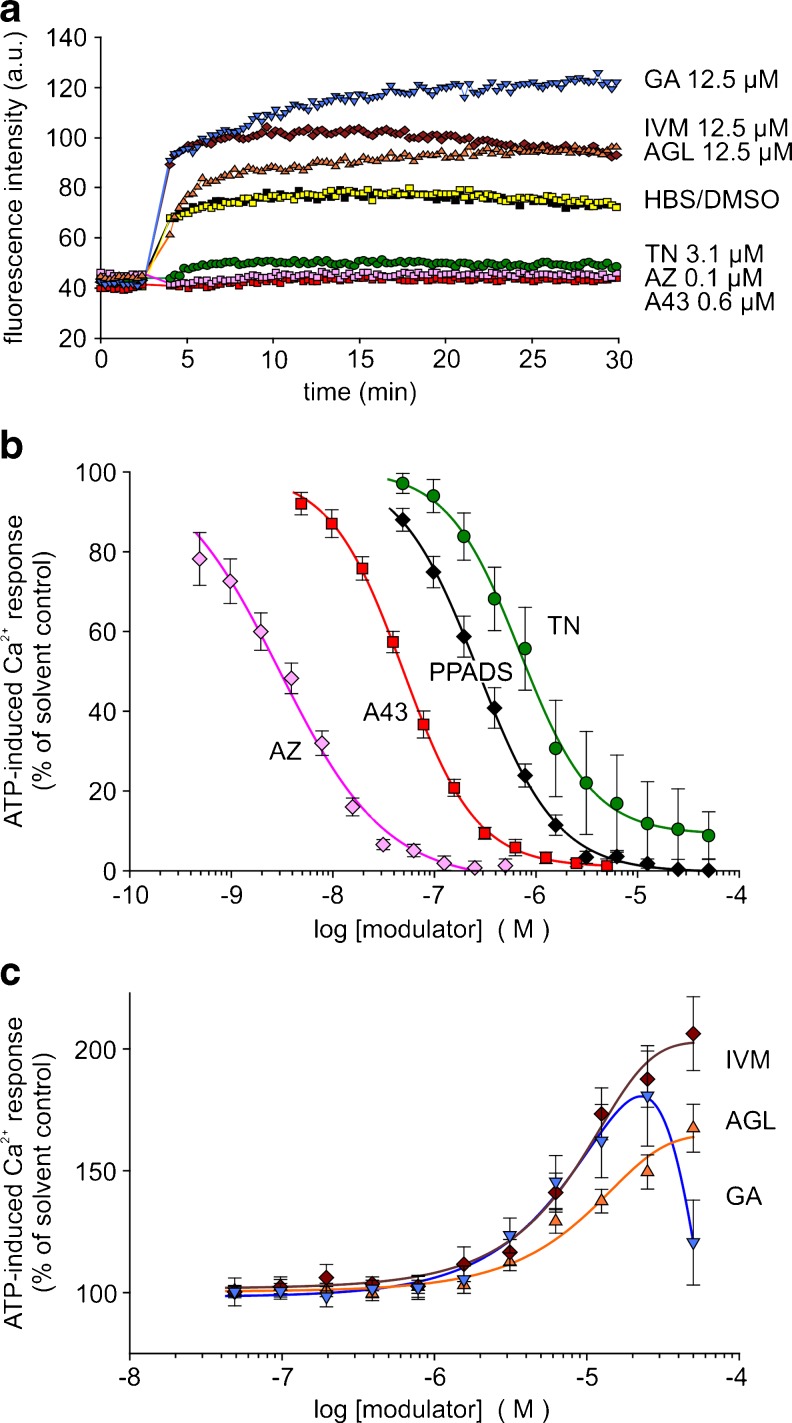
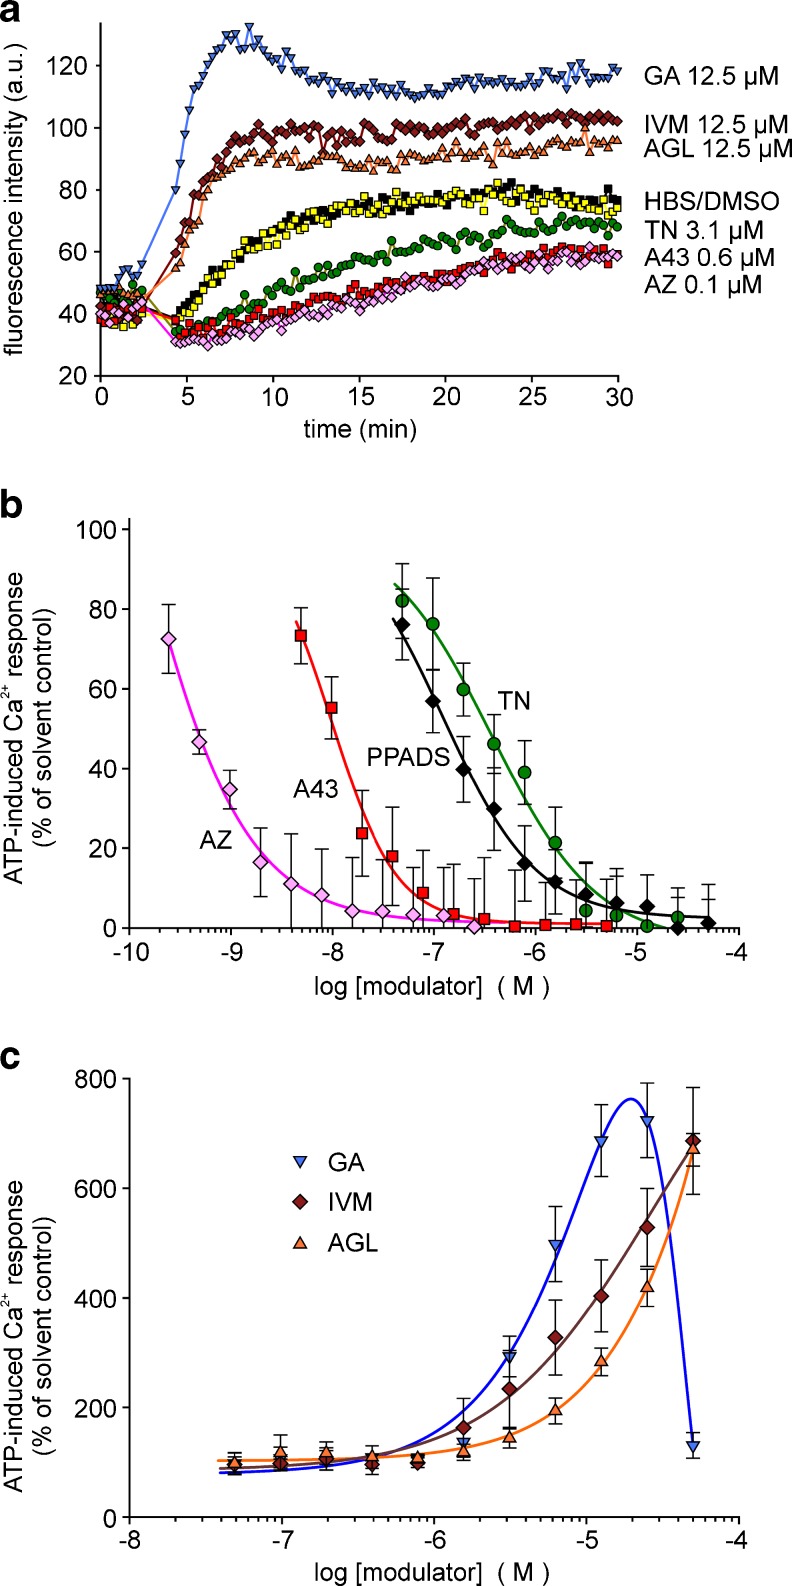
In HEKhP2X7 cells stably transfected with the human P2X7 receptor and loaded with the Ca2+ indicator dye fluo-4, high ATP concentrations (1 mM) led to a long-lived increase in fluorescence intensity. Figure 3a illustrates the modulatory effects of the three investigated natural compounds as well as those of some reference substances: the competitive tetrazole P2X7 antagonist A-438079 [18], the highly potent non-competitive P2X7 antagonist AZ 10606120 [19] and the antiparasitic drug IVM, recently described as a positive allosteric modulator of human P2X7 in the same cell line [20]. As demonstrated, TN and the two P2X7 antagonists AZ 10606120 and A-438079 blocked the increase in fluorescence intensity. The suppression by AZ 10606120 and A-438079 of the long-lasting increase in [Ca2+]i confirms that P2X7 accounts for the ATP-triggered non-inactivating Ca2+ entry in HEKhP2X7 cells. The inhibitory compound TN exerted a concentration-dependent inhibition of ATP-induced [Ca2+]i response in HEKhP2X7 cells with an estimated IC50 of 0.70 ± 0.05 μM (Fig. 3b). For comparison, the highly potent P2X7 antagonists AZ 10606120 and A-438079 as well as the non-selective antagonist PPADS blocked the [Ca2+]i response to ATP with IC50 values of 3 ± 0.5 nM, 50 ± 1.6 nM and 0.27 ± 0.01 μM, respectively. Potentiation of P2X7-related Ca2+ signals by AGL and GA required concentrations of 10 μM or higher (Fig 3c). In addition, the potentiating effect of IVM was reconfirmed. Some preliminary studies revealed a small shift of the ATP concentration–response curve to lower ATP concentrations and an increase in the curve maximum (at 5 mM) by both compounds as well as IVM using a FLIPR Ca2+ assay (not shown). Together, this action could reflect a positive allosteric modulation by AGL and GA, although indirect effects cannot be fully excluded. Intriguingly, the action of GA was attenuated at concentrations of 50 μM. Cytotoxic effects may be presumed by this high concentration (see also below).
Fig. 3.
Modulation of ATP-induced [Ca2+]i response by certain compounds in HEK hP2X7 cells (fluo-4 fluorometry, microplate reader). Compounds and cells were placed in the microtitre plate. After 10 baseline cycles, ATP (final 1 mM) was injected into each well. a Time course of recorded fluorescence intensities given in arbitrary units (a.u.). Representative recordings of selected curves demonstrating blocking and facilitating effects, respectively, of the tested compounds. b, c Corresponding concentration–response curves, fitted by using a four-parameter logistic function or a polynomial, cubic function (GA, garcinolic acid; SigmaPlot). Data represent means ± SEM (n = 6–10 independent experiments). ATP-induced Ca2+ responses are calculated in percentage of the respective controls with solvent alone. The curves represent the effects of agelasine (AGL, orange), garcinolic acid (GA, blue), ivermectin (IVM, brown), teniposide (TN, green), A-438079 (A43, red), AZ10606120 (AZ, rose) and PPADS (black). The controls were pretreated with HBS (yellow) or DMSO (black), respectively, indicating no difference
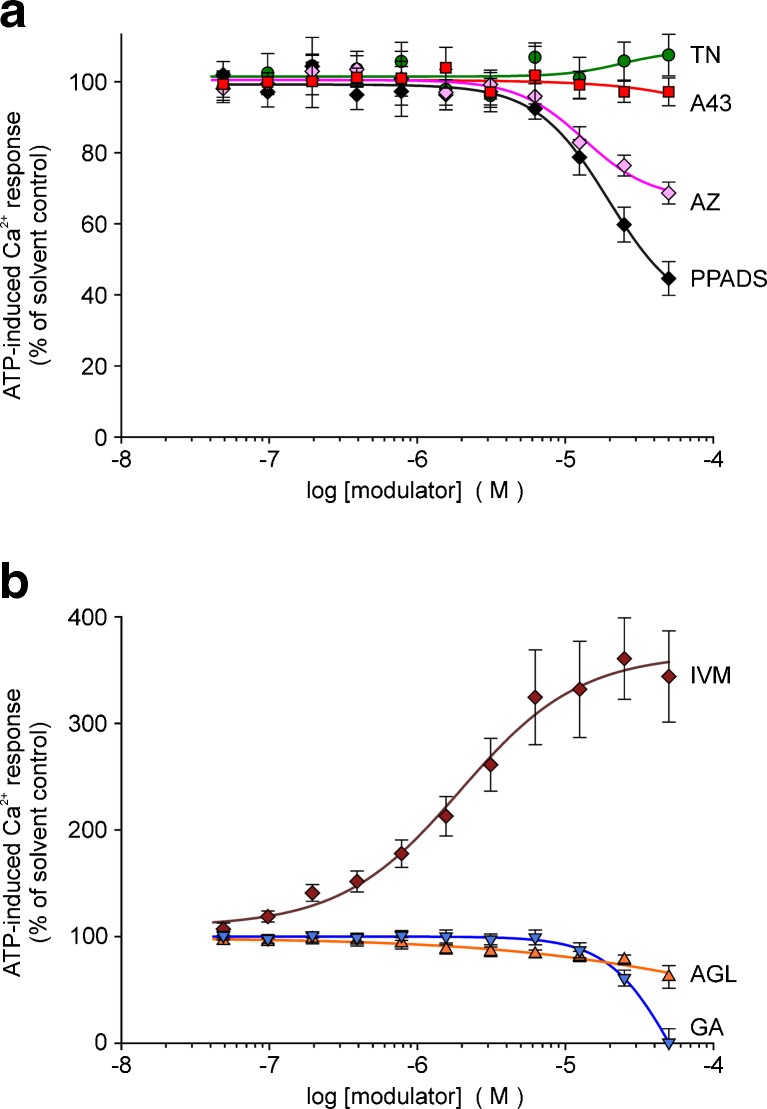
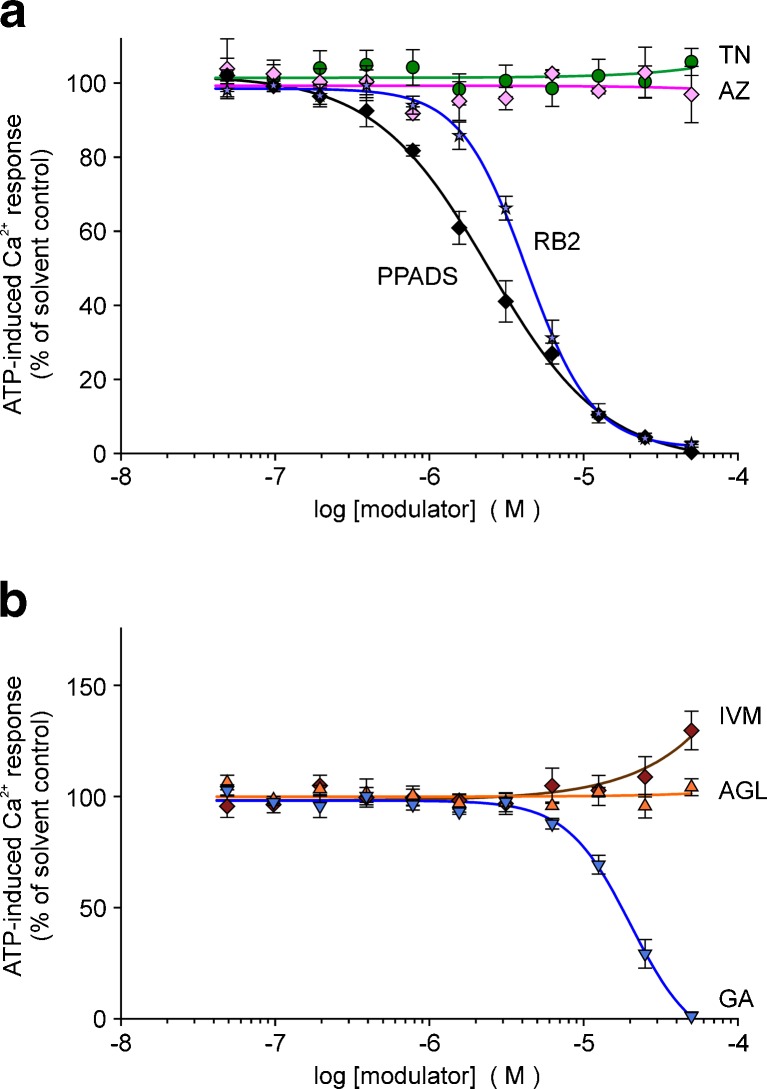
The selectivity of the compounds to modulate P2X7 but not other non-inactivating, Ca2+-permeable P2X receptors was tested with HEK293 cells stably transfected with human P2X4R (Fig. 4a) or rat P2X2R (Fig. 5a). TN caused no inhibition of the ATP (3 μM)-induced [Ca2+]i response in P2X4- or P2X2-expressing HEK cells. Notably, PPADS and reactive blue (RB2) in the low micromolar range caused a marked block on rat P2X2R (see Fig. 5b). AGL and GA showed no modulating effects in P2X4- or P2X2-expressing cells. The latter even inhibited the response when applied at higher concentrations (Figs. 4b, 5b). As expected, IVM (≥1 μM) exerted a strong potentiating action in HEKhP2X4 cells (Fig. 4b).
Fig. 4.
Effects of selected compounds on ATP (3 μM)-induced [Ca2+]i response in HEK hP2X4 cells (fluo-4 fluorometry, microplate reader). Concentration–response curves: a P2X7-blocking substances and PPADS; b P2X7-facilitating substances. Data represent means ± SEM (n = 4–6 independent experiments). Substance abbreviations and further details, see Fig. 3
Fig. 5.
Effects of selected compounds on ATP (3 μM)-induced [Ca2+]i response in HEK rP2X2 cells (fluo-4 fluorometry, microplate reader). Concentration–response curves: a P2X7-blocking substances including PPADS and RB2; b P2X7-facilitating substances. Data represent means ± SEM (n = 4 independent experiments). Substance abbreviations and further details, see Fig. 3
We verified the modulatory effects of the selected compounds also in A375 human melanoma cells and in mouse microglial cells endogenously expressing P2X7. A more robust P2X7-related response was achieved by omitting MgCl2 from the bath solution. In A375 cells, the ATP (1 mM)-induced [Ca2+]i response developed more slowly than in HEKhP2X7 cells and reached maximal values only after a longer delay. TN blocked the fluorescence increase and showed a potent concentration-dependent inhibition well comparable to the results in HEKhP2X7 cells (IC50 0.37 ± 0.06 μM, Fig. 6a, b). For AZ 10606120 and A-438079, the calculated IC50 values were 0.6 ± 0.1 and 10.0 ± 0.8 nM, respectively. PPADS acted with an IC50 of 0.12 ± 0.01 μM. The facilitating effect of AGL, GA or IVM was also seen in A375 melanoma cells (Fig. 6a, c).
Fig. 6.
Modulation of ATP-induced [Ca2+]i response by certain compounds in A375 human melanoma cells (fluo-4 fluorometry, microplate reader). a Time course of recorded fluorescence intensities, representative single recordings. b Concentration-dependent inhibition of [Ca2+]i response by TN in comparison with AZ, A43 and PPADS. c Concentration-dependent potentiation of [Ca2+]i response by AGL and GA (except 50 μM) in comparison with IVM. Data represent means ± SEM (n = 6 independent experiments). Substance abbreviations and further details, see Fig. 3
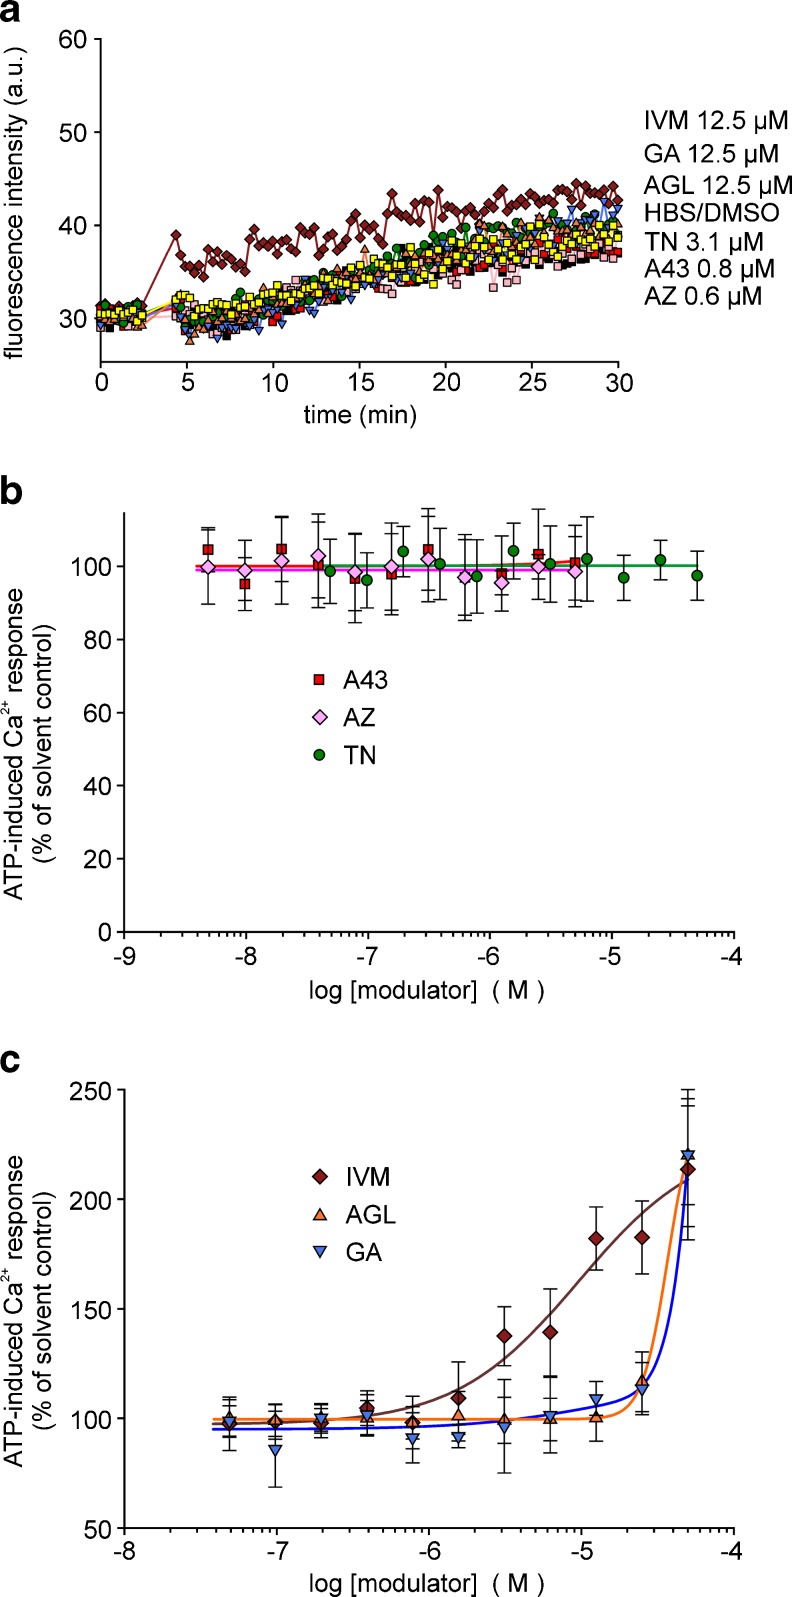
In mouse microglial cells, demonstrated to express P2X7 (but also other P2X isoforms), the ATP (1 mM)-induced [Ca2+]i response was rather small. TN further diminished the fluorescence increase and, thus, revealed an inhibitory effect, but the potency of TN appeared to be low (IC50 >10 μM) (Fig. 7a, b). Of note, the established P2X7 antagonists also revealed a lower potency to block P2X7-like signals in mouse microglia. The calculated IC50 values were for AZ 10606120 and A-438079 were 0.13 ± 0.01 and 0.12 ± 0.014 μM. In agreement with recent findings, PPADS (<10 μM) failed to inhibit mouse P2X7-like signals in microglial cells. AGL, GA and IVM showed a marked facilitating effect on the ATP response (Fig. 7a, c). In experiments with microglial cells prepared from P2X7−/− mice, ATP (1 mM) induced no clear increase in fluorescence intensity over the first 10 min, followed by slowly developing and very small increases (Fig. 8a). Neither TN nor the established P2X7 antagonists AZ 10606120 and A-438079 influenced this small response (Fig. 8b). Notably, facilitating effects by IVM were still found, indicating that P2X4 receptors are functionally expressed. AGL and GA affected the Ca2+ signal in P2X7−/− microglial cells only at the highest 50 μM concentration, hinting to toxic effects of the compounds at high concentrations (Fig. 8a, c).
Fig. 7.
Modulation of ATP-induced [Ca2+]i response by certain compounds in mouse microglial cells (fluo-4 fluorometry, microplate reader). a Time course of recorded fluorescence intensities, representative single recordings. b Concentration-dependent inhibition of [Ca2+]i response by TN in comparison with AZ, A43 and PPADS. c Concentration-dependent potentiation of [Ca2+]i response by AGL and GA in comparison with IVM. Data represent means ± SEM (n = 5–6 independent experiments). The concentration–response curves were all fitted by using a four-parameter logistic function (SigmaPlot). For substance abbreviations and further details, see Fig. 3
Fig. 8.
Modulation of ATP-induced [Ca2+]i response by certain compounds in microglial cells from P2X7 knockout mice (fluo-4 fluorometry, microplate reader). a Time course of recorded fluorescence intensities, representative single recordings. Concentration–response curves: b P2X7-blocking substances, c P2X7-facilitating substances. Data represent means ± SEM (n = 4 independent experiments). For substance abbreviations and further details, see Fig. 3
YO-PRO-1 uptake measurement
Repeated or prolonged activation of P2X7 may result in the formation of non-selective transmembrane pores permeable to large molecules up to 900 Da in different cell types [21]. We therefore investigated the pore formation using a YO-PRO-1 uptake assay. The dye accumulation in HEKhP2X7 cells as well as in A375 melanoma and mouse microglial cells was significantly increased by 1 mM ATP. The cells became permeant to YO-PRO-1 iodide (molecular weight 629.3), but, interestingly, remained mostly impermeant to ethidium homodimer-1 (molecular weight 856.8), a dead cell stain (see below).
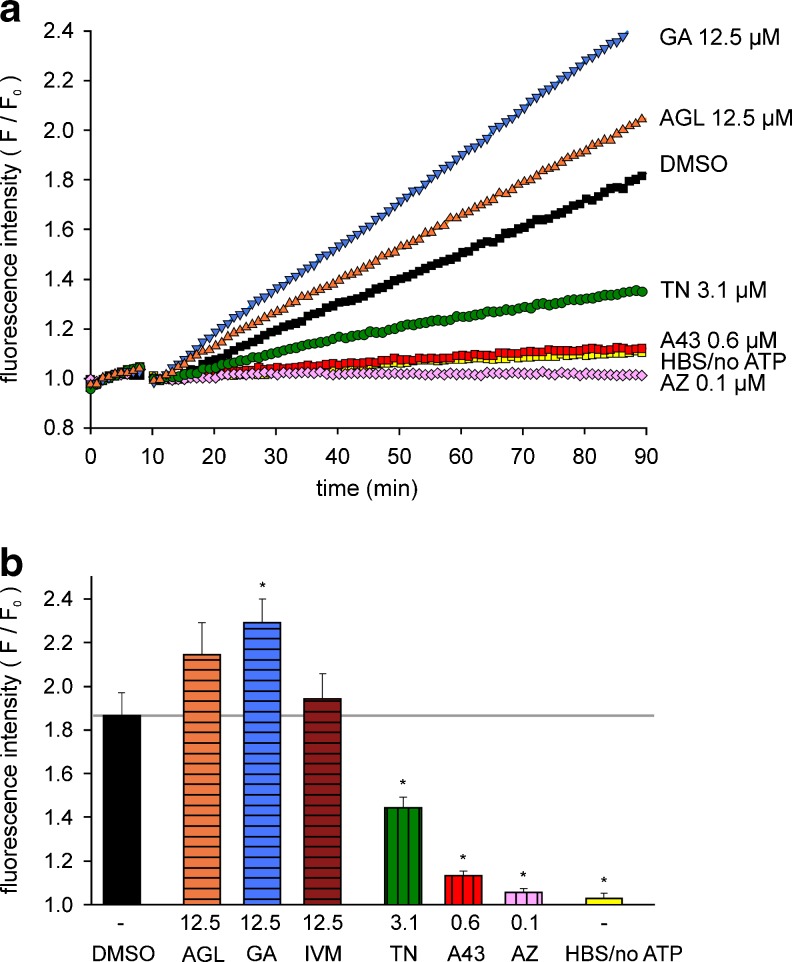
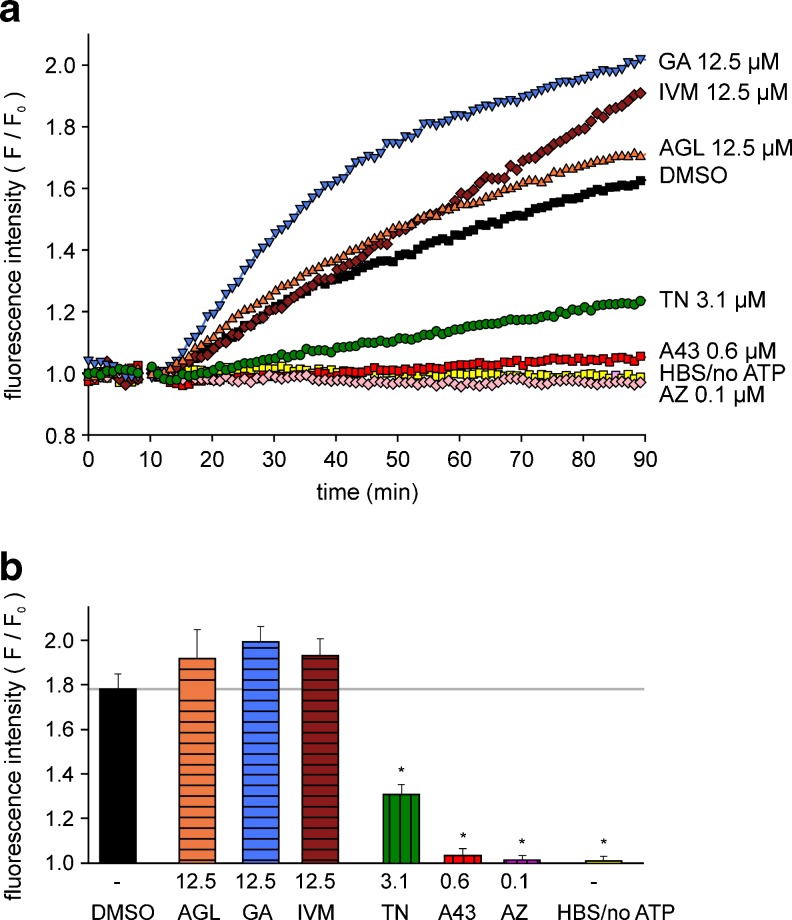
As shown in Fig. 9a, a time-dependent increase in fluorescence intensity to about 1.8 can be observed in the presence of high ATP alone (DMSO, black) in HEKhP2X7 cells. Controls with HBS application instead of ATP (HBS/no ATP, yellow) exhibited no fluorescence increase. The effect of ATP was abolished by pre-incubation with the antagonists AZ 10606120 and A-438079. TN at concentrations ≥ 3 μM markedly reduced the fluorescence increase, comparable to the fluorometric [Ca2+]i measurements. AGL and GA facilitated the increase in fluorescence intensity at higher concentrations (≥10 μM) without exerting effects in the absence of ATP (not shown). The statistical analysis showed that TN significantly suppressed the ATP (1 mM)-induced YO-PRO-1 uptake, similar to AZ 10606120 and A-438079 at lower concentrations (Fig. 9b). From the positive modulators, GA significantly accelerated the YO-PRO-1 uptake, but AGL and IVM at 12.5–25 μM only tended to increase the ATP response. Thus, the dilatation of the P2X7 pore appeared unaffected by AGL and IVM. Notably, an increase in baseline fluorescence before ATP application was frequently observed with GA applied at a possibly toxic concentration of 50 μM.
Fig. 9.
Modulation of ATP-induced YO-PRO-1 uptake in HEK hP2X7 cells. a Representative single curves of the time-dependent increase in fluorescence intensity, normalized to the baseline values before ATP application (F/F 0). b Summary plot of the effects of the tested compounds on YO-PRO-1 (1 μM) uptake, determined as fluorescence increase after 90 min. The columns (curves) represent: ATP application alone (DMSO, black), AGL (orange), GA (blue), IVM (brown), TN (green), A-438079 (A43, red), AZ 10606120 (AZ, rose) and controls with HBS-application instead of ATP (HBS/no ATP, yellow) at the indicated concentrations. Means ± SEM (n = 8 independent experiments). *P < 0.05, significantly different from corresponding ATP (DMSO) controls
In A375 melanoma cells, the ATP (1 mM)-induced time-dependent increase in fluorescence intensity was significantly attenuated by TN as well as by the two P2X7 antagonists (Fig. 10a, b). The positive modulators AGL, GA as well as IVM slightly facilitated the increase in fluorescence intensity, although this effect was not significant. Again, GA at 50 μM markedly raised the baseline fluorescence.
Fig. 10.
Modulation of ATP-induced YO-PRO-1 uptake in A375 human melanoma cells. a Representative single curves of the time-dependent increase in fluorescence intensity (F/F 0); b summary plot of the effects of the tested compounds on YO-PRO-1 (1 μM) uptake, determined as fluorescence increase after 90 min. Substance abbreviations and further details, see Fig. 9. Means ± SEM (n = 5 independent experiments). *P < 0.05, significantly different from corresponding ATP (DMSO) controls
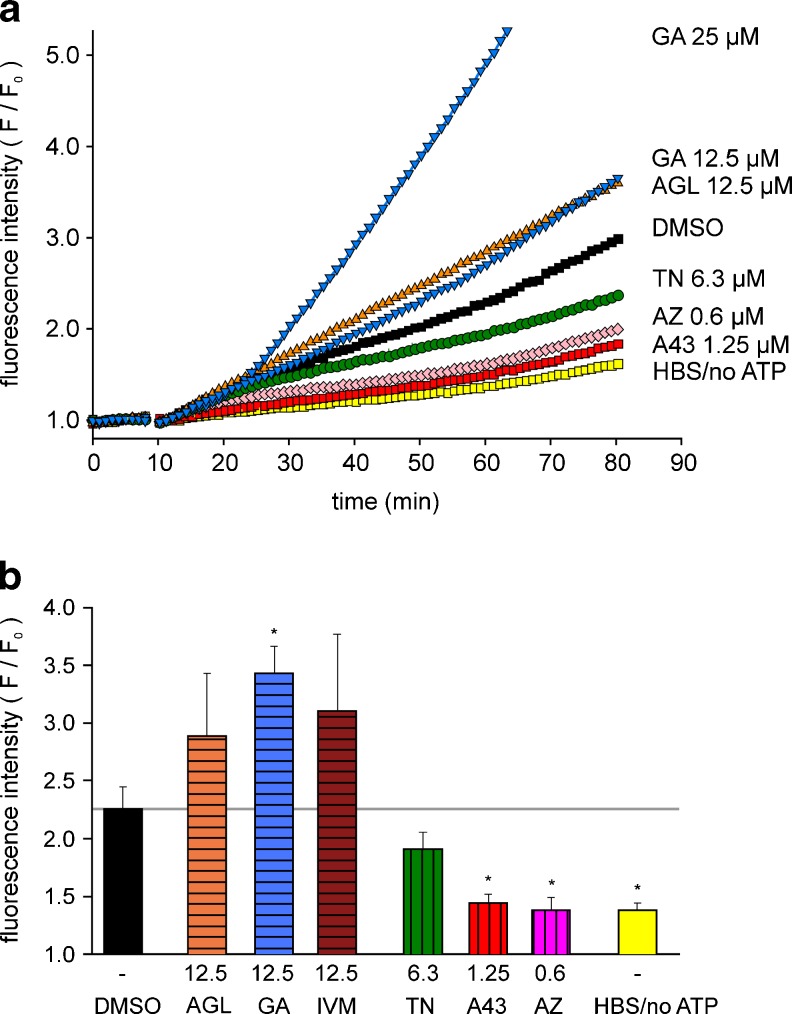
In mouse microglial cells, a time-dependent increase in fluorescence intensity was observed in the presence of high ATP. Remarkably, the controls without ATP application also exhibited a slow but sustained increase in fluorescence intensity (Fig. 11a). Because this increase became more prominent at the end of the registration period (from 80 to 100 min), the values was calculated to 80 min. The potency of all tested blocking substances including AZ 10606120 and A-438079 was lower as in HEKhP2X7 or A375 cells (Fig. 11a, b). TN revealed no statistical significance at concentrations of 6.3 μM. The facilitating effects of 12.5 μM GA, however, were significant. Comparable to the observed effects in A375 melanoma cells, the highest tested concentration of GA (25 and 50 μM), but in these cells also of AGL and IVM (50 μM each), induced a drastically increase in fluorescence intensity. It is assumed that these effects are primarily caused by cytotoxic actions.
Fig. 11.
Modulation of ATP (1 mM)-induced YO-PRO-1 uptake in mouse microglial cells. a Representative single curves of the time-dependent increase in fluorescence intensity, normalized to the baseline values before ATP application (F/F 0). Additionally indicated, GA (at 25 μM) reached the maximal display position after 60 min. b Summary plot of the effects of the tested compounds on YO-PRO-1 (1 μM) uptake, determined as fluorescence increase after 80 min. Substance abbreviations and further details, see Fig. 9. Means ± SEM (n = 4 independent experiments). *P < 0.05, significantly different from corresponding ATP (DMSO) controls
Modulatory effects on ATP-induced cell damage (calcein/ethidium staining)
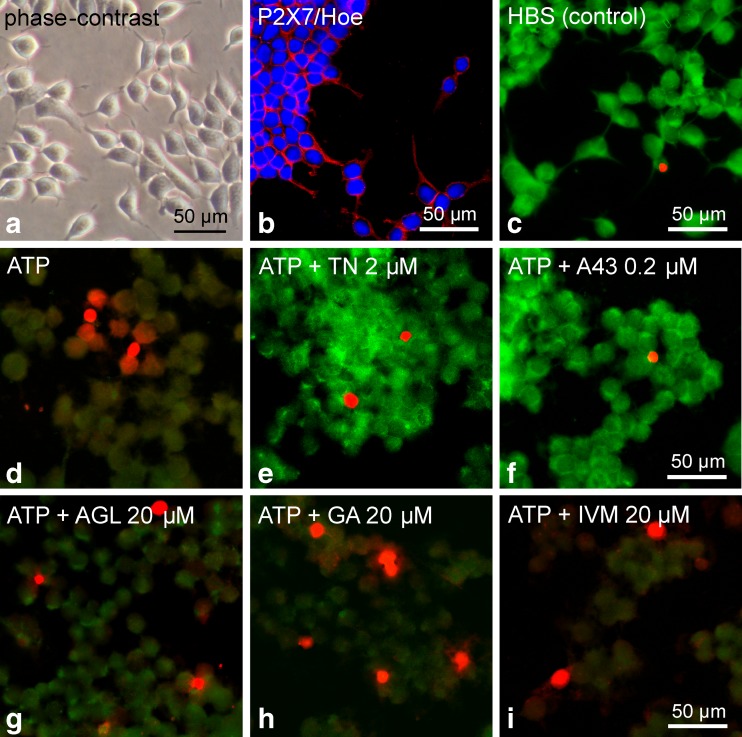
Finally, the modulatory effects of the three natural compounds and reference compounds on high ATP (2 mM)-induced cell damage in HEKhP2X7 cells was evaluated applying a live/dead staining-based cytotoxicity test. Figure 12a shows a representative photomicrograph of a living culture of HEKhP2X7 cells. The strong expression of P2X7 (Fig. 12b) per se did not affect the characteristic shape of HEK293 cells, including the elongated fibroblast-like adhesive structures. Likewise, nucleic staining by the indicator ethidium homodimer-1, a red fluorescent membrane-impermeable dye that indicates membrane leakage and dead cells, was seen in only 1.2 ± 0.2 % of solvent-treated HEKhP2X7 cells (counted in 10–11 areas with about 80–180 cells, each; mean ± SEM). Application of ATP induced cell rounding within about 20–25 min that was associated with strong diminished green fluorescence of calcein (as indicator for cell viability) and an increased fraction of ethidium-stained cells (5.7 ± 0.8 %, P < 0.05 vs. HBS; Fig. 12d). In experiments with longer incubation of ATP (60 min), the effects appeared even more pronounced, but the ongoing loss of adherence interfered with the staining process and subsequent quantitative examination. Pretreatment with 2 μM TN for 10 min before stimulation with ATP protected the cells against the ATP-induced decrease of calcein fluorescence and ethidium homodimer-1 uptake (1.6 ± 0.2 %, P < 0.05 vs. ATP), an effect that was also seen with the established P2X7 antagonist A-438079 (1.2 ± 0.1 %, P < 0.05 vs. ATP; Fig. 12e, f). Pretreatment with the positive modulators AGL, GA and IVM (each 20 μM) caused a positive nucleic staining pattern in 6.2 ± 0.8, 7.7 ± 1.6 and 7.5 ± 1.8 % of the cells, respectively. Although these percentages display a trend towards higher fractions of dying cells, the differences to a treatment with ATP alone did not reach statistical significance (P > 0.05).
Fig. 12.
Influence of the investigated natural compounds and reference substances on high ATP (2 mM)-induced cell damage in HEK hP2X7 cells. a Representative photomicrograph of a living cell culture. b Confocal image of immunofluorescence demonstrating the expression of P2X7 (Cy3, red) in stably transfected HEK293 cells, additional nucleic acid-staining by Hoechst 33342 (blue). c–i Combined calcein/ethidium staining for discrimination of live, damaged and dead cells. The controls with HBS (c) showed strong green fluorescence as an indicator of living cells that possess esterase activity and intact membranes to retain the esterase products. In contrast, the application of ATP (2 mM, for 20–25 min) induced diminished green calcein fluorescence indicating loss of cell viability, but only a few cells revealed a red nucleic fluorescence of ethidium homodimer-1 representing membrane leakage and dying cells (d). e, f TN (2 μM, pretreatment 10 min before ATP) and the selective P2X7 antagonist A-438079 (A43 0.2 μM, 10 min before ATP) markedly protected the cells (strong green fluorescence). g–i Pretreatment with the positive allosteric modulators AGL, GA and IVM (all 20 μM, 10 min before ATP) revealed damaged cells but did not indicate significantly increased cell death. Data are representative of three independent experiments. Photomicrographs were made by using a confocal laser scanning microscope
Discussion
Academic screening of a library of natural compounds revealed that the human P2X7 can be modulated by three compounds that have not yet been linked to P2X7. A P2X7 inhibition by TN as well as a facilitating effect of AGL and GA was observed by fluorometric [Ca2+]i measurements in stably transfected HEKhP2X7 cells as well as in A375 human melanoma and mouse microglial cells, both natively expressing P2X7. P2X2 or P2X4 receptors were not affected by these compounds. In a YO-PRO-1 uptake assay, TN suppressed the high ATP-induced pore formation of human P2X7, whereas in mouse microglial cells, these effects were less pronounced. GA facilitated the YO-PRO-1 uptake, albeit at higher concentrations than those required to enhance ATP-triggered increases in [Ca2+]i. By contrast and reminiscent to recent findings with IVM, AGL did not significantly accelerate the dye permeation rate. Additional studies imply that TN, like established P2X7 blockers, protects HEKhP2X7 cells against high ATP-induced cell damage.
In recent years, numerous pathophysiological functions of P2X7 have been established. Of those, a considerable fraction relates to immunological and neoplastic processes. Consequently, the P2X7 has become an appealing target for pharmacological intervention, and efforts have been made to develop novel P2X7-selective antagonists as new research tools [22–24]. Owing to its strong expression in certain leucocyte lineages, P2X7 is known for mediating effects of ATP on the secretion of pro-inflammatory cytokines [3, 9, 25]. In the CNS, P2X7 activated locally by ATP release from glial and neuronal cells or more globally by massive ATP release from damaged cells has been linked to pathologies such as reperfusion injury after ischemic stroke, neurodegenerative or demyelinating diseases, brain trauma, neuropathic pain and mood disorders. Intriguingly, although most reports imply that P2X7 inhibition may exert beneficial effects under these conditions [7, 26–28], others found opposing effects [29]. In various tumour cell lines and tissues, notably melanoma cells (including A375), breast cancer or mouse glioma, (over)expression of P2X7 has been reported. In some cases, P2X7 activation by ATP causes a decrease in tumour cell number [30–33]. On the contrary, P2X7 activation may support cell proliferation, tumour growth or metastatic activity [34, 35]. Thus, for instance in human breast cancer cells or in a rat brain glioblastoma model, inhibition of P2X7 has been suggested as potential therapeutic strategy to slow the progression of tumours [36, 37]. Therefore, depending on the cellular context, P2X7 might limit or promote the proliferation of cancer cells. Given this, both P2X7 antagonists and selective P2X7 agonists or positive allosteric modulators might be of therapeutic value.
The semisynthetic, podophyllotoxin-derived TN, like the chemically related etoposide, acts as a topoisomerase inhibitor and thereby hinders the DNA replication during the S phase of the cell cycle to exert its strong anti-mitotic and anti-tumour activity [38, 39]. Teniposide is currently being therapeutically used in various disseminated and solid tumour entities, including leukemia as well as breast, ovarian and brain tumours [39–41]. In cancer patients, peak plasma concentrations of >30 μM have been reported, although a substantial pharmacokinetic variability has to be taken into account [42, 43]. One may, therefore, assume that P2X7-mediated activity will be at least partially suppressed under these therapeutic settings. Although beyond the scope of this study, a possible contribution of P2X7 inhibition to the biological activity of teniposide remains to be demonstrated. This may relate either to the anti-tumour activity of the drug or to its adverse effect, including myelosuppression, nausea, hair loss and others. However, it must be mentioned that TN may also affect other receptor systems, especially at high concentrations. Given the extensive anti-tumour activity of TN, this compound and related podophyllotoxins are promising candidates to be further developed as novel therapeutics for treating cancer [44]. Within this process, one may consider whether simultaneous block of P2X7 is a beneficial second mode of action or should be avoided.
Agelasines and related substances are natural compounds with a terpene–purine structure isolated from marine sponges (Agelas dispar and other Agelas spp.). More than ten such natural products are currently known. These compounds have gained attention because of their biological activity to confer cytotoxicity towards cancer cell lines (minimal inhibitory concentrations of ca. 1 μM; for review see [45]), as well as their anti-bacterial, anti-fungal and anti-protozoal properties [46–49]. New analogues have been synthesized with activities against Mycobacterium tuberculosis, protozoa such as Plasmodium falciparum and Leishmania infantum as well as against drug-resistant cancer cell lines [50]. Recent studies with AGL B demonstrated a potent inhibition of the endoplasmatic reticulum Ca2+-ATPase, activation of caspase 8, reduced expression of the anti-apoptotic protein Bcl-2 and induction of apoptosis [51]. Moreover, this compound induced cytotoxicity in two human breast cancer cell lines (MCF-7 and SKBr3) at IC50 values of about 3 μM. The additional facilitation of P2X7 may assist in promoting apoptotic cell death in the presence of ATP (or the more potent agonist BzATP). It is conceivable that isoform-discriminating positive allosteric modulators like AGL could amplify the action of P2X7 agonists to increase their anti-tumour effectiveness. Furthermore, because high ATP could produce non-specific responses, combined administration with such positive modulators (may be also as add-on medication with chemotherapeutics) could be a better treatment modality in humans. In accordance with this, agelasines could be valuable compounds for the development of new anti-tumour drugs. In addition, augmentation of the P2X7-dependent elimination of intracellular mycobacteria in immune cells [52] may contribute to the antibacterial effects of AGL.
GA, a natural xanthone compound derived from the gamboge resin of several evergreen trees (e.g. Garcinia hanburyi and Garcinia morella), has a long history of medical use in southeast Asia. It was and still is being used in the treatment of chronic dermatitis, bedsore, haemorrhoids, tapeworms, etc. [53]. Only recently, pharmaceutical studies focused on the isolation of gamboge constituents and their anti-tumour activities [53]. For instance, gambogic acid, which is structurally related to GA, displays anti-tumour activity and has been shown to suppress anti-apoptotic Bcl-2 family proteins as one of its cytotoxic mechanisms [54]. In addition, cytotoxic activity against various human carcinoma cell lines in culture (IC50 values of 2–3 μM) has been reported [55]. Thus, future studies may assess the possible involvement of P2X7 modulation in such biological activities.
Taken together, the present findings should provide a solid basis for further studies to clarify the mechanism of negative or positive allosteric modulation of P2X7 [56]. Because high concentrations of these compounds may also modulate other receptor systems or ion channels like it is known for IVM [20], their selectivity must be verified in more detail. The potential for further structural modifications make the three natural products investigated attractive starting points for further optimization. However, clinical efficacy, e.g. the pronounced anti-tumour properties mentioned above, must not necessarily rely on a high selectivity for P2X7 alone, but may be the interplay of hitherto unknown diverse effects for each of the three compounds. In this regard, some of the natural compounds may offer advantages over highly selective synthetic substances. But further studies would be required to prove this. According to the exciting role of P2X7 signalling in inflammation, neurodegenerative disorders and cancer, selective antagonists but also various allosteric P2X7 modulators may represent appealing new strategies to complement current therapeutic and to tackle diseases with high unmet medical needs.
Acknowledgments
The authors are grateful to Mrs. H. Sobottka and Dipl.-Biol. A. Schulze for expert help in cell culturing, Dipl.-Biophys. A. Klein for supporting graphic presentations, Mrs. K. Becker for immunostaining and Dr. U. Krügel and Mrs. A.-K. Krause for providing the P2X7 knockout mice. This work was financial supported by the Deutsche Forschungsgemeinschaft within the framework of the Research Group FOR 748.
Abbreviations
- A-438079
3-[[5-(2,3-Dichlorophenyl)-1H-tetrazol-1yl]methyl]pyridine hydrochloride hydrate
- AZ 10606120
N-[2-[[2-[(2-Hydroxyethyl)amino]ethyl]amino]-5-quinolinyl]-2-tricyclo[3.3.1.13,7]dec-1-ylacetamide dihydrochloride
- AGL
Agelasine
- [Ca2+]i
Intracellular free Ca2+ concentration
- GA
Garcinolic acid
- HBS
HEPES-buffered solution
- HEKhP2X7 cells
Human embryonic kidney 293 cells stably transfected with the human P2X7 receptor
- IVM
Ivermectin
- PPADS
Pyridoxalphosphate-6-azophenyl-2′,4′-disulfonate tetrasodium salt hydrate
- RB2
Reactive blue
- TN
Teniposide
References
- 1.Coddou C, Yan Z, Obsil T, Huidobro-Toro JP, Stojilkovic SS. Activation and regulation of purinergic P2X receptor channels. Pharmacol Rev. 2011;63(3):641–683. doi: 10.1124/pr.110.003129. [DOI] [PMC free article] [PubMed] [Google Scholar]
- 2.Kaczmarek-Hájek K, Lörinczi E, Hausmann R, Nicke A. Molecular and functional properties of P2X receptors—recent progress and persisting challenges. Purinergic Signal. 2012;8(3):375–417. doi: 10.1007/s11302-012-9314-7. [DOI] [PMC free article] [PubMed] [Google Scholar]
- 3.Volonté C, Apolloni S, Skaper SD, Burnstock G. P2X7 receptors: channels, pores and more. CNS Neurol Disord Drug Targets. 2012;11(6):705–721. doi: 10.2174/187152712803581137. [DOI] [PubMed] [Google Scholar]
- 4.Jiang LH, Baldwin JM, Roger S, Baldwin SA. Insights into the molecular mechanisms underlying mammalian P2X7 receptor functions and contributions in diseases, revealed by structural modeling and single nucleotide polymorphisms. Front Pharmacol. 2013;4:55. doi: 10.3389/fphar.2013.00055. [DOI] [PMC free article] [PubMed] [Google Scholar]
- 5.Pelegrin P, Surprenant A. The P2X7 receptor-pannexin connection to dye uptake and IL-1β release. Purinergic Signal. 2009;5(2):129–137. doi: 10.1007/s11302-009-9141-7. [DOI] [PMC free article] [PubMed] [Google Scholar]
- 6.Khakh BS, North RA. Neuromodulation by extracellular ATP and P2X receptors in the CNS. Neuron. 2012;76(1):51–69. doi: 10.1016/j.neuron.2012.09.024. [DOI] [PMC free article] [PubMed] [Google Scholar]
- 7.Skaper SD, Debetto P, Giusti P. The P2X7 purinergic receptor: from physiology to neuronal disorders. FASEB J. 2010;24(2):337–345. doi: 10.1096/fj.09-138883. [DOI] [PubMed] [Google Scholar]
- 8.Burnstock G, Kennedy C. P2X receptors in health and disease. Adv Pharmacol. 2011;61:333–372. doi: 10.1016/B978-0-12-385526-8.00011-4. [DOI] [PubMed] [Google Scholar]
- 9.Wiley JS, Sluyter R, Gu BJ, Stokes L, Fuller SJ. The human P2X7 receptor and its role in innate immunity. Tissue Antigens. 2011;78(5):321–332. doi: 10.1111/j.1399-0039.2011.01780.x. [DOI] [PubMed] [Google Scholar]
- 10.Sluyter R, Stokes L. Significance of P2X7 receptor variants to human health and disease. Recent Pat DNA Gene Seq. 2011;5(1):41–54. doi: 10.2174/187221511794839219. [DOI] [PubMed] [Google Scholar]
- 11.Solle M, Labasi J, Perregaux DG, Stam E, Petrushova N, Koller BH, Griffiths RJ, Gabel CA. Altered cytokine production in mice lacking P2X7 receptors. J Biol Chem. 2001;276(1):125–132. doi: 10.1074/jbc.M006781200. [DOI] [PubMed] [Google Scholar]
- 12.Labasi JM, Petrushova N, Donovan C, McCurdy S, Lira P, Payette MM, Brissette W, Wicks JR, Audoly L, Gabel CA. Absence of the P2X7 receptor alters leukocyte function and attenuates an inflammatory response. J Immunol. 2002;168(12):6436–6445. doi: 10.4049/jimmunol.168.12.6436. [DOI] [PubMed] [Google Scholar]
- 13.Chessell IP, Hatcher JP, Bountra C, Michel AD, Hughes JP, Green P, Egerton J, Murfin M, Richardson J, Peck WL, Grahames CB, Casula MA, Yiangou Y, Birch R, Anand P, Buell GN. Disruption of the P2X7 purinoceptor gene abolishes chronic inflammatory and neuropathic pain. Pain. 2005;114(3):386–396. doi: 10.1016/j.pain.2005.01.002. [DOI] [PubMed] [Google Scholar]
- 14.Romagnoli R, Baraldi PG, Cruz-Lopez O, Lopez-Cara C, Preti D, Borea PA, Gessi S. The P2X7 receptor as a therapeutic target. Expert Opin Ther Targets. 2008;12(5):647–661. doi: 10.1517/14728222.12.5.647. [DOI] [PubMed] [Google Scholar]
- 15.Gunosewoyo H, Kassiou M. P2X purinergic receptor ligands: recently patented compounds. Expert Opin Ther Pat. 2010;20(5):625–646. doi: 10.1517/13543771003702424. [DOI] [PubMed] [Google Scholar]
- 16.Stock TC, Bloom BJ, Wei N, Ishaq S, Park W, Wang X, Gupta P, Mebus CA. Efficacy and safety of CE-224,535, an antagonist of P2X7 receptor, in treatment of patients with rheumatoid arthritis inadequately controlled by methotrexate. J Rheumatol. 2012;39(4):720–727. doi: 10.3899/jrheum.110874. [DOI] [PubMed] [Google Scholar]
- 17.Regen T, van Rossum D, Scheffel J, Kastriti ME, Revelo NH, Prinz M, Brück W, Hanisch UK. CD14 and TRIF govern distinct responsiveness and responses in mouse microglial TLR4 challenges by structural variants of LPS. Brain Behav Immun. 2011;25(5):957–970. doi: 10.1016/j.bbi.2010.10.009. [DOI] [PubMed] [Google Scholar]
- 18.Nelson DW, Sarris K, Kalvin DM, Namovic MT, Grayson G, Donnelly-Roberts DL, Harris R, Honore P, Jarvis MF, Faltynek CR, Carroll WA. Structure-activity relationship studies on N′-aryl carbohydrazide P2X7 antagonists. J Med Chem. 2008;51(10):3030–3044. doi: 10.1021/jm701516f. [DOI] [PubMed] [Google Scholar]
- 19.Michel AD, Chambers LJ, Clay WC, Condreay JP, Walter DS, Chessell IP. Direct labelling of the human P2X7 receptor and identification of positive and negative cooperativity of binding. Br J Pharmacol. 2007;151(1):103–114. doi: 10.1038/sj.bjp.0707196. [DOI] [PMC free article] [PubMed] [Google Scholar]
- 20.Nörenberg W, Sobottka H, Hempel C, Plötz T, Fischer W, Schmalzing G, Schaefer M. Positive allosteric modulation by ivermectin of human but not murine P2X7 receptors. Br J Pharmacol. 2012;167(1):48–66. doi: 10.1111/j.1476-5381.2012.01987.x. [DOI] [PMC free article] [PubMed] [Google Scholar]
- 21.Surprenant A, Rassendren F, Kawashima E, North RA, Buell G. The cytolytic P2Z receptor for extracellular ATP identified as a P2X receptor (P2X7) Science. 1996;272(5262):735–738. doi: 10.1126/science.272.5262.735. [DOI] [PubMed] [Google Scholar]
- 22.Carroll WA, Donnelly-Roberts D, Jarvis MF. Selective P2X7 receptor antagonists for chronic inflammation and pain. Purinergic Signal. 2009;5(1):63–73. doi: 10.1007/s11302-008-9110-6. [DOI] [PMC free article] [PubMed] [Google Scholar]
- 23.Guile SD, Alcaraz L, Birkinshaw TN, Bowers KC, Ebden MR, Furber M, Stocks MJ. Antagonists of the P2X7 receptor. From lead identification to drug development. J Med Chem. 2009;52(10):3123–3141. doi: 10.1021/jm801528x. [DOI] [PubMed] [Google Scholar]
- 24.Friedle SA, Curet MA, Watters JJ. Recent patents on novel P2X7 receptor antagonists and their potential for reducing central nervous system inflammation. Recent Pat CNS Drug Discov. 2010;5(1):35–45. doi: 10.2174/157488910789753530. [DOI] [PMC free article] [PubMed] [Google Scholar]
- 25.Sanz JM, Di Virgilio F. Kinetics and mechanism of ATP-dependent IL-1 beta release from microglial cells. J Immunol. 2000;164(9):4893–4898. doi: 10.4049/jimmunol.164.9.4893. [DOI] [PubMed] [Google Scholar]
- 26.Arbeloa J, Pérez-Samartín A, Gottlieb M, Matute C. P2X7 receptor blockade prevents ATP excitotoxicity in neurons and reduces brain damage after ischemia. Neurobiol Dis. 2012;45(3):954–961. doi: 10.1016/j.nbd.2011.12.014. [DOI] [PubMed] [Google Scholar]
- 27.Ryu JK, McLarnon JG. Block of purinergic P2X7 receptor is neuroprotective in an animal model of Alzheimer’s disease. Neuroreport. 2008;19(17):1715–1719. doi: 10.1097/WNR.0b013e3283179333. [DOI] [PubMed] [Google Scholar]
- 28.Takenouchi T, Sekiyama K, Sekigawa A, Fujita M, Waragai M, Sugama S, Iwamaru Y, Kitani H, Hashimoto M. P2X7 receptor signaling pathway as a therapeutic target for neurodegenerative diseases. Arch Immunol Ther Exp (Warsz) 2010;58(2):91–96. doi: 10.1007/s00005-010-0069-y. [DOI] [PubMed] [Google Scholar]
- 29.Le Feuvre RA, Brough D, Touzani O, Rothwell NJ. Role of P2X7 receptors in ischemic and excitotoxic brain injury in vivo. J Cereb Blood Flow Metab. 2003;23(3):381–384. doi: 10.1097/00004647-200303000-00013. [DOI] [PubMed] [Google Scholar]
- 30.White N, Butler PE, Burnstock G. Human melanomas express functional P2X7 receptors. Cell Tissue Res. 2005;321(3):411–418. doi: 10.1007/s00441-005-1149-x. [DOI] [PubMed] [Google Scholar]
- 31.White N, Knight GE, Butler PE, Burnstock G. An in vivo model of melanoma: treatment with ATP. Purinergic Signal. 2009;5(3):327–333. doi: 10.1007/s11302-009-9156-0. [DOI] [PMC free article] [PubMed] [Google Scholar]
- 32.Deli T, Csernoch L. Extracellular ATP and cancer: an overview with special reference to P2 purinergic receptors. Pathol Oncol Res. 2008;14(3):219–231. doi: 10.1007/s12253-008-9071-7. [DOI] [PubMed] [Google Scholar]
- 33.Farrell AW, Gadeock S, Pupovac A, Wang B, Jalilian I, Ranson M, Sluyter R. P2X7 receptor activation induces cell death and CD23 shedding in human RPMI 8226 multiple myeloma cells. Biochim Biophys Acta. 2010;1800(11):1173–1182. doi: 10.1016/j.bbagen.2010.07.001. [DOI] [PubMed] [Google Scholar]
- 34.Di Virgilio F, Ferrari D, Adinolfi E. P2X7: a growth-promoting receptor—implications for cancer. Purinergic Signal. 2009;5(2):251–256. doi: 10.1007/s11302-009-9145-3. [DOI] [PMC free article] [PubMed] [Google Scholar]
- 35.Stagg J, Smyth MJ. Extracellular adenosine triphosphate and adenosine in cancer. Oncogene. 2010;29(39):5346–5358. doi: 10.1038/onc.2010.292. [DOI] [PubMed] [Google Scholar]
- 36.Ryu JK, Jantaratnotai N, Serrano-Perez MC, McGeer PL, McLarnon JG. Block of purinergic P2X7 receptors inhibits tumor growth in a C6 glioma brain tumor animal model. J Neuropathol Exp Neurol. 2011;70(1):13–22. doi: 10.1097/NEN.0b013e318201d4d4. [DOI] [PubMed] [Google Scholar]
- 37.Jelassi B, Chantôme A, Alcaraz-Pérez F, Baroja-Mazo A, Cayuela ML, Pelegrin P, Surprenant A, Roger S. P2X7 receptor activation enhances SK3 channels- and cystein cathepsin-dependent cancer cells invasiveness. Oncogene. 2011;30(18):2108–2122. doi: 10.1038/onc.2010.593. [DOI] [PubMed] [Google Scholar]
- 38.You V. Podophyllotoxin derivatives: current synthetic approaches for new anticancer agents. Curr Pharm Des. 2005;11(13):1695–1717. doi: 10.2174/1381612053764724. [DOI] [PubMed] [Google Scholar]
- 39.Li J, Chen W, Zhang P, Li N. Topoisomerase II trapping agent teniposide induces apoptosis and G2/M or S phase arrest of oral squamous cell carcinoma. World J Surg Oncol. 2006;4:41. doi: 10.1186/1477-7819-4-41. [DOI] [PMC free article] [PubMed] [Google Scholar]
- 40.Rivera GK, Pui CH, Santana VM, Pratt CB, Crist WM. Epipodophyllotoxins in the treatment of childhood cancer. Cancer Chemother Pharmacol. 1994;34(Suppl):S89–S95. doi: 10.1007/BF00684870. [DOI] [PubMed] [Google Scholar]
- 41.Hande KR. Clinical applications of anticancer drugs targeted to topoisomerase II. Biochim Biophys Acta. 1998;1400(1–3):173–184. doi: 10.1016/S0167-4781(98)00134-1. [DOI] [PubMed] [Google Scholar]
- 42.Rodman JH, Furman WL, Sunderland M, Rivera G, Evans WE. Escalating teniposide systemic exposure to increase dose intensity for pediatric cancer patients. J Clin Oncol. 1993;11(2):287–293. doi: 10.1200/JCO.1993.11.2.287. [DOI] [PubMed] [Google Scholar]
- 43.Nagai N, Shikii T, Mihara K, Ogata H, Sasaki Y. Improved high-performance liquid chromatographic analysis of teniposide in human plasma. J Chromatogr B Biomed Sci Appl. 1998;709(2):315–319. doi: 10.1016/S0378-4347(98)00059-0. [DOI] [PubMed] [Google Scholar]
- 44.Lv M, Xu H. Recent advances in semisynthesis, biosynthesis, biological activities, mode of action, and structure–activity relationship of podophyllotoxins: an update (2008–2010) Mini Rev Med Chem. 2011;11(10):901–909. doi: 10.2174/138955711796575461. [DOI] [PubMed] [Google Scholar]
- 45.Gordaliza M. Terpenyl-purines from the sea. Mar Drugs. 2009;7(4):833–849. doi: 10.3390/md7040833. [DOI] [PMC free article] [PubMed] [Google Scholar]
- 46.Proszenyák Á, Charnock C, Hedner E, Larsson R, Bohlin L, Gundersen LL. Synthesis, antimicrobial and antineoplastic activities for agelasine and agelasimine analogs with a beta-cyclocitral derived substituent. Arch Pharm Chem Life Sci. 2007;340(12):625–634. doi: 10.1002/ardp.200700137. [DOI] [PubMed] [Google Scholar]
- 47.Vik A, Hedner E, Charnock C, Tangen LW, Samuelsen Ø, Larsson R, Bohlin L, Gundersen LL. Antimicrobial and cytotoxic activity of agelasine and agelasimine analogs. Bioorg Med Chem. 2007;15(12):4016–4037. doi: 10.1016/j.bmc.2007.03.086. [DOI] [PubMed] [Google Scholar]
- 48.Vik A, Proszenyák Á, Vermeersch M, Cos P, Maes L, Gundersen LL. Screening of agelasine D and analogs for inhibitory activity against pathogenic protozoa; identification of hits for visceral leishmaniasis and Chagas disease. Molecules. 2009;14(1):279–288. doi: 10.3390/molecules14010279. [DOI] [PMC free article] [PubMed] [Google Scholar]
- 49.Sjögren M, Dahlström M, Hedner E, Jonsson PR, Vik A, Gundersen LL, Bohlin L. Antifouling activity of the sponge metabolite agelasine D and synthesised analogs on Balanus improvisus. Biofouling. 2008;24(4):251–258. doi: 10.1080/08927010802072753. [DOI] [PubMed] [Google Scholar]
- 50.Roggen H, Charnock C, Burman R, Felth J, Larsson R, Bohlin L, Gundersen LL. Antimicrobial and antineoplastic activities of agelasine analogs modified in the purine 2-position. Arch Pharm Chem Life Sci. 2011;344(1):50–55. doi: 10.1002/ardp.201000148. [DOI] [PubMed] [Google Scholar]
- 51.Pimentel AA, Felibertt P, Sojo F, Colman L, Mayora A, Silva ML, Rojas H, Dipolo R, Suarez AI, Compagnone RS, Arvelo F, Galindo-Castro I, De Sanctis JB, Chirino P, Benaim G. The marine sponge toxin agelasine B increases the intracellular Ca2+ concentration and induces apoptosis in human breast cancer cells (MCF-7) Cancer Chemother Pharmacol. 2012;69(1):71–83. doi: 10.1007/s00280-011-1677-x. [DOI] [PubMed] [Google Scholar]
- 52.Biswas D, Qureshi OS, Lee WY, Croudace JE, Mura M, Lammas DA. ATP-induced autophagy is associated with rapid killing of intracellular mycobacteria within human monocytes/macrophages. BMC Immunol. 2008;9:35. doi: 10.1186/1471-2172-9-35. [DOI] [PMC free article] [PubMed] [Google Scholar]
- 53.Han QB, Wang YL, Yang L, Tso TF, Qiao CF, Song JZ, Xu LJ, Chen SL, Yang DJ, Xu HX. Cytotoxic polyprenylated xanthones from the resin of Garcinia hanburyi. Chem Pharm Bull (Tokyo) 2006;54(2):265–267. doi: 10.1248/cpb.54.265. [DOI] [PubMed] [Google Scholar]
- 54.Zhai D, Jin C, Shiau CW, Kitada S, Satterthwait AC, Reed JC. Gambogic acid is an antagonist of antiapoptotic Bcl-2 family proteins. Mol Cancer Ther. 2008;7(6):1639–1646. doi: 10.1158/1535-7163.MCT-07-2373. [DOI] [PMC free article] [PubMed] [Google Scholar]
- 55.Deng YX, Pan SL, Zhao SY, Wu MQ, Sun ZQ, Chen XH, Shao ZY. Cytotoxic alkoxylated xanthones from the resin of Garcinia hanburyi. Fitoterapia. 2012;83(8):1548–1552. doi: 10.1016/j.fitote.2012.08.023. [DOI] [PubMed] [Google Scholar]
- 56.Michel AD, Chambers LJ, Walter DS (2008) Negative and positive allosteric modulators of the P2X7 receptor. Br J Pharmacol 153(4):737–750 [DOI] [PMC free article] [PubMed]


