

Abstract
Cyanobacteria are Gram-negative bacteria that are desirable hosts for biodiesel production, because they are photosynthetic, relatively fast growing, and can secrete products. We have reconstituted the fatty acid synthase (FAS) of the cyanobacterium Synechococcus sp. PCC 7002 and subjected it to in vitro kinetic analysis. Our data revealed that the overall rate of this metabolic pathway is exclusively limited by the FabH ketosynthase, which initiates product synthesis by condensing malonyl-ACP with acetyl-CoA to form acetoacetyl-ACP. This finding sharply contrasts with our previous findings that the E. coli FAS is predominantly limited by its dehydratase (FabZ) and enoyl reductase (FabI) activities and that FabH activity is not limiting. We therefore reconstituted and analyzed a set of “hybrid” FASs. When the Synechococcus FabH was used to replace its counterpart in the reconstituted E. coli FAS, the resulting synthase was strongly limited by FabH activity. Conversely, replacement of the E. coli FabZ with its Synechococcus homolog dramatically alleviated the dependence of E. coli FAS activity on FabZ. In agreement with this finding, introduction of the E. coli FabH in the Synechococcus FAS virtually eliminated its dependence on this subunit, whereas substitution of the Synechococcus FabZ with its E. coli homolog shifted a substantial fraction of the overall flux control in the Synechococcus FAS to FabZ. Our findings demonstrate that the rate-limiting steps can differ dramatically between closely related bacterial fatty acid synthases, and that such regulatory behavior is fundamentally the property of the controlling enzyme(s).
Keywords: Fatty acid biosynthesis, FabI, FabZ, E. coli, cyanobacteria, biofuel
1. Introduction
In the search for new biofuels, products from fatty acid pathways are attractive targets (Peralta-Yahya et al., 2012; Blatti et al., 2013; Zhang et al., 2012). The goal is to harness a microbe's capacity for fatty acid biosynthesis to synthesize products such as medium and long chain esters, alcohols, alkenes and even alkanes (Schirmer et al., 2010; Howard et al., 2013). Although biosynthesis of most of these compounds is presently limited by late-stage enzymatic transformations such as fatty acid decarboxylation (Akhtar et al., 2013) or esterification (Steen et al., 2010), the challenge of enhancing carbon flux from central carbon metabolism into fatty acid biosynthesis is arguably most critical to the ultimate success of this biofuel strategy.
Cyanobacteria are attractive hosts for biofuel production, because they are photosynthetic and therefore do not require organic compounds as raw materials (Oliver et al., 2013). They can secrete fatty acids, making downstream processing amenable to continuous culture technologies (Wijffels et al., 2013). Recently, the production of fatty acid derivatives in cyanobacteria at titers of a few hundred mg per liter has been reported (Liu et al., 2011).
Synechococcus sp. PCC 7002 (S.7002) is one of the fastest growing cyanobacteria with a completely sequenced genome, a doubling time of 2.6 h under optimal conditions, and the availability of robust methods for genetic manipulation (Ludwig and Bryant, 2012). Indeed, the feasibility of producing alkanes in this Gram-negative bacterium has already been demonstrated (Reppas and Ridley, 2010). Notwithstanding this potential, little is known about the S.7002 fatty acid synthase (FAS) (Fig. 1A), especially when contrasted with our knowledge of the E. coli FAS (White et al., 2005). We therefore sought to reconstitute the complete FAS of S.7002 from individually purified protein components, and to quantitatively compare its system properties to those of its fully reconstituted E. coli counterpart (Yu, 2011; Xiao, 2013).
Figure 1. The S.7002 FAS pathway and purified proteins.
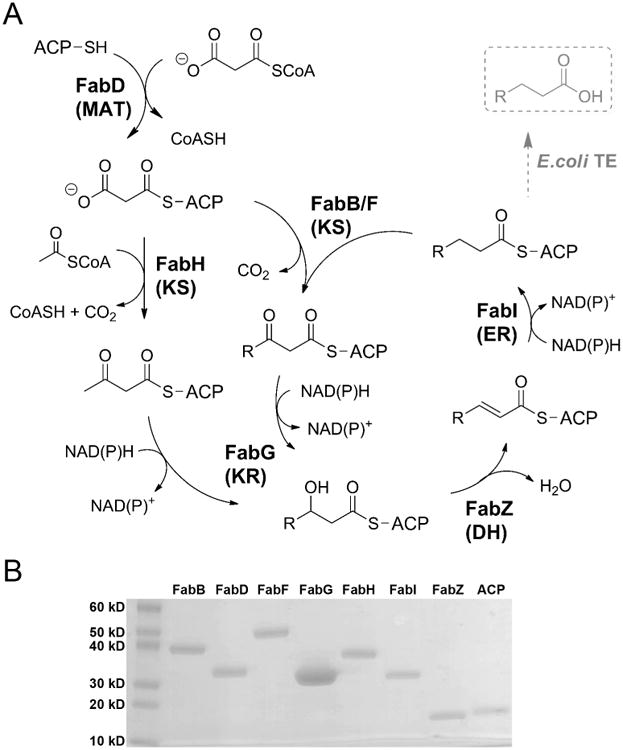
(A) The catalytic cycle begins with transacylation of malonyl-CoA onto ACP. ACP: acyl carrier protein; MAT: malonyl-CoA:ACP transacylase; KS: β-ketoacyl-ACP synthase; KR: β-ketoacyl-ACP reductase; DH: dehydratase; ER: enoyl-ACP reductase; TE: thioesterase. (B) Purified S.7002 proteins analyzed by SDS-PAGE. The molecular weight of each protein is listed in Table 1.
2. Materials and Methods
2.1 Plasmid Construction
Synechococcus sp. PCC 7002 FAS genes were identified by BLAST searches comparing the FAS components of E. coli BL21(DE3). Genes were amplified from S.7002 genomic DNA (ATCC 27264D-5) by PCR and inserted into pET28a(+) vector (Novagen) using restriction enzymes (New England Biolabs) and T4 DNA ligase (Invitrogen). Cloning was in E. coli DH5α (Invitrogen).
2.2 Protein Expression
All proteins were expressed and purified by a similar procedure as described previously (Yu et al., 2011). Plasmids were introduced into E. coli BL21(DE3) by electroporation. Single colonies were grown in 11 mL seed cultures of LB-Miller with 50 μg/mL kanamycin and shaken at 37°C, then inoculated into 1L cultures grown under the same conditions. Cultures were transferred to 18°C at OD600∼0.3-0.45, induced with 100 μM IPTG at OD600∼0.5-0.8, and grown for an additional 17-20 h. Cells were harvested by centrifugation at 5,000 rpm (Beckman-Coulter Avanti J-E) and resuspended in 30 mL Buffer A (50 mM Tris, 2 mM DTT, pH 7.5 or 9.0). Buffer pH 9.0 was selected if the calculated isoelectric point of the protein chain (http://www.scripps.edu/∼cdputnam/protcalc.html) was above 6.9; otherwise, pH 7.5 buffer was used. Resuspended cells were lysed by sonication for 5-6 × 1 min cycles of 1 pulse/sec (Branson Sonifier 450). Lysates were centrifuged at 45,000 rpm and incubated with Ni-NTA resin for ∼1 h. Resin was applied to a column and washed with 40 mM imidazole in Buffer A and eluted with 250-400 mM imidazole in Buffer A. The eluted protein was further purified by anion exchange chromatography (HiTrapQ, GE Healthcare) using a linear gradient of 0-1 M NaCl in Buffer A. Fractions were analyzed by SDS-PAGE on TGX gels (BioRad). Desired fractions were pooled, concentrated and exchanged into 100 mM phosphate pH 7.5 with Amicon Ultra centrifugal filters (Millipore). Aliquots were flash frozen with liquid nitrogen and stored at -80°C. ACP was produced in E. coli BAP1 to ensure phosphopantetheinylation to the active holo form (Pfeifer et al., 2001), and verified by MALDI-TOF (Stanford PAN Facility). Cultures expressing the E. coli thioesterase (TesA, without leader sequence (Cho and Cronan, 1995; Steen et al., 2010)) were grown at 30°C. Protein concentrations were determined by the BCA assay (Thermo Scientific).
2.3 UV In Vitro Kinetic Assay
Initial rates of fatty acid synthesis were measured using a spectrophotometric NAD(P)H consumption assay, as previously described (Xiao et al., 2013). FabG and FabI each oxidize one NAD(P)H per turnover (Fig. 1A), so absorbance changes from cofactor oxidation are directly related to the FAS elongation cycle. We quantified this as 14 cofactor units needed to produce one palmitic (C16) acid equivalent, as before (Yu et al., 2011). This stoichiometry was verified by GC-MS product quantification (see section 3.5). E. coli TesA cleaved the acyl-ACP species to form free fatty acids (Fig. 1A).
Protein components were mixed with 100 mM phosphate pH 7.5 containing 1 mM TCEP, 200 μM acetyl-CoA and 500 μM malonyl-CoA (≥90% pure; Sigma). Reactions were initiated with addition of 1.3-2 mM NAD(P)H. The 60 μL volume was mixed in an Eppendorf tube by tapping 5 times, and immediately transferred to a UVette (Eppendorf) plastic cuvette. Absorbance at 340 nm was measured in a LAMBDA 25 UV/Vis spectrophotometer (Perkin Elmer) at a path length of 0.2 cm, at ambient room temperature (23-25°C). Due to the need for large protein quantities and limitations in assay throughput, each dataset in this manuscript is derived from a single set of measurements. The standard errors reported in Table 3 correspond to errors in fitting the data to model equations. All experiments were repeated at least once to verify trends and parametric reproducibility.
Table 3. In vitro titration fit values.
Each S.7002 FAS assay mixture contained 1 μM S.7002 FabBDFGHIZ, 20 μM S.7002 ACP, and 30 μM E. coli TesA, with the titrated enzyme as the variable. Each assay mixture also contained 1 mM TCEP, 200 μM acetyl-CoA, 500 μM malonyl-CoA, 1 mM NADH and 1 mM NADPH. Initial rate vs. concentration plots were fitted with a Michaelis-Menten model with enzyme instead of substrate (v = vmax⋅E/(K50 + E)). E. coli FAS values are for fits in Figs. 2-4.
| S.7002 FAS | K50 (μM) | Vmax (μM C16 units / min) |
|---|---|---|
| S.7002 FabB a | 0.7 ± 1.8 | 28 |
| S.7002 FabD | ≪ 0.01 | 29 |
| S.7002 FabF | 0.09 ± 0.07 | 29 |
| S.7002 FabG | ≪ 0.01 | 25 |
| S.7002 FabH | 1.6 ± 0.3 | 55 |
| S.7002 FabI | 0.2 ± 0.1 | 25 |
| S.7002 FabZ | 0.07 ± 0.1 | 31 |
| S.7002 ACP (holo) | 4.3 ± 0.6 | 27 |
|
| ||
| E. coli FAS | K50 (μM) | Vmax (μM C16 units / min) |
|
| ||
| S.7002 FabH | 0.3 ± 0.09 | 37 |
| E. coli FabH | 0.04 ± 0.02 | 42 |
| S.7002 FabZ b | ≪0.01 | 90 |
| E. coli FabZ b | ∼ 5 | 50 |
| S.7002 FabI | 0.4 ± 0.08 | 45 |
| E. coli FabI | 0.1 ± 0.03 | 47 |
The poor FabB fit is because of a high initial rate at 0 μM (18 μM C16 units / min).
Titration data for FabZ in E. coli FAS did not result in a good fit to the above model; therefore, the values are estimates from Fig. 3B.
2.4 Product Profile Analysis (GC-MS)
For GC-MS analysis, reaction mixtures were prepared as described above for kinetic assays, except that the assay volume was 500 μL. After incubation at room temperature for 1 h, an additional aliquot of cofactors was added (0.1 μmol acetyl-CoA, 0.25 μmol malonyl-CoA, 0.5 μmol NADH, 0.5 μmol NADPH). In vitro reactions were then incubated overnight and quenched by addition of 5% (v/v) acetic acid along with 3.5 μM pentadecanoic acid as an internal standard. The mixture was extracted 3 times with equal volumes ethyl acetate, and the organic extracts were dried by Speedvac, resuspended in ∼60 μL butyl acetate, and derivatized using BSTFA. Samples were analyzed by GC-MS on a 6850 Series II Network GC System coupled with 5975B VL Mass Selective Detector (Agilent), using a DB1-HT (J&W) column. The temperature gradient was as follows: hold at 60°C for 3 min, heat to 320°C at a rate of 20°C/min, and hold at 320°C for 5 min. Three separate samples were all very similar, with one representative chromatogram shown below.
3. Results
3.1 Expression, purification and verification of activity of S.7002 FAS components
BLAST analysis using the E. coli FAS proteins as query sequences led to the identification of eight putative S.7002 homologs: FabB, FabD, FabF, FabG, FabH, FabI, FabZ and ACP (Table 1). A homolog of the FabA dehydratase/isomerase, involved in unsaturated fatty acid biosynthesis, was not identified. The S.7002 FabB homolog was selected based on its NCBI GenBank annotation, even though it showed only 29% identity with E. coli FabB and 36% identity with E. coli FabF. S.7002 genes were expressed in E. coli (Table 2), and the recombinant proteins were purified on Ni-NTA and anion exchange columns (Fig. 1B).
Table 1. S.7002 Protein characteristics.
NCBI GenBank Gene IDs and native molecular masses. % identity score from BLAST alignments. Isoelectric points (pI) calculated for 6xHis-tagged constructs.
| S.7002 Protein | Gene ID | Mol Wt (Da) | % Identity w/ E. coli homolog | pI |
|---|---|---|---|---|
| FabB | 6057393 | 41187 | 29 FabB, 36 FabF | 6.5 |
| FabD | 6055201 | 31230 | 40 | 5.9 |
| FabF | 6057571 | 43867 | 52 | 6.3 |
| FabG | 6057016 | 26889 | 54 | 7.3 |
| FabH | 6055818 | 35758 | 43 | 6.7 |
| FabI | 6056706 | 27347 | 49 | 6.9 |
| FabZ | 6056639 | 17243 | 48 | 7.4 |
| apo-ACP | 6057603 | 88890 | 57 | 4.5 |
Table 2. Strains and plasmids.
| Strains | Relevant Genotype | Reference |
|---|---|---|
| BL21(DE3) | E. coli B dcm ompT hsdS(rB-mB-) gal | Invitrogen |
| BAP1 | E. coli BL21(DE3): PT7:sfp | Pfeifer et al. 2001 |
| DH5α | Invitrogen | Invitrogen |
| Plasmids | Overexpressed gene / Description | Resistance | Reference |
|---|---|---|---|
| Synechococcus sp. PCC 7002 | |||
| pJK13 | S.PCC 7002 FabB / N-terminal 6xHis, NdeI/EcoRI sites of pET28a(+) | Kanamycin | This study |
| pJK02 | S.PCC 7002 FabD / N-terminal 6xHis, NdeI/EcoRI sites of pET28a(+) | Kanamycin | This study |
| pJK03 | S.PCC 7002 FabF / N-terminal 6xHis, NdeI/EcoRI sites of pET28a(+) | Kanamycin | This study |
| pJK04 | S.PCC 7002 FabG / N-terminal 6xHis, NdeI/EcoRI sites of pET28a(+) | Kanamycin | This study |
| pJK05 | S.PCC 7002 FabH / N-terminal 6xHis, NdeI/EcoRI sites of pET28a(+) | Kanamycin | This study |
| pJK06 | S.PCC 7002 FabI / N-terminal 6xHis, NdeI/EcoRI sites of pET28a(+) | Kanamycin | This study |
| pJK07 | S.PCC 7002 FabZ / N-terminal 6xHis, NdeI/EcoRI sites of pET28a(+) | Kanamycin | This study |
| pJK08 | S.PCC 7002 ACP / N-terminal 6xHis, NdeI/EcoRI sites of pET28a(+) | Kanamycin | This study |
| E. coli | |||
| pXY-FabA | E. coli FabA / N-terminal 6xHis, NdeI/EcoRI sites of pET28a(+) | Kanamycin | Yu et al. 2011 |
| pXY-FabB | E. coli FabB / N-terminal 6xHis, NdeI/XhoI sites of pET28a(+) | Kanamycin | Yu et al. 2011 |
| pXY-FabD | E. coli FabD / N-terminal 6xHis, NdeI/EcoRI sites of pET28a(+) | Kanamycin | Yu et al. 2011 |
| pXY- FabF | E. coli FabF / N-terminal 6xHis, NdeI/EcoRI sites of pET28a(+) | Kanamycin | Yu et al. 2011 |
| pXY-FabG | E. coli FabG / N-terminal 6xHis, NdeI/EcoRI sites of pET28a(+) | Kanamycin | Yu et al. 2011 |
| pXY-FabH | E. coli FabH / N-terminal 6xHis, NdeI/XhoI sites of pET28a(+) | Kanamycin | Yu et al. 2011 |
| pXY- FabI | E. coli FabI / N-terminal 6xHis, NdeI/EcoRI sites of pET28a(+) | Kanamycin | Yu et al. 2011 |
| pXY-FabZ | E. coli FabZ / N-terminal 6xHis, NdeI/EcoRI sites of pET28a(+) | Kanamycin | Yu et al. 2011 |
| pTL14 | E. coli ACP PT7: N- and C- terminal 6xHis, Origin of replication: pBR322 | Kanamycin | Liu et al. 2010 |
| pTL30 | E. coli TesA, w/o leader sequence, PT7: N-terminal 6xHis, Origin of replication: pBR322 | Kanamycin | Liu et al. 2010 |
To verify functional activity, each S.7002 FAS protein was added to the reconstituted E. coli FAS in place of its E. coli ortholog. The reference E. coli system contained 1 μM FabABDFGH, 10 μM FabIZ, 30 μM ACP and 30 μM TesA, a ratio previously optimized for maximum initial rate (Yu et al., 2011). In all cases, the S.7002 protein was able to replace its E. coli counterpart, at least qualitatively (data not shown). However, in contrast to the E. coli FabI, which can utilize both NADH and NADPH, the S.7002 enzyme had obligate specificity for NADH (see Fig. 4, below). In subsequent experiments, we therefore used an equimolar mixture of the two cofactors.
Figure 4. FabI in vitro titrations.
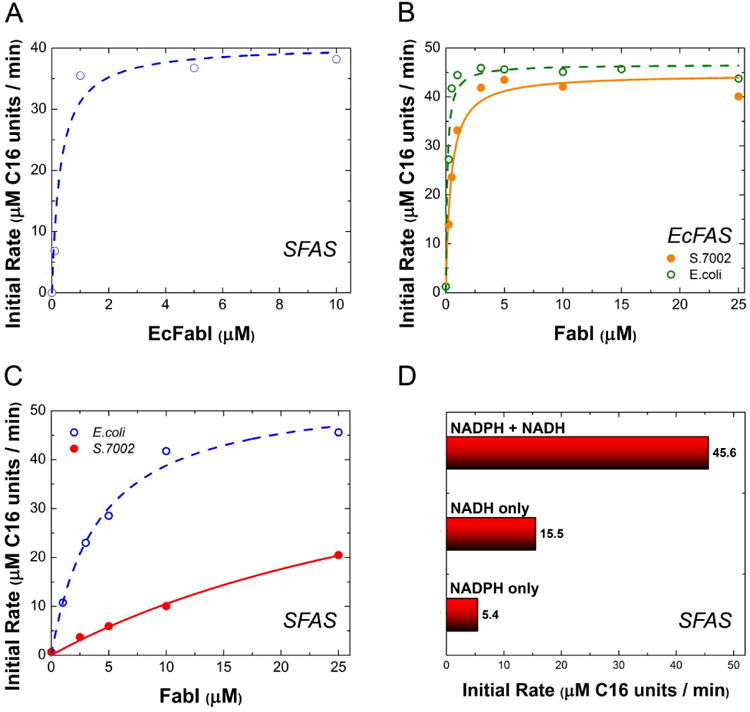
(A) E. coli FabI was titrated into a reconstituted system containing 1 μM S.7002 FabBDFGHZ, 15 μM S.7002 ACP and 30 μM E. coli TesA. Fit parameters: K50 ∼ 0.24±0.1 μM, vmax ∼ 38 μM C16 units/min. (B) S.7002 (filled circles, solid fit line) or E. coli (open circles, dashed fit line) FabI was titrated into a reconstituted system of 1 μM E. coli FabBDFGH, 10 μM E. coli FabZ, 30 μM E. coli ACP and 30 μM E. coli TesA. Each sample had 1 mM NADH and 1 mM NADPH. (C) Titrations of S.7002 (filled circles) or E. coli (open circles) FabI in a FAS comprising 1 μM S.7002 FabBDFGZ, 15 μM S.7002 FabH, 15 μM S.7002 ACP and 30 μM E. coli TesA. NADPH and NADH were present at a 10:1 ratio and a total concentration of 1.3 mM. Fit lines are to a Michaelis-Menten equation with enzyme as substrate. (D) To assess the cofactor dependence of the S.7002 FAS, the system was reconstituted under optimal turnover conditions of 1 μM FabBDFGIZ, 15 μM FabH, 15 μM ACP, and 30 μM E. coli TesA. In each case, 1.5 mM of indicated cofactor was added.
3.2 In vitro kinetic analysis
With each enzyme function verified, a reference S.7002 FAS was established consisting of 1 μM FabBDFGHIZ, 20 μM ACP, and 30 μM of the E. coli TesA. Titrations of individual S.7002 FAS proteins into this reference system revealed markedly different responses relative to the E. coli system (Yu, 2011; Xiao, 2013). Specifically, with a K50 value that was considerably higher than that of any other catalytic subunit under otherwise equivalent conditions, FabH was judged to be the exclusive rate-limiting enzyme in the S.7002 FAS (Fig. 2A; Table 3). Moreover, the ketosynthase FabF, but not FabB, was essential for FAS turnover.
Figure 2. FabH in vitro titrations.
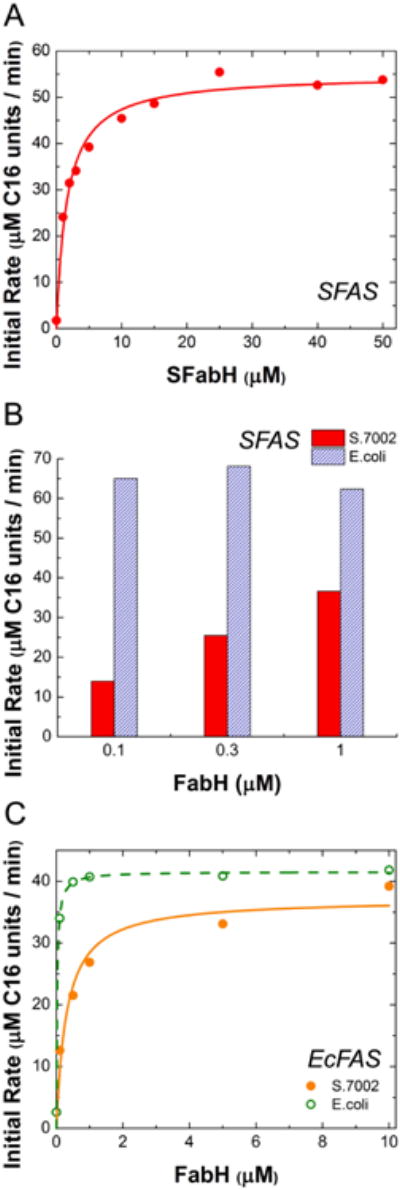
(A) S.7002 FabH in S.7002 FAS. The concentration of FabH was titrated in a reconstituted system containing 1 μM S.7002 FabBDFGIZ, 20 μM S.7002 ACP and 30 μM E. coli TesA. (B) Comparing S.7002 FabH (dark) and E. coli FabH (light) in S.7002 FAS, same conditions as in (A). (C) S.7002 FabH (filled circles, solid fit line) or E. coli FabH (open circles, dashed fit line) was titrated in a reconstituted system containing 1 μM E. coli FabABDFG, 10 μM E. coli FabIZ, 30 μM E. coli ACP and 30 μM E. coli TesA. All assay mixtures contained 1 mM NADH and 1 mM NADPH. Fit lines are to a Michaelis-Menten equation with enzyme as substrate.
To gain further insight into the mechanisms by which E. coli and Synechococcus sp. 7002 control the rate of fatty acid biosynthesis, we replaced S.7002 FabH with its E. coli ortholog. As seen in Fig. 2B, the S.7002 FAS attained maximum turnover rate in the presence of less than 1 μM of the E. coli enzyme, whereas more than 10 μM of the S.7002 enzyme was required to saturate the FAS. Conversely, when the S.7002 FabH was titrated into the E. coli FAS, a considerably higher concentration of this protein was required to attain maximum turnover rate than with the native FabH (Fig. 2C; Table 3).
Analogous observations were made when the rate-limiting subunits of the E. coli FAS were exchanged with their S.7002 orthologs. E. coli FabZ was rate limiting in both FAS systems, whereas the S.7002 FabZ was rate limiting in neither (Figs. 3A&B). Unlike FabZ however, the E. coli FabI did not transfer its previously reported rate-limiting behavior (Yu et al., 2011) to the S.7002 FAS. Both orthologs of FabI had comparable K50 values (ca. 0.2 μM; Fig. 4A and Table 3). Indeed, under our assay conditions, analogous results were observed with the E. coli FAS (Fig. 4B), implying that FabZ was the primary bottleneck in the E. coli synthase. To investigate the basis for this discrepancy, we analyzed the cofactor dependence of the two FabI orthologs. Whereas the E. coli FabI could use NADPH as effectively as NADH (Xiao et al., 2013), S. 7002 FabI required NADH for maximal activity (Fig. 4C&D).
Figure 3. FabZ in vitro titrations.
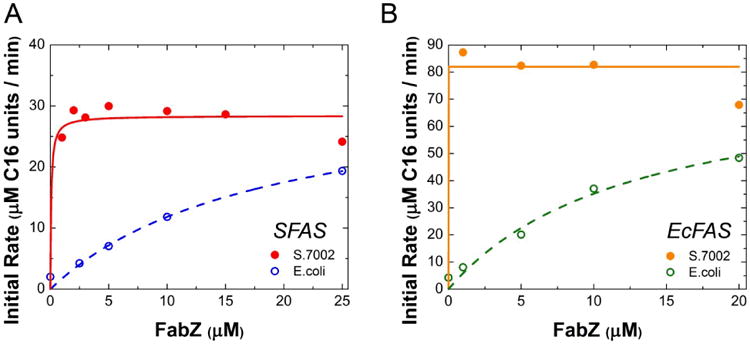
(A) S.7002 (filled circles, solid fit line) or E. coli (open circles, dashed fit line) FabZ was titrated in a reconstituted system containing 1 μM S.7002 FabBDFGHI, 15 μM S.7002 ACP and 30 μM E. coli TesA. (B) S.7002 (filled circles, solid fit line) or E. coli (open circles, dashed fit line) FabZ was titrated in a reconstituted system containing 1 μM E. coli FabBDFGH, 10 μM E. coli FabI, 30 μM E. coli ACP and 30 μM TesA. Each sample had 1 mM NADH and 1 mM NADPH. Fit lines are to a Michaelis-Menten equation with enzyme as substrate.
We also investigated the effect of replacing the S.7002 ACP. When the S.7002 ACP was replaced with its E. coli ortholog, the behavior of the S.7002 FAS was unaltered (Fig. 5A). Both ACP preparations were mostly in their active holo forms, as verified by MALDI-TOF (Fig. 5B&C).
Figure 5. ACP in vitro titrations.
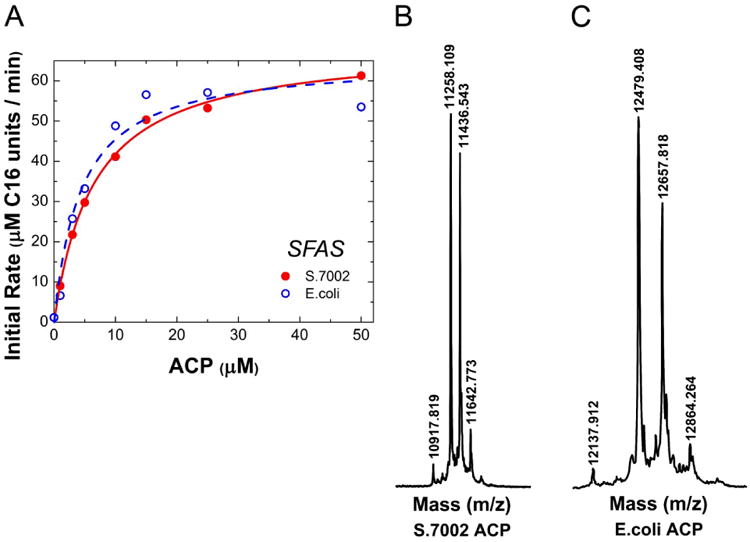
(A) S.7002 (filled circles, solid fit line) or E. coli (open circles, dashed fit line) ACP was titrated in a reconstituted system consisting of 1 μM S.7002 FabBDFGHIZ and 30 μM E. coli TesA. Fit parameters: S.7002, K50 = 6.5±0.4 μM, vmax = 69 μM C16 units/min; E. coli, K50 = 4.4±1 μM, vmax = 65 μM C16 units/min. All assays contained 1 mM NADH plus 1 mM NADPH. Fit lines are to a Michaelis-Menten equation with enzyme as substrate. (B) S.7002 ACP mass-to-charge chromatogram, MALDI-TOF. Peak 10917 corresponds to the apo form, 11258 the holo form and 11436 to the gluconylated holo form. (C) E. coli ACP mass-to-charge chromatogram, MALDI-TOF. Peak 12137 corresponds to the apo form, 12479 the holo form and 12657 to the gluconylated holo form.
From the above experiments, we concluded that FabH and ACP were the rate-limiting components in the S.7002 FAS and that, at a ratio of 1 μM FabBDFGIZ, 15 μM FabH and 15 μM ACP, a maximum fatty acid synthesis rate (C16 equivalents) of μ1 M·s-1 could be achieved. This maximum rate is entirely comparable with that reported previously for the E. coli FAS (Yu et al., 2011). To verify that individual protein components were at saturating concentrations under these conditions, an additional 10 μM of each S.7002 FAS component was added to the reconstituted system. In no case did the maximum rate change significantly (Fig. 6).
Figure 6. Optimized S.7002 FAS reconstituted system.
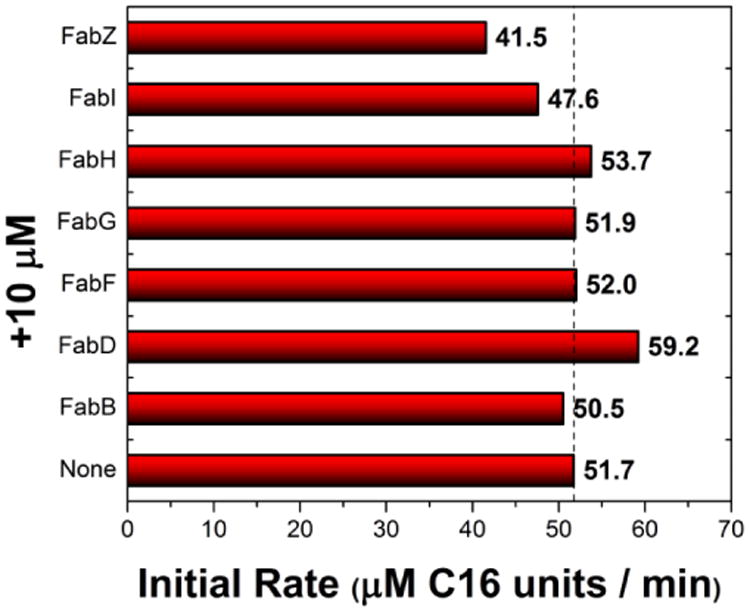
A S.7002 FAS consisting of 1 μM FabBDFGIZ, 15 μM FabH, 15 μM ACP and 30 μM E. coli TesA was chosen as an optimum ratio. An additional 10 μM of each indicated component was added. Whereas a modest increase in rate was observed upon addition of excess FabD, a multi-point titration of 0-20 μM added suggested that this finding was not significant (data not shown).
3.3 Product profile analysis of the S.7002 FAS
With E. coli TesA as the chain release mechanism, the major products of the S.7002 FAS were lauric acid, myristic acid, palmitic acid, and stearic acid (Fig. 7). Using the pentadecanoic acid as the internal standard, the ratios of these four principal products were 1:1:2:1.3, respectively. The predominant accumulation of C12-C18 fatty acids reflects the chain length specificity of E. coli TesA (Cho and Cronan, 1995; Liu et al., 2010). The total calculated NAD(P)H consumption to form these fatty acids was 93% that of the stoichiometrically predicted amount from complete consumption of malonyl-CoA (the limiting reagent of the system), thus verifying tight coupling between cofactor consumption and product formation under our assay conditions.
Figure 7. GC-MS products of optimal in vitro S.7002 FAS.
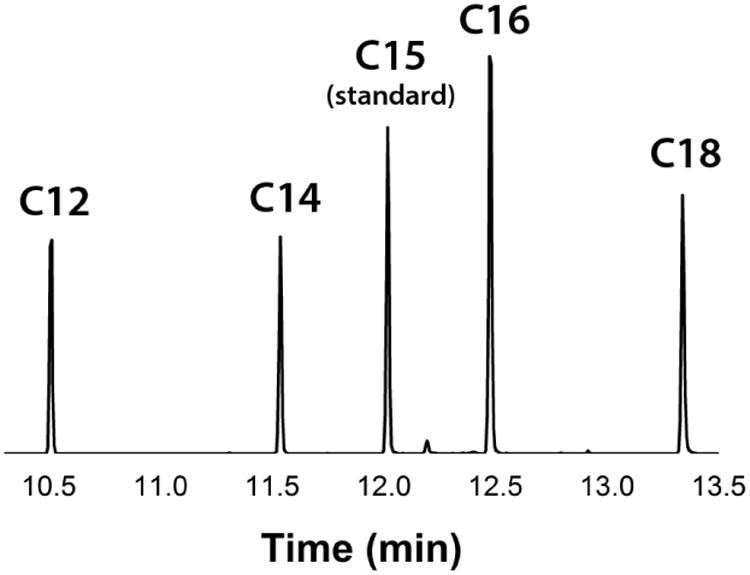
Product profile of the optimized S.7002 FAS, comprising of 1 μM FabBDFGIZ, 13 μM FabH, 13 μM ACP, and 25 μM E. coli TesA. All of the observed fatty acids were saturated. Pentadecanoic acid (C15) was added as an internal standard before the extraction process at 0.02 μmol. From the C15 standard integration, the corresponding amounts of other fatty acids are 0.013 μmol C12, 0.013 μmol C14, 0.027 μmol C16, and 0.017 μmol C18. Extracted for ion m/z = 117.
4. Discussion
In an effort to understand the quantitative differences between homologous fatty acid synthases from distantly related bacteria, we sought to compare the Synechococcus sp. PCC 7002 FAS with the well-characterized E. coli synthase. Our studies have revealed that, although individual subunits of the two systems are qualitatively interchangeable, they are very different from a quantitative standpoint. Whereas the turnover rate of the E. coli FAS is limited by its dehydratase FabZ and, to a lesser extent, by its enoyl reductase FabI (Yu et al., 2011), the S.7002 FAS is limited by FabH-catalyzed chain initiation. The evolutionary rationale for this difference in metabolic flux control is unclear. One possibility is that, whereas the degree of unsaturation of fatty acids in E. coli is controlled within the FAS (Xiao et al., 2013), this feature is controlled by desaturases that operate downstream of the FAS pathway in S.7002 (Sakamoto et al., 1994; Sakamoto and Bryant, 1997). Thus, the cyanobacterium adopts the more “conventional” approach of controlling the pathway at its first enzymatic step, whereas E. coli has adopted the strategy of branch-point control. Regardless of the evolutionary logic of these differences, our studies clearly highlight that metabolic rate control resides in individual enzymes as opposed to the entire system, and can therefore be transferred or ameliorated through subunit swapping. This has obvious implications for metabolic engineering of fatty acid-derived biofuels. For example, we have established a subunit ratio for the S.7002 synthase at which no single catalyst is rate limiting. Our data also suggests that overexpressing the endogenous FabH or replacing it with its E. coli ortholog should increase fatty acid flux in S.7002. Given the fact that fatty acid biosynthesis is a proven target for antibacterial agents such as isoniazid (an anti-tuberculosis drug) and triclosan (disinfectant), it also suggests a strategy for discovering species-specific antibiotics. The rate-limiting enzyme of a pathway is generally considered the best target for inhibition. Therefore, if fatty acid biosynthesis in two bacterial species is limited by the concentrations of different subunits, then an inhibitor against either rate-limiting component is likely to be species specific.
It is noteworthy that, whereas FabF from S.7002 is essential for fatty acid synthesis, FabB is dispensable (Table 3). In E. coli FabB has been shown to play an important role in controlling the degree of unsaturation of the fatty acid product. This property is controlled downstream of the fatty acid synthase in S.7002. We therefore speculate that FabB in this fast-growing organism plays an additional, yet to be discovered physiological role.
Last but not least, the observation that the S.7002 FabI has a strong preference for NADH is surprising, because photosynthesis yields NADPH in this bacterium. Either this suggests that an endogenous transhydrogenase is active under conditions where the bacterium produces fatty acids autotrophically, or that interconversion between these two forms of biological hydride equivalents represents a control point in metabolism. Overexpression of the soluble transhydrogenase from E. coli (Cao et al., 2011) increased NADH-dependent lactate production in cyanobacteria (Niederholtmeyer et al., 2010), suggesting that a similar strategy merits evaluation for increasing the productivity of fatty acid derivatives as well.
In conclusion, our findings set the stage for metabolic engineering of fatty acid biosynthesis in S.7002 by manipulating the relative ratios of protein components. In particular, FabH has emerged as a particularly attractive target for genetic engineering in this cyanobacterium species. The importance of species-specific pathway analysis is also highlighted by our observations that the rate-limiting step in S.7002 is distinct from that in E. coli, even though the enzymology of the two pathways is qualitatively identical.
Acknowledgments
We thank Joule Unlimited, Inc. (Bedford, MA) for partial financial support of this project, and Frank A. Skraly, Kevin Madden, Dan Robertson, Christian P. Ridley, Michael R. Connor, Ning Li, and Nicholas J. Skizim for advice. This research was supported in part by a grant from the NIH (R01 GM087934). We also thank LS9, Inc. (South San Francisco, CA) for access to their GC-MS instrument.
Abbreviations
- ACP
acyl carrier protein
- BSTFA
bistrifluoroacetamide
- FAS
fatty acid synthase
- GC-MS
gas chromatography-mass spectrometry
- S.7002
Synechococcus sp. PCC 7002
References
- 1.Akhtar MK, Turner NJ, Jones PR. Carboxylic acid reductase is a versatile enzyme for the conversion of fatty acids into fuels and chemical commodities. Proc Natl Acad Sci U S A. 2013;110:87–92. doi: 10.1073/pnas.1216516110. [DOI] [PMC free article] [PubMed] [Google Scholar]
- 2.Blatti JL, Michaud J, Burkart MD. Engineering fatty acid biosynthesis in microalgae for sustainable biodiesel. Curr Opin Chem Biol. 2013;17:496–505. doi: 10.1016/j.cbpa.2013.04.007. [DOI] [PubMed] [Google Scholar]
- 3.Cao Z, Song P, Xu Q, Su R, Zhu G. Overexpression and biochemical characterization of soluble pyridine nucleotide transhydrogenase from Escherichia coli. FEMS Microbiol Lett. 2011;320:9–14. doi: 10.1111/j.1574-6968.2011.02287.x. [DOI] [PubMed] [Google Scholar]
- 4.Cho H, Cronan JE., Jr Defective export of a periplasmic enzyme disrupts regulation of fatty acid synthesis. J Biol Chem. 1995;270:4216–9. doi: 10.1074/jbc.270.9.4216. [DOI] [PubMed] [Google Scholar]
- 5.Howard TP, Middelhaufe S, Moore K, Edner C, Kolak DM, Taylor GN, Parker DA, Lee R, Smirnoff N, Aves SJ, Love J. Synthesis of customized petroleum-replica fuel molecules by targeted modification of free fatty acid pools in Escherichia coli. Proc Natl Acad Sci U S A. 2013;110:7636–41. doi: 10.1073/pnas.1215966110. [DOI] [PMC free article] [PubMed] [Google Scholar]
- 6.Liu T, Vora H, Khosla C. Quantitative analysis and engineering of fatty acid biosynthesis in E. coli. Metab Eng. 2010;12:378–86. doi: 10.1016/j.ymben.2010.02.003. [DOI] [PubMed] [Google Scholar]
- 7.Liu X, Sheng J, Curtiss R., 3rd Fatty acid production in genetically modified cyanobacteria. Proc Natl Acad Sci U S A. 2011;108:6899–904. doi: 10.1073/pnas.1103014108. [DOI] [PMC free article] [PubMed] [Google Scholar]
- 8.Ludwig M, Bryant DA. Acclimation of the global transcriptome of the cyanobacterium Synechococcus sp. strain PCC 7002 to nutrient limitations and different nitrogen sources. Front Microbiol. 2012;3:145. doi: 10.3389/fmicb.2012.00145. [DOI] [PMC free article] [PubMed] [Google Scholar]
- 9.Niederholtmeyer H, Wolfstädter BT, Savage DF, Silver PA, Way JC. Engineering cyanobacteria to synthesize and export hydrophilic products. Appl Environ Microbiol. 2010;76:3462–6. doi: 10.1128/AEM.00202-10. [DOI] [PMC free article] [PubMed] [Google Scholar]
- 10.Oliver JW, Machado IM, Yoneda H, Atsumi S. Cyanobacterial conversion of carbon dioxide to 2,3-butanediol. Proc Natl Acad Sci U S A. 2013;110:1249–54. doi: 10.1073/pnas.1213024110. [DOI] [PMC free article] [PubMed] [Google Scholar]
- 11.Peralta-Yahya PP, Zhang F, del Cardayre SB, Keasling JD. Microbial engineering for the production of advanced biofuels. Nature. 2012;488:320–8. doi: 10.1038/nature11478. [DOI] [PubMed] [Google Scholar]
- 12.Pfeifer BA, Admiraal SJ, Gramajo H, Cane DE, Khosla C. Biosynthesis of complex polyketides in a metabolically engineered strain of E. coli. Science. 2001;291:1790–2. doi: 10.1126/science.1058092. [DOI] [PubMed] [Google Scholar]
- 13.Reppas NB, Ridley CP. Joule Unlimited Inc. Methods and compositions for the recombinant biosynthesis of n-alkanes. 7794969 2010
- 14.Sakamoto T, Bryant DA. Temperature-regulated mRNA accumulation and stabilization for fatty acid desaturase genes in the cyanobacterium Synechococcus sp. strain PCC 7002. Mol Microbiol. 1997;23:1281–92. doi: 10.1046/j.1365-2958.1997.3071676.x. [DOI] [PubMed] [Google Scholar]
- 15.Sakamoto T, Wada H, Nishida I, Ohmori M, Murata N. Identification of conserved domains in the delta 12 desaturases of cyanobacteria. Plant Mol Biol. 1994;24:643–50. doi: 10.1007/BF00023560. [DOI] [PubMed] [Google Scholar]
- 16.Schirmer A, Rude MA, Li X, Popova E, del Cardayre SB. Microbial biosynthesis of alkanes. Science. 2010;329:559–562. doi: 10.1126/science.1187936. [DOI] [PubMed] [Google Scholar]
- 17.Steen EJ, Kang Y, Bokinsky G, Hu Z, Schirmer A, McClure A, del Cardayre SB, Keasling JD. Microbial production of fatty-acid-derived fuels and chemicals from plant biomass. Nature. 2010;463:559–62. doi: 10.1038/nature08721. [DOI] [PubMed] [Google Scholar]
- 18.White SW, Zheng J, Zhang YM, Rock CO. The structural biology of type II fatty acid biosynthesis. Annu Rev Biochem. 2005;74:791–831. doi: 10.1146/annurev.biochem.74.082803.133524. [DOI] [PubMed] [Google Scholar]
- 19.Wijffels RH, Kruse O, Hellingwerf KJ. Potential of industrial biotechnology with cyanobacteria and eukaryotic microalgae. Curr Opin Biotechnol. 2013;24:405–13. doi: 10.1016/j.copbio.2013.04.004. [DOI] [PubMed] [Google Scholar]
- 20.Xiao X, Yu X, Khosla C. Flux control between unsaturated and saturated fatty acid formation by FabA:FabB ratio in the fully reconstituted fatty acid biosynthetic pathway of E. coli. Biochemistry. 2013 doi: 10.1021/bi401116n. provisionally accepted. [DOI] [PMC free article] [PubMed] [Google Scholar]
- 21.Yu X, Liu T, Zhu F, Khosla C. In vitro reconstitution and steady-state analysis of the fatty acid synthase from Escherichia coli. Proc Natl Acad Sci U S A. 2011;108:18643–8. doi: 10.1073/pnas.1110852108. [DOI] [PMC free article] [PubMed] [Google Scholar]
- 22.Zhang F, Ouellet M, Batth TS, Adams PD, Petzold CJ, Mukhopadhyay A, Keasling JD. Enhancing fatty acid production by the expression of the regulatory transcription factor FadR. Metab Eng. 2012;14:653–60. doi: 10.1016/j.ymben.2012.08.009. [DOI] [PubMed] [Google Scholar]