

Abstract
Human fungal infections have gained recent notoriety following contamination of pharmaceuticals in the compounding process. Such invasive infections are a more serious global problem, especially for immunocompromised patients. While superficial fungal infections are common and generally curable, invasive fungal infections are often life-threatening and much harder to diagnose and treat. Despite the increasing awareness of the situation’s severity, currently available fungal diagnostic methods cannot always meet diagnostic needs, especially for invasive fungal infections. Volatile organic compounds produced by fungi provide an alternative diagnostic approach for identification of fungal strains. We report here an optoelectronic nose based on a disposable colorimetric sensor array capable of rapid differentiation and identification of pathogenic fungi based on their metabolic profiles of emitted volatiles. The sensor arrays were tested with 12 human pathogenic fungal strains grown on standard agar medium. Array responses were monitored with an ordinary flatbed scanner. All fungal strains gave unique composite responses within 3 hours and were correctly clustered using hierarchical cluster analysis. A standard jackknifed linear discriminant analysis gave a classification accuracy of 94% for 155 trials. Tensor discriminant analysis, which takes better advantage of the high dimensionality of the sensor array data, gave a classification accuracy of 98.1%. The sensor array is also able to observe metabolic changes in growth patterns upon the addition of fungicides, and this provides a facile screening tool for determining fungicide efficacy for various fungal strains in real time.
1. Introduction
Worldwide mortalities from human invasive fungal infections are comparable to those from tuberculosis or malaria, and mortality rates exceed 50%.1 Fungal infections have received increasing clinical focus,2–4 and contaminated compounding pharmacies have brought this crisis to widespread public attention.1, 5 Despite the increasing awareness of the situation’s severity, currently available fungal diagnostic methods cannot always meet diagnostic needs, especially for invasive fungal infections. Traditional culturing methods are slow and labor-intensive, immunological tests often suffer from cross contamination, and molecular diagnostic methods lack standard criteria or diagnostic scope.4, 6, 7 Thus, the development of new techniques for the rapid identification of fungal strains would be highly desirable.
The volatile organic compounds (VOCs) produced by fungi may have great utility as an alternative diagnostic approach. There are approximately 250 fungal VOCs identified (including alcohols, phenols, thiols, sulfides, hydrocarbons and aldehydes) that derive from fungal primary or secondary metabolic pathways.8 It has been shown that fungal VOC fingerprints can be used to discriminate noninvasively among medically relevant fungi9–11 and to rapidly screen and monitor the effectiveness of anti-fungal drugs.12, 13 Previous VOC identification and profiling methods, however, are either not cost-effective or not robust. Gas chromatography-mass spectrometry (GC-MS) is high-maintenance and expensive. Moreover, sample collection methods, such as solid-phase micro-extraction (SPME), can have adsorption bias and poor recovery.8 Conventional electronic nose techniques, another commonly used VOC fingerprint profiling method, rely on weak and non-specific chemical interactions that induce changes in sensors’ physical or electrical properties after exposure to VOCs.8, 14 Such electronic noses, however, are generally very sensitive to changes in humidity, require frequent recalibration, and are often limited in their sensitivity.
Previously, we have developed an optoelectronic nose approach using colorimetric sensor arrays for VOC detection and identification.15–19 The sensor consists of a disposable array of cross-responsive nanoporous pigments whose colours are changed by diverse chemical interactions with analytes and which is unresponsive to changes in humidity. This portable, inexpensive, and highly sensitive optoelectronic nose produces a composite response which generates a unique molecular fingerprint for each analyte or mixture. Colorimetric senor arrays can differentiate and identify single analytes (e.g., toxic industrial gases17, 20, 21 and explosives22) at concentrations well below 1 ppm. We have also successfully demonstrated fingerprinting and identification of complex odorant mixtures, including discrimination of the head gases of beverages,23–25 the rapid identification of human pathogenic bacteria,26 and even breath diagnosis of lung cancer.27
Herein, we report a colorimetric sensor array system for fungi differentiation and identification by profiling the composite volatile metabolites produced during fungal growth.
2. Experimental
2.1 VOC sensing experimental procedures
12 fungal strains were tested, including Candida albicans (CAI-4), Candida albicans (B311), Candida albicans (1–28), Candida glabrata-1, Candida guilliermondii, Candida parapsilosis, Trichosporon asahii 3323, Debaryomyces hansenii 3333, Candida stellatoidea, Candida keyfr, Saccharomyces cerevisiae 4742 and Kluyveromyces lactis (cf. Table S1) Strains were maintained on solid yeast extract-peptone-dextrose (YPD) medium. Fungal cell suspensions were prepared by inoculating 10 mL medium with a single colony, and liquid cultures were incubated overnight for 16 h at 30°C. A subculture was prepared by diluting the overnight culture into 10 mL fresh YPD medium to an optical density (OD600) of 0.1, where 1 OD corresponds to 2.4×10⁷ colony forming units/mL (CFU/mL). After 6 more hours of rotary shaking at 30 °C, after which all strains were in exponential phase, 4.8–107 CFU were harvested and re-suspended in 150 μL sterile water (i.e., 3.13×10⁸ CFU/mL) and then uniformly spread on 6 cm diameter plates containing 7 mL of solid YPD medium which had been pre-dried at 37 °C for 1 h. The inoculating suspension was allowed to soak into the agar medium for 10 min, after which the sensor array was exposed to the headspace, at room temperature, of the culture by replacing the original petri dish lid with one containing the sensor array and sealing with parafilm. A control with 150 μL sterile water inoculation was performed in parallel in each trial.
For anti-fungal drug experiments, 20 μL of stock drug solutions in dimethyl sulfoxide (DMSO) were added to 130 μL sterile water-suspended fungal cells. 20 μL DMSO in 130 μL sterile water was used as control.
2.2 Colorimetric sensor array and composite volatile response detection
The disposable colorimetric sensor array was prepared by printing a 6×6 matrix of nanoporous dyes onto polyvinylidene fluoride (PVDF) membrane. PVDF was chosen because it is neutral, inert, and hydrophobic. The specific dyes used for this study is listed in Table S2. In order to support the array in the head space of the culture and to easily conduct the experiments, an engineered petri dish lid was designed. The colorimetric sensor array was attached to a plastic stage via 3M double-sided tape (which showed no effect in controls), which allowed volatiles diffuse and interact with all the dyes. The stage was then secured to the petri dish lid using silicone oil (2×10⁶ cSt). After the engineered lid was in place, the Petri dish was sealed with parafilm and placed inverted on a commercially available scanner (Fig. S1) inside an incubator at 30 °C. Data was collected every 15 min using Epson Perfection V600 scanner.
Colour difference maps were generated by averaging the colour value changes of red, green and blue (RGB), at each spot. The baseline values were taken 15 min after sealing the Petri dish. Each strain has a unique colour difference map at each specific time point. Time response profiles were obtained by plotting colour changes of all 108 channels (i.e., ΔR, ΔG, ΔB values of 36 spots) over time (Fig. S3). The complete database is provided in Database S1.
2.4 Linear Discriminant Analysis (LDA) and Tensor Discriminant Analysis (TDA)
Linear discriminant analysis28 was performed using a commercially available program, SYSTAT13 (Systat Software Chicago, Illinois, USA, 2009). The data set consisted of 155 array responses (i.e., observations) at a single time (180 min). In the classification matrix (Table S3), each observation is classified into the group where the value of its classification function is largest. All 13 classes, including 12 strains and 1 background, were classified 100% correctly. A Jackknifed classification (leave-one-out cross-validation) was used to test the predictability of the sensor array: one observation is left out and the rest of the data are used as a training set to generate the linear discriminant function, the model is then tested with the single left-out observation, and the procedure is then iterated through all of the observations in turn. The accuracy thus determined for the Jackknifed LDA prediction was 94%. The complete Jackknifed classification matrix table is shown in Table S4.
For our tensor discriminant analysis (TDA), we used the colour difference changes (ΔR ΔG ΔB) from all 36 dye spots for 9 different times (from 120 min to 360 min in 30 min intervals). TDA is a generalization of LDA to multiway arrays.29–31 TDA constructs optimal linear classifiers in a trimodal fashion, optimized separately for (1) the combination vector of dye spot, (2) the effects of the three colour factors (ΔR ΔG ΔB) for each dye, and (3) the temporal progression. The general strategy of the TDA algorithm in the colorimetric sensor array classification can be clearly illustrated using the flow chart given below in Scheme S1.29
3. Results and Discussion
3.1 Colorimetric Sensor Arrays
A colorimetric sensor array uses cross-reactive chemoresponsive colorants whose colour changes reflect a diverse range of chemical interactions between the analytes and the colorants. We have developed an optimized set of 36 dyes that yield an essentially universal chemical sensor array.17 The dyes fall into four classes: (1) dyes containing metal ions (e.g., metalloporphyrins) that respond to Lewis basicity (that is, electron-pair donation, metal-ion ligation), (2) pH indicators that respond to Brønsted acidity/basicity (that is, proton acidity and hydrogen bonding), (3) dyes with large permanent dipoles (e.g., vapochromic or solvatochromic dyes) that respond to local polarity, and (4) metal salts that participate in redox and precipatory reactions. This colorimetric sensor array, therefore, is responsive to the chemical reactivity of analytes, rather than to their effects on secondary physical properties (e.g., mass, conductivity, adsorption, etc.). The specific dyes used for this study are given in Table S2.
We selected twelve clinically and commercially relevant fungal strains to test the CSA’s ability to differentiate strains based on their VOC profiles. These twelve strains (Table S1) were grown on YPD agar (yeast extract, peptone, and dextrose), a commonly used rich growth medium chosen because it accommodates a wide range of fungal strains. It is worth mentioning that YPD medium (control, Fig. S3) also gives off volatiles. As a result, the signals obtained from the CSA colour changes are from the combined volatiles from the YPD medium and from the fungi.
3.2 Colour difference maps and time response profiles
For analysis of the colorimetric sensor arrays, colour difference maps were generated from the colour values (i.e., red, green and blue (RGB) values) for each spot at any given time by subtracting the baseline values of each spot taken at 15 min after the Petri dish was sealed. Representative difference maps are given for Candida albicans (CAI-4) from 15 to 480 min are given in Fig. 2A. At any given time, each of the 12 fungal strains shows a unique colour difference map; for example, Fig. S2 shows the colour difference maps of the 12 strains after 180 min growth. The colour difference maps of all 12 strains are clearly differentiable by eye, even before any statistical analysis. Qualitatively, one may easily differentiate among the three Candida albicans strains, and identify Debaryomyces hansenii, which is often misdiagnosed as Candida guilliermondii32.
Fig. 2.

Sensor array response to Candida albicans (CAI-4) out-gases. (A) Colour difference maps (i.e., ΔR, ΔG and ΔB of 36 sensor spots) at different time points were generated by subtracting the RGB values from baseline at 15 minutes after sealing of Petri dish. For visualization in the colour difference maps, four bit colour was expanded to 8 bit colour (i.e., the RGB values of 4–19 were expanded to 0–255). (B) Temporal profile from the 10 most responsive channels vs. time.
Time response profiles were obtained by plotting the colour changes of the individual channels (i.e., ΔR, ΔG, ΔB values for 36 spots) vs. time. For clarity of presentation, only the ten most responsive channels are shown in Fig. 2B, again for C. albicans as an example. The time response profiles for all 12 strains of fungi are provided as Fig. S3. The differences in the time response provides for each of the fungal strains serve as fingerprints that allow one both to qualitatively differentiate and identify strains even by the naked eye and to provide a quantitative pattern analysis.
The time response profiles for different fungal strains vary both in the intensities of the colour changes and in the times at which such response begin to occur. For example, thiols and sulfides are common metabolites among fungi,33 and the sensor spot that are most responsive to thiols and sulfides (i.e., the blue, green, and purple lines in Figure 2B and Figure S3) do indeed undergo large colour changes. The timings of these colour changes, however, are strain specific: rapid changes occur for C. albicans (CAI-4) (even after just 15 min), whereas the changes begin to occur only after 180 min for C. keyfr, 450 min for C. stellatoidea, and not at all with D. hansenii. This thiol and sulfide responding spot has a dye formulation containing Pb(O2CCH3)2 (Table S2).
3.4 Pattern Recognition and Statistical Analysis
To provide a statistically meaningful analysis, we utilized a standard chemometric approach, hierarchical cluster analysis (HCA),28 to discriminate the VOC temporal profiles among the 12 strains and to demonstrate excellent reproducibility among replicates. HCA is a model-free clustering analysis that generates a dendrogram based on the Euclidean distances between the difference maps of each trial using all 108 dimensions. No mis-clusterings were observed for data from 155 trials after 180 min growth (Fig. 3A), which demonstrates that the method is reproducible and differentiates among different strains of fungi. It is worth noting that the clustering is not directly related to fungal phylogenetic classifications. This is not surprising as our methodology detects metabolic byproducts and is only indirectly responsive to genomic sequence: we are probing the metabolomics of the microorganisms, not their genomes.
Fig. 3.

Classification analysis. (A) Hierarchical cluster analysis dendrogram (using Ward’s method) of 12 fungal strains and YPD medium background at 180 min with 2.4×10⁷ colony forming units of inoculation; no errors in clustering were observed among a total of 155 trials. (B) Scatter plot of the first two directions from the tensor discriminant analysis. Surprising good discrimination of the fungal strains is achieved even with only two TDA directions, which account for only 18.2% of the total discriminant power. The accuracy of classification using TDA maximizes at 98.1% using an optimal 10 dimensions.
To provide a quantitative evaluation of the accuracy of classification of the fungal strains by our colorimetric sensor arrays, we first completed a standard linear discriminant analysis (LDA). LDA of the array response (i.e., the RGB colour changes of each sensor spot) at 180 min gave a classification matrix with no errors (Table S3). To quantitatively test the prediction accuracy of a new unknown input using LDA, a standard Jackknifed analysis was performed (leaving out one observation at a time and permuting through the full dataset), giving a prediction accuracy of 94% (Table S4). Data from these colorimetric sensor arrays have an exceptionally high dimensionality, and LDA does not provide optimal classification with such data due to the “curse of dimensionality” (i.e., the difficulties that a large number of dimensions can create for function approximation, model fitting, information extraction, as well as computation).34
Tensor discriminant analysis (TDA) is an array generalization of LDA better able to take advantage of high dimensionality.30, 31 More precisely, tensor discriminant analysis is used to classify multi-way array measurements (i.e., “tensor measurements”), rather than one-way vector measurements. The data collected using colorimetric sensor arrays can be viewed as a 3-way tensor with the first mode corresponding to choice of the dye, the second mode corresponding to the effects of the colour changes (i.e., ΔR, ΔG, ΔB), and the third mode corresponding to the time progression.29 The general strategy of tensor discriminant analysis is to find orthogonal linear classifiers so as to maximize the ratio of between-class variation to within-class variation (i.e., to maximize discrimination among classes). Those orthogonal linear classifiers are essentially linear combinations of the three-way interactions of (1) the effects of the dye spot choice, (2) the three colour changes of each spot (i.e., ΔR, ΔG, ΔB), and (3) the temporal evolution.
Tensor discriminant analysis can greatly improve the sensitivity, specificity, and computational efficiency of discriminant analysis method.29–31 LDA and most other existing classification methods largely ignore the array structure of the colorimetric sensor array data: the three colour changes for each spot are not fully independent dimensions compared to the three colour changes of the other spots. For our array data over time, LDA would simply vectorize each 3-way observation into a vector with 972 dimensions (36×3×9, i.e., where 36 dyes × 3 colour factors (ΔR ΔG ΔB) × 9 time points (120 min to 360 min in 30 min intervals)) and find classifiers using 972 parameters. In contrast, TDA constructs the optimal linear classifiers and estimates them in a trimodal tensor (separating spot choice, colour, and time). By separating these three classes of effects, we can (1) keep the original design information and avoid interpretation difficulties, (2) substantially limit the effective dimensionality (we only need 48 parameters (i.e., 36+3+9) for TDA, rather than 972 parameters in LDA or PCA), and (3) improve prediction accuracy.
As a result, the directions created in TDA are not obscured by the noise present in the very large number of additional dimensions in LDA or PCA. As a consequence, excellent discrimination of the fungal strains is achieved even with only two TDA directions, which account for only 18.2% of the total discriminant power (as defined by the ratio of the between-group variation to the within-group variation), as seen in Figure 3B. The prediction accuracy of TDA was assessed quantitatively by using a Jackknifed classification (leave-one-out cross-validation using the rest of the data as a training set and permuting through the full dataset). The prediction accuracy of the tensor discriminant analysis reaches a maximum of 98.1% using an optimal 10 dimensions (Fig. S4, based on 155 trials).
3.5 Limit of Detection
The limit of detection (LOD) at a given time may be defined as the smallest number of viable fungal cells in the initial inoculum that will give a response from a single channel that is larger than three times the noise at that given time. A more quantitative measure of the LOD at 720 min can be approximated as 3[I]σ/Cmax where [I] is the initial inoculum concentration, σ is the standard deviation of the channel with the largest net colour response at 720 min, and Cmax is that largest net colour response. Time response profiles of the 10 most responsive channels of array response to Candida albicans (CAI-4) is shown in Figure 4. We can interpolate the LOD from the three lowest initial inocula (Fig. S5), and calculate the LOD after 720 min. to be 2×10⁴ CFU for the initial inoculum. One may also define a time to detection as the time at which the response of a single channel is larger than three times the noise. Not surprisingly, there is a roughly linear correlation between the time to detection vs. the log of the initial inoculum (Fig. S6); for example, with an initial inoculum of 106 CFU, the time to detection is ~400 min.
Fig. 4.

Time response profiles of the 10 most responsive channels of array response to Candida albicans (CAI-4) after subtraction of the YPD growth medium background. As the initial inoculum is decreased, the time response profiles decrease in intensity. At 720 min, the LOD is approximately 2×10⁴ CFU.
3.6 Effects of Fungicides on Metabolic Patterns
Although chemical profiling at a single time point can be achieved by methods such as GC-MS, monitoring the changing VOC profile continuously during culture growth is challenging. Using this colorimetric sensor array, however, one can monitor cell growth conditions continuously and inexpensively. It is well established that there are changes of metabolic states in response to fungicides35, 36, and we should expect that the VOCs produced by the fungi should therefore change under drug induced stress. In this manner, the colorimetric sensor array can be used to monitor changes in fungal metabolic states or in response to fungicides during cell growth.
Indeed, the array response (as measured by the total change in the Euclidian distance (ΔED) of all 108 colour channels) of C. albicans (CAI-4) is substantially affected by the presence of various concentrations of clotrimazole or miconazole (Fig. 5A). The colour difference maps (Fig. 5B) demonstrate the shut-down of VOC production at high concentrations of anti-fungal drugs: volatiles are no longer being released (and the ΔED of the sensor array no longer changes) after roughly 180 min, for clotrimazole at >400 μg/mL and for miconazole at >0.5 μg/mL, which represent the minimum inhibitory concentrations of two drugs. At lower concentrations, the volatile metabolites are clearly changed, relative to untreated fungi, which can lead to either greater or diminished sensor array response (Fig. 5B). While the colorimetric sensor array does not provide a direct indication of what the changes in the VOCs may be (i.e., the component by component analysis provided by GC-MS, for example), it does yield a rapid and simple indication that significant metabolic changes are occurring. This could prove useful for rapid parallel screening of fungicidal effectiveness.
Fig. 5.

Sensor array response to fungal volatiles under the influence of anti-fungal drugs. (A) Total array response (change in Euclidean distance after subtraction of background) under the influence of fungicidal drugs. Significant changes in array response are observed vs. clortrimazole or miconazole concentrations. (B) Colour difference maps vs. YPD growth medium control after 400 min as a function of fungicide concentration. Changes in the array response patterns appear to occur at ≥10 ng/mL clotrimazole and at ≥1 ng/mL for miconazole, which are presumably due to changes of metabolic states under the stress of the anti-fungal drug environment. The complete shutdown of volatile metabolites occurs at >400 μg/mL clotrimazole and at >0.5 μg/mL miconazole.
4. Conclusions
In summary, we have used an optoelectronic nose to detect fungal VOCs and generate unique metabolic patterns that differentiate among twelve different fungal strains with high accuracy. The sensor array is also able to observe metabolic changes in growth patterns upon the addition of fungicides, which provides a facile screening tool for determining fungicide efficacy in real time.
Supplementary Material
Fig. 1.
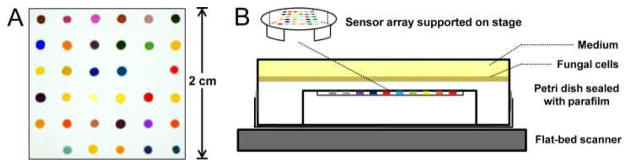
Schematic experimental apparatus. (A) An image of the CSA from a flat-bed scanner with different responsive dyes printed on hydrophobic PVDF substrate. For a complete list of dyes used in this research see Supporting Information. (B) Inverted Petri dish showing a colorimetric sensor array supported in a plastic stage in the head gas volume. Fungal cells were uniformly inoculated on YPD agar growth medium and the array digitally imaged with a flatbed scanner inside an incubator at 30 °C. Colour changes were obtained as a function of time.
Acknowledgments
This work was supported through NIH GEI award U01ES016011. We thank Professor Lois L. Hoyer for generously providing fungal strains. We thank Jacqueline M. Rankin and John R.G. Sander for helpful suggestions and advice. KSS has financial interests in iSense LLC, which is commercializing applications of colorimetric sensor arrays. No funding from iSense was involved in this research.
References
- 1.Brown GD, Denning DW, Gow NAR, Levitz SM, Netea MG, White TC. Science Translational Medicine. 2012;4:1–9. doi: 10.1126/scitranslmed.3004404. [DOI] [PubMed] [Google Scholar]
- 2.Brown GD, Denning DW, Levitz SM. Science. 2012;336:647–647. doi: 10.1126/science.1222236. [DOI] [PubMed] [Google Scholar]
- 3.Nucci M, Marr KA. Clin Infect Dis. 2005;41:521–526. doi: 10.1086/432060. [DOI] [PubMed] [Google Scholar]
- 4.Murray PR, Masur H. Critical care medicine. 2012;40:3277–3282. doi: 10.1097/CCM.0b013e318270e771. [DOI] [PMC free article] [PubMed] [Google Scholar]
- 5.Kuehn BM. JAMA-J Am Med Assoc. 2013;309:219–221. doi: 10.1001/jama.2012.187705. [DOI] [PubMed] [Google Scholar]
- 6.Klutts JS, Robinson-Dunn B. J Clin Microbiol. 2011;49:S39–S42. [Google Scholar]
- 7.Yeo SF, Wong B. Clin Microbiol Rev. 2002;15:465–484. doi: 10.1128/CMR.15.3.465-484.2002. [DOI] [PMC free article] [PubMed] [Google Scholar]
- 8.Morath SU, Hung R, Bennett JW. Fungal Biol Rev. 2012;26:73–83. [Google Scholar]
- 9.Sahgal N, Monk B, Wasil M, Magan N. Br J Dermatol. 2006;155:1209–1216. doi: 10.1111/j.1365-2133.2006.07549.x. [DOI] [PubMed] [Google Scholar]
- 10.Scotter JM, Langford VS, Wilson PF, McEwan MJ, Chambers ST. J Microbiol Methods. 2005;63:127–134. doi: 10.1016/j.mimet.2005.02.022. [DOI] [PubMed] [Google Scholar]
- 11.Sahgal N, Magan N. Sensors Actuators B: Chem. 2008;131:117–120. [Google Scholar]
- 12.Naraghi K, Sahgal N, Adriaans B, Barr H, Magan N. Sensors Actuators B: Chem. 2010;146:521–526. [Google Scholar]
- 13.Pont NP, Kendall CA, Magan N. Mycopathologia. 2012;173:93–101. doi: 10.1007/s11046-011-9490-y. [DOI] [PubMed] [Google Scholar]
- 14.Rock F, Barsan N, Weimar U. Chem Rev. 2008;108:705–725. doi: 10.1021/cr068121q. [DOI] [PubMed] [Google Scholar]
- 15.Rakow NA, Suslick KS. Nature. 2000;406:710–713. doi: 10.1038/35021028. [DOI] [PubMed] [Google Scholar]
- 16.Suslick KS. Current Opinion Chem Biol. 2012;16:557–563. doi: 10.1016/j.cbpa.2012.10.030. [DOI] [PMC free article] [PubMed] [Google Scholar]
- 17.Lim SH, Feng L, Kemling JW, Musto CJ, Suslick KS. Nat Chem. 2009;1:562–567. doi: 10.1038/nchem.360. [DOI] [PMC free article] [PubMed] [Google Scholar]
- 18.Janzen MC, Ponder JB, Bailey DP, Ingison CK, Suslick KS. Anal Chem. 2006;78:3591–3600. doi: 10.1021/ac052111s. [DOI] [PubMed] [Google Scholar]
- 19.Suslick KS, Bailey DP, Ingison CK, Janzen M, Kosal ME, McNamara WB, III, Rakow NA, Sen A, Weaver JJ, Wilson JB, Zhang C, Nakagaki S. Quim Nova. 2007;30:677–681. [Google Scholar]
- 20.Feng L, Musto CJ, Kemling JW, Lim SH, Zhong W, Suslick KS. Anal Chem. 2010;82:9433–9440. doi: 10.1021/ac1020886. [DOI] [PubMed] [Google Scholar]
- 21.Feng L, Musto CJ, Kemling JW, Lim SH, Suslick KS. Chem Commun. 2010;46:2037–2039. doi: 10.1039/b926848k. [DOI] [PMC free article] [PubMed] [Google Scholar]
- 22.Lin H, Suslick KS. J Am Chem Soc. 2010;132:15519–15521. doi: 10.1021/ja107419t. [DOI] [PubMed] [Google Scholar]
- 23.Suslick BA, Feng L, Suslick KS. Anal Chem. 2010;82:2067–2073. doi: 10.1021/ac902823w. [DOI] [PMC free article] [PubMed] [Google Scholar]
- 24.Zhang C, Bailey DP, Suslick KS. J Agric Food Chem. 2006;54:4925–4931. doi: 10.1021/jf060110a. [DOI] [PubMed] [Google Scholar]
- 25.Zhang C, Suslick KS. J Agric Food Chem. 2007;55:237–242. doi: 10.1021/jf0624695. [DOI] [PubMed] [Google Scholar]
- 26.Carey JR, Suslick KS, Hulkower KI, Imlay JA, Imlay KR, Ingison CK, Ponder JB, Sen A, Wittrig AE. J Am Chem Soc. 2011;133:7571–7576. doi: 10.1021/ja201634d. [DOI] [PMC free article] [PubMed] [Google Scholar]
- 27.Mazzone PJ, Wang XF, Xu YM, Mekhail T, Beukemann MC, Na J, Kemling JW, Suslick KS, Sasidhar M. Journal of Thoracic Oncology. 2012;7:137–142. doi: 10.1097/JTO.0b013e318233d80f. [DOI] [PMC free article] [PubMed] [Google Scholar]
- 28.Haswell SJ. Practical guide to chemometrics. CRC Press; 1992. [Google Scholar]
- 29.Zhong W, Suslick KS. Technometrics. 2013:55. doi: 10.1080/00401706.2014.965347. in press. http://publish.illinois.edu/wenxuan/files/2012/2012/matrix_clust.pdf. [DOI] [PMC free article] [PubMed]
- 30.Li B, KMK, Altman N. Ann Statist. 2010;38:1094–1121. [Google Scholar]
- 31.Zeng P, Zhong W. Dimension reduction for tensor classification. New York: 2013. [Google Scholar]
- 32.Desnos-Ollivier M, Ragon M, Robert V, Raoux D, Gantier JC, Dromer F. J Clin Microbiol. 2008;46:3237–3242. doi: 10.1128/JCM.01451-08. [DOI] [PMC free article] [PubMed] [Google Scholar]
- 33.Newton GL, Arnold K, Price MS, Sherrill C, Delcardayre SB, Aharonowitz Y, Cohen G, Davies J, Fahey RC, Davis C. J Bacteriol. 1996;178:1990–1995. doi: 10.1128/jb.178.7.1990-1995.1996. [DOI] [PMC free article] [PubMed] [Google Scholar]
- 34.Donoho DL. AMS Math Challenges Lecture. 2000:1–32. www-stat.stanford.edu/~donoho/Lectures/AMS2000/Curses.pdf.
- 35.Belenky P, Camacho D, Collins JJ. Cell Reports. 2013;3:350–358. doi: 10.1016/j.celrep.2012.12.021. [DOI] [PMC free article] [PubMed] [Google Scholar]
- 36.Cannon RD, Lamping E, Holmes AR, Niimi K, Tanabe K, Niimi M, Monk BC. Microbiology. 2007;153:3211–3217. doi: 10.1099/mic.0.2007/010405-0. [DOI] [PubMed] [Google Scholar]
Associated Data
This section collects any data citations, data availability statements, or supplementary materials included in this article.